TCV · HERMES-3 · UPSTREAM → DIVERTOR
Filament Tracer
Upstream observations → divertor predictions. Ridge currently performs best.
EXPERIMENT 2 · PREDICTION
Upstream plane → native target planes
Two observed fields in; four downstream fields out. Each time uses a fresh upstream observation.
Observed upstream
Hover over a target to compare the same cell.
Movie details
Coordinates, colors and scoring protocol
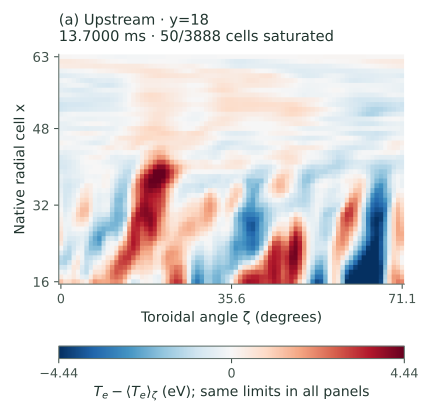
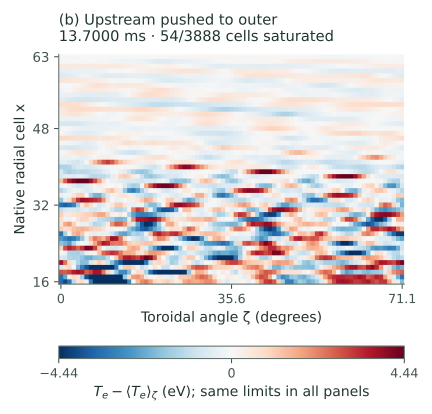
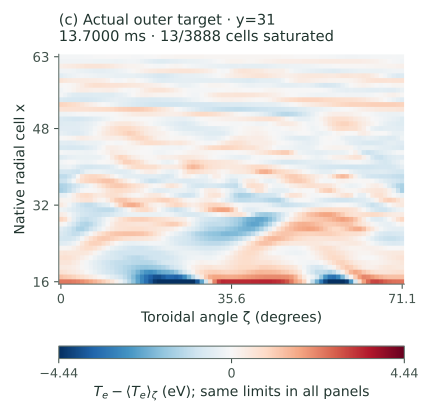
Vertical: native radial index x=16 at the bottom to x=63 at the top. Larger x goes farther into the scrape-off layer. These are cell addresses, not metres. Horizontal: toroidal sample centers ζ=0–71.11° in a periodic 72° wedge. Ben’s raw radial indices include two guards: 18–65 are our 16–63. Selecting inner/outer changes the poloidal slice y, not the radial axis.
Every target retains all 48×81 native cells. Smooth view evaluates their periodic Fourier series at eight display samples per toroidal cell, with radial rows unchanged and no alignment shift. Native view remains available. Both views use identical scores; smooth interpolation can overshoot. Target truth and prediction share one fixed color scale across the 48 displayed frames. Residual uses the same magnitude limit on a signed scale. Fluctuation limits are the 99th percentile of displayed truth amplitude; absolute-field limits use its maximum. Saturated cells are counted under each image. Inputs have separately labeled scales.
Full-field errors use all scored frames and equal weight per native target cell; changing the color transformation never changes those scores. The toroidally varying score removes the instantaneous toroidal mean of each training-mean anomaly (n≠0), with its own zero-anomaly reference. These inspected trajectories do not establish transfer to an independent plasma condition.
What we can predict
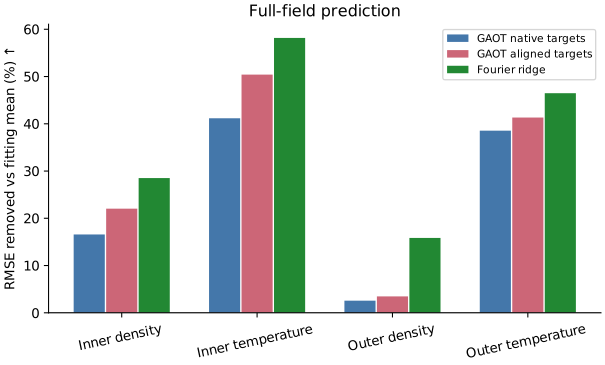
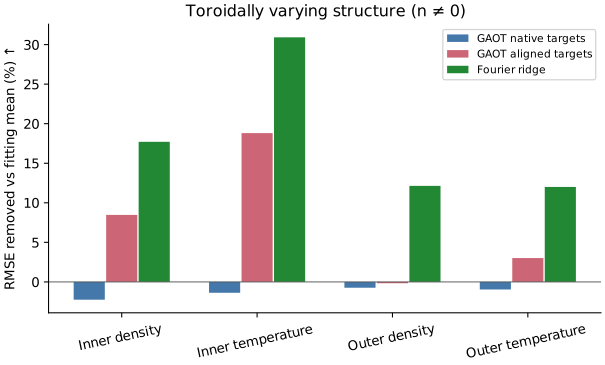
Temperature is easier than density. The right-hand panel isolates the toroidally varying structure, so a good broad-profile prediction cannot hide the missed filaments.
Does training along the winding help?
Yes for this GAOT comparison; ridge still wins. Aligned training lowers native-cell MAE and RMSE on all four outputs compared with the matched native-target model. Both completed 400 epochs, with epoch 40 selected by validation. Earlier GAOT already aligned targets: this adds the missing native control.
| Target | Native GAOT | Aligned GAOT | Ridge |
|---|---|---|---|
| Inner density | 16.6% | 22.0% | 28.5% |
| Inner temperature | 41.2% | 50.4% | 58.2% |
| Outer density | 2.6% | 3.5% | 15.8% |
| Outer temperature | 38.5% | 41.3% | 46.5% |
Component errors and comparison scope
For toroidally varying structure alone, aligned GAOT removes 8.5% / 18.8% of inner density / temperature RMSE and −0.2% / 3.0% at the outer target. Ridge removes 17.7% / 30.9% and 12.1% / 12.0%, respectively. The hard remaining problem is reconstructing those varying structures, especially outer density.
Same upstream Ne/Te, same refined geometry, model and seed; target coordinates alone differ. Predictions are inverted to original native cells before scoring, without display interpolation. One seed, 648 previously inspected regression frames; this is not independent generalization evidence. Existing movie choices retain their historical model identities. ·.
Magnetic map + fitted gain versus ridge
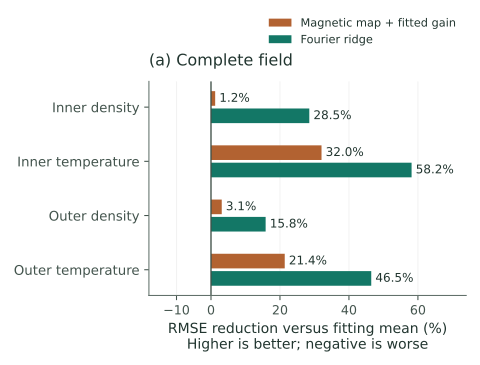
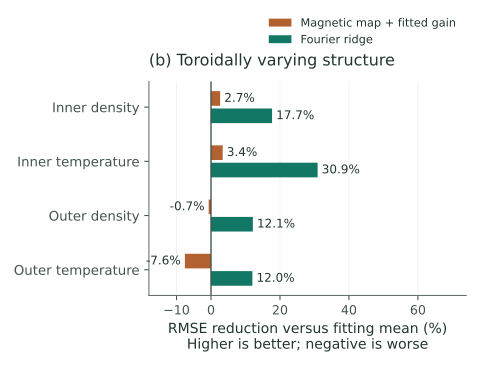
Exact baseline scores, including the unchanged-amplitude map
| Target | Mapped anomaly | Map + gain | Fourier ridge |
|---|---|---|---|
| Inner nₑ | -525.0% | 1.2% | 28.5% |
| Inner Tₑ | -32.8% | 32.0% | 58.2% |
| Outer nₑ | -350.3% | 3.1% | 15.8% |
| Outer Tₑ | -47.3% | 21.4% | 46.5% |
Where errors sit radially
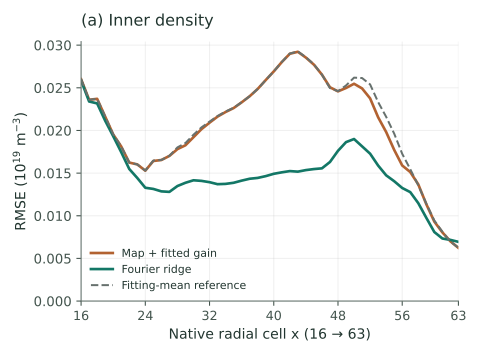
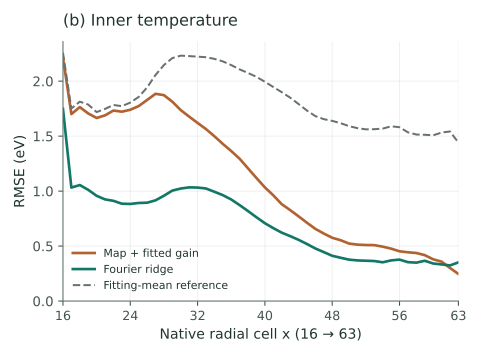
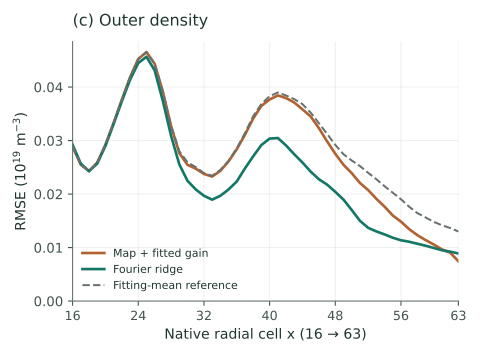
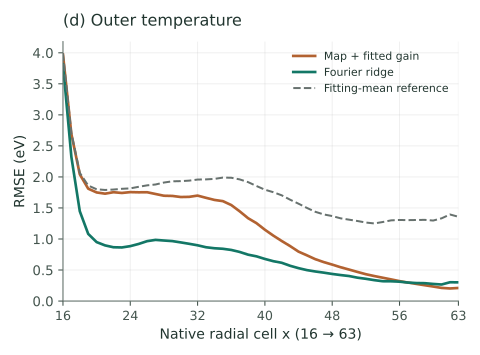
In the archived matched pilot, ridge beats GAOT on all four outputs. GAOT stopped at epoch 192 of 400; that does not establish the ceiling of neural prediction.
| Predicted field | Mean reference MAE ↓ | Linear ridge MAE ↓ | GAOT MAE ↓ | Ridge MAE removed ↑ |
|---|---|---|---|---|
| Inner density 10¹⁹ m⁻³ | 0.01685 | 0.01212 | 0.01401 | 28.1% |
| Inner temperature eV | 1.481 | 0.5343 | 0.6703 | 63.9% |
| Outer density 10¹⁹ m⁻³ | 0.02288 | 0.01831 | 0.02429 | 20.0% |
| Outer temperature eV | 1.379 | 0.5714 | 0.726 | 58.6% |
Full-field RMSE and prediction correlation
Correlation compares predicted and true target anomalies, pooling matching cells and times after subtracting each cell’s training-time mean. It is not upstream-versus-downstream correlation or percent accuracy.
| Field | Ridge: correlation / RMSE reduction | GAOT: correlation / RMSE reduction | Physical RMSE: ridge / GAOT |
|---|---|---|---|
| Inner density | 0.695 / 27.5% | 0.594 / 17.7% | 0.0157 / 0.01783 |
| Inner temperature | 0.910 / 58.8% | 0.873 / 51.3% | 0.7636 / 0.9029 |
| Outer density | 0.533 / 15.7% | 0.228 / -11.6% | 0.02523 / 0.03338 |
| Outer temperature | 0.848 / 47.1% | 0.780 / 36.5% | 0.9397 / 1.129 |
Physical units match the MAE table. Reference RMSE is the error of the cellwise training mean. MSE skill = 1 − MSE/reference MSE; RMSE reduction uses the square root and is a different number.
How much varying structure was recovered?
| Varying pattern only (n≠0) | Ridge RMSE removed ↑ | GAOT RMSE removed ↑ |
|---|---|---|
| Inner density | 17.8% | 1.9% |
| Inner temperature | 31.3% | 20.9% |
| Outer density | 12.4% | -19.6% |
| Outer temperature | 13.1% | -6.8% |
What the restricted view tells us
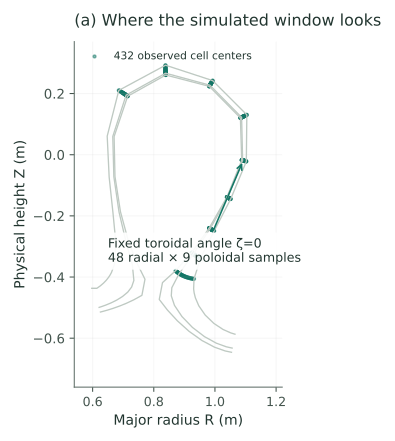
The older pilot predicts complete target planes from a strip at one toroidal angle. Four input frames improve the recorded full-field scores. This is an exploratory result with the validation limitation stated above.
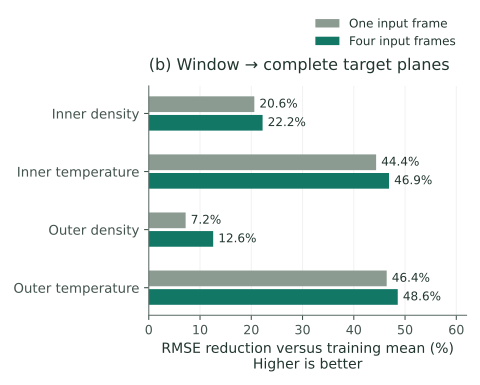
Exact window scores and scope
| Target | 1 input frame | 4 input frames |
|---|---|---|
| Inner nₑ | 20.6% | 22.2% |
| Inner Tₑ | 44.4% | 46.9% |
| Outer nₑ | 7.2% | 12.6% |
| Outer Tₑ | 46.4% | 48.6% |
The plane and window runs use different records and inputs, so their scores do not isolate the effect of restricting the view. A real camera adds emissivity, line-of-sight integration and an optical footprint. None of those is implemented in this field-strip pilot.
EXPERIMENT 1 · CONNECTION
Was the mapping wrong?
Our geometry-only forward copy had a reversed shift; that is fixed. The separate target-to-upstream alignment used for the lag curves already had the correct sign. Ben’s script and the now-accessible refined mesh confirm the convention. We score only the connected SOL rows x=16–63.
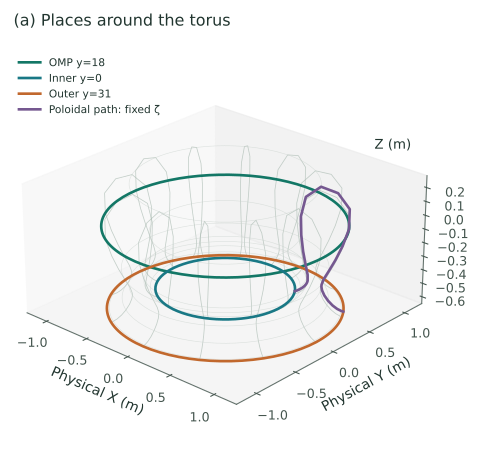
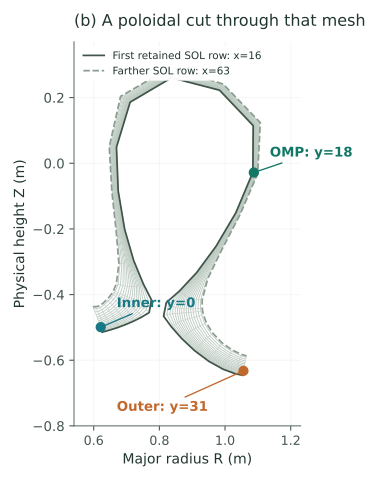
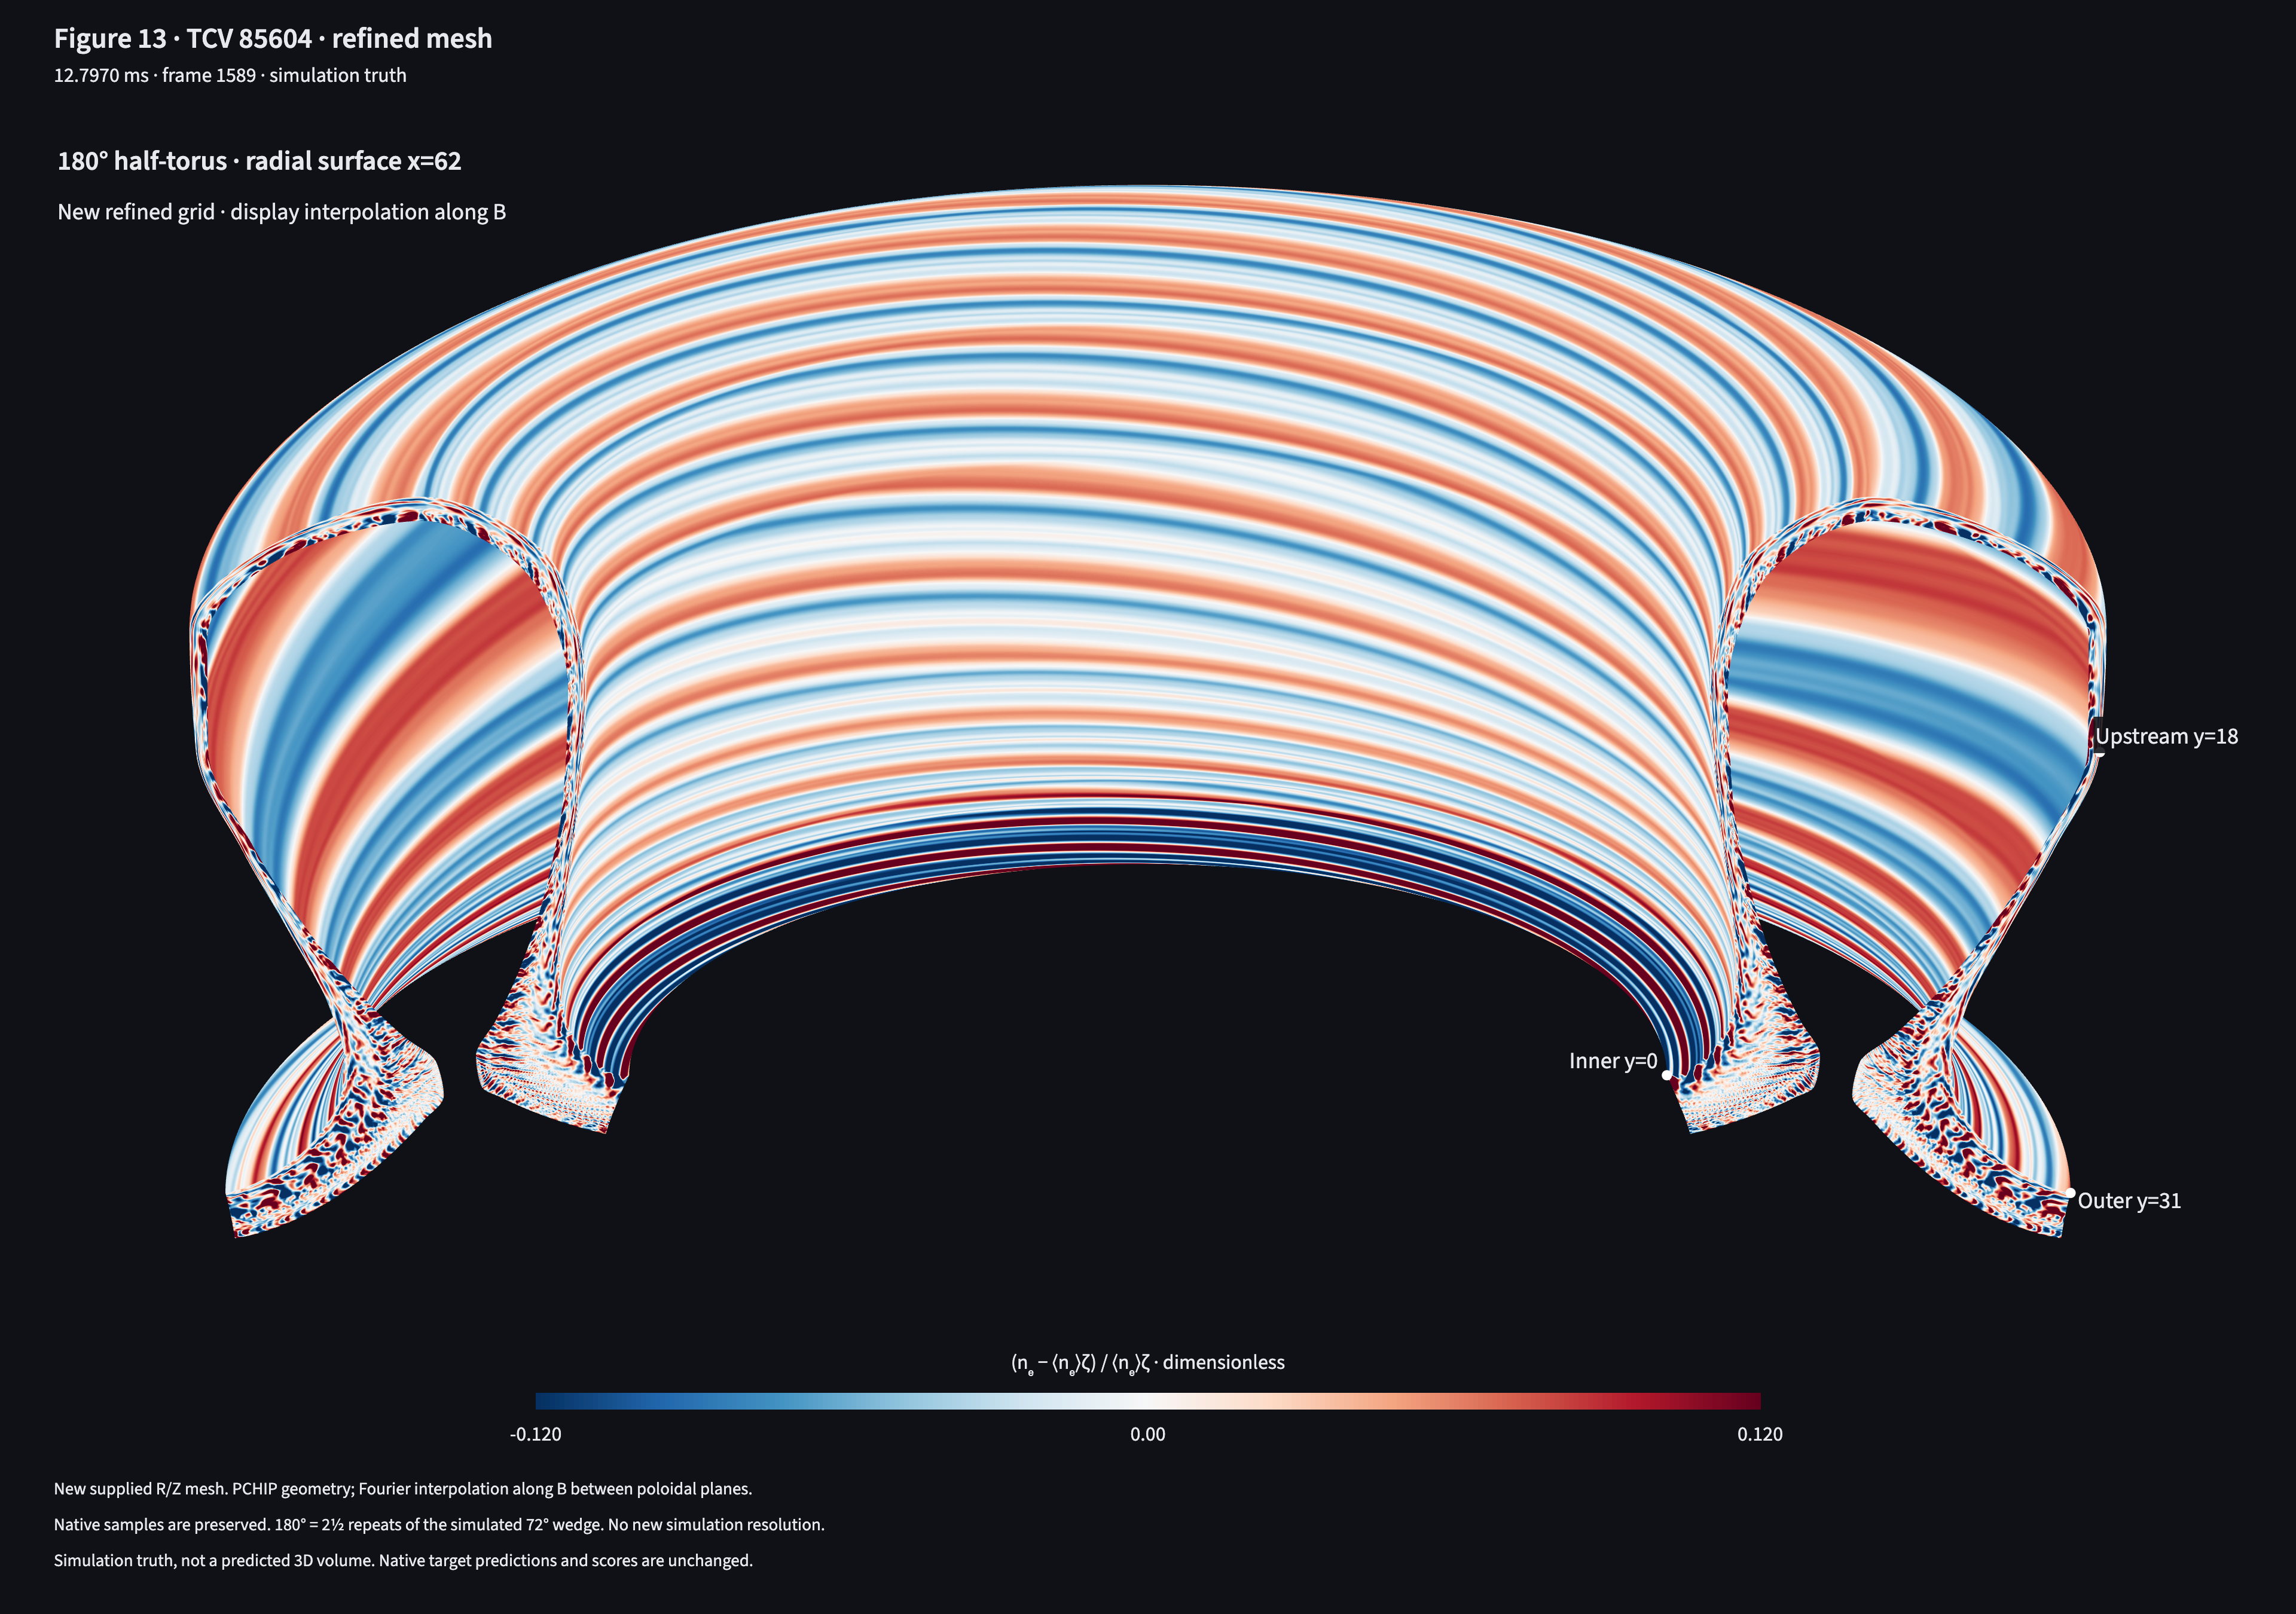
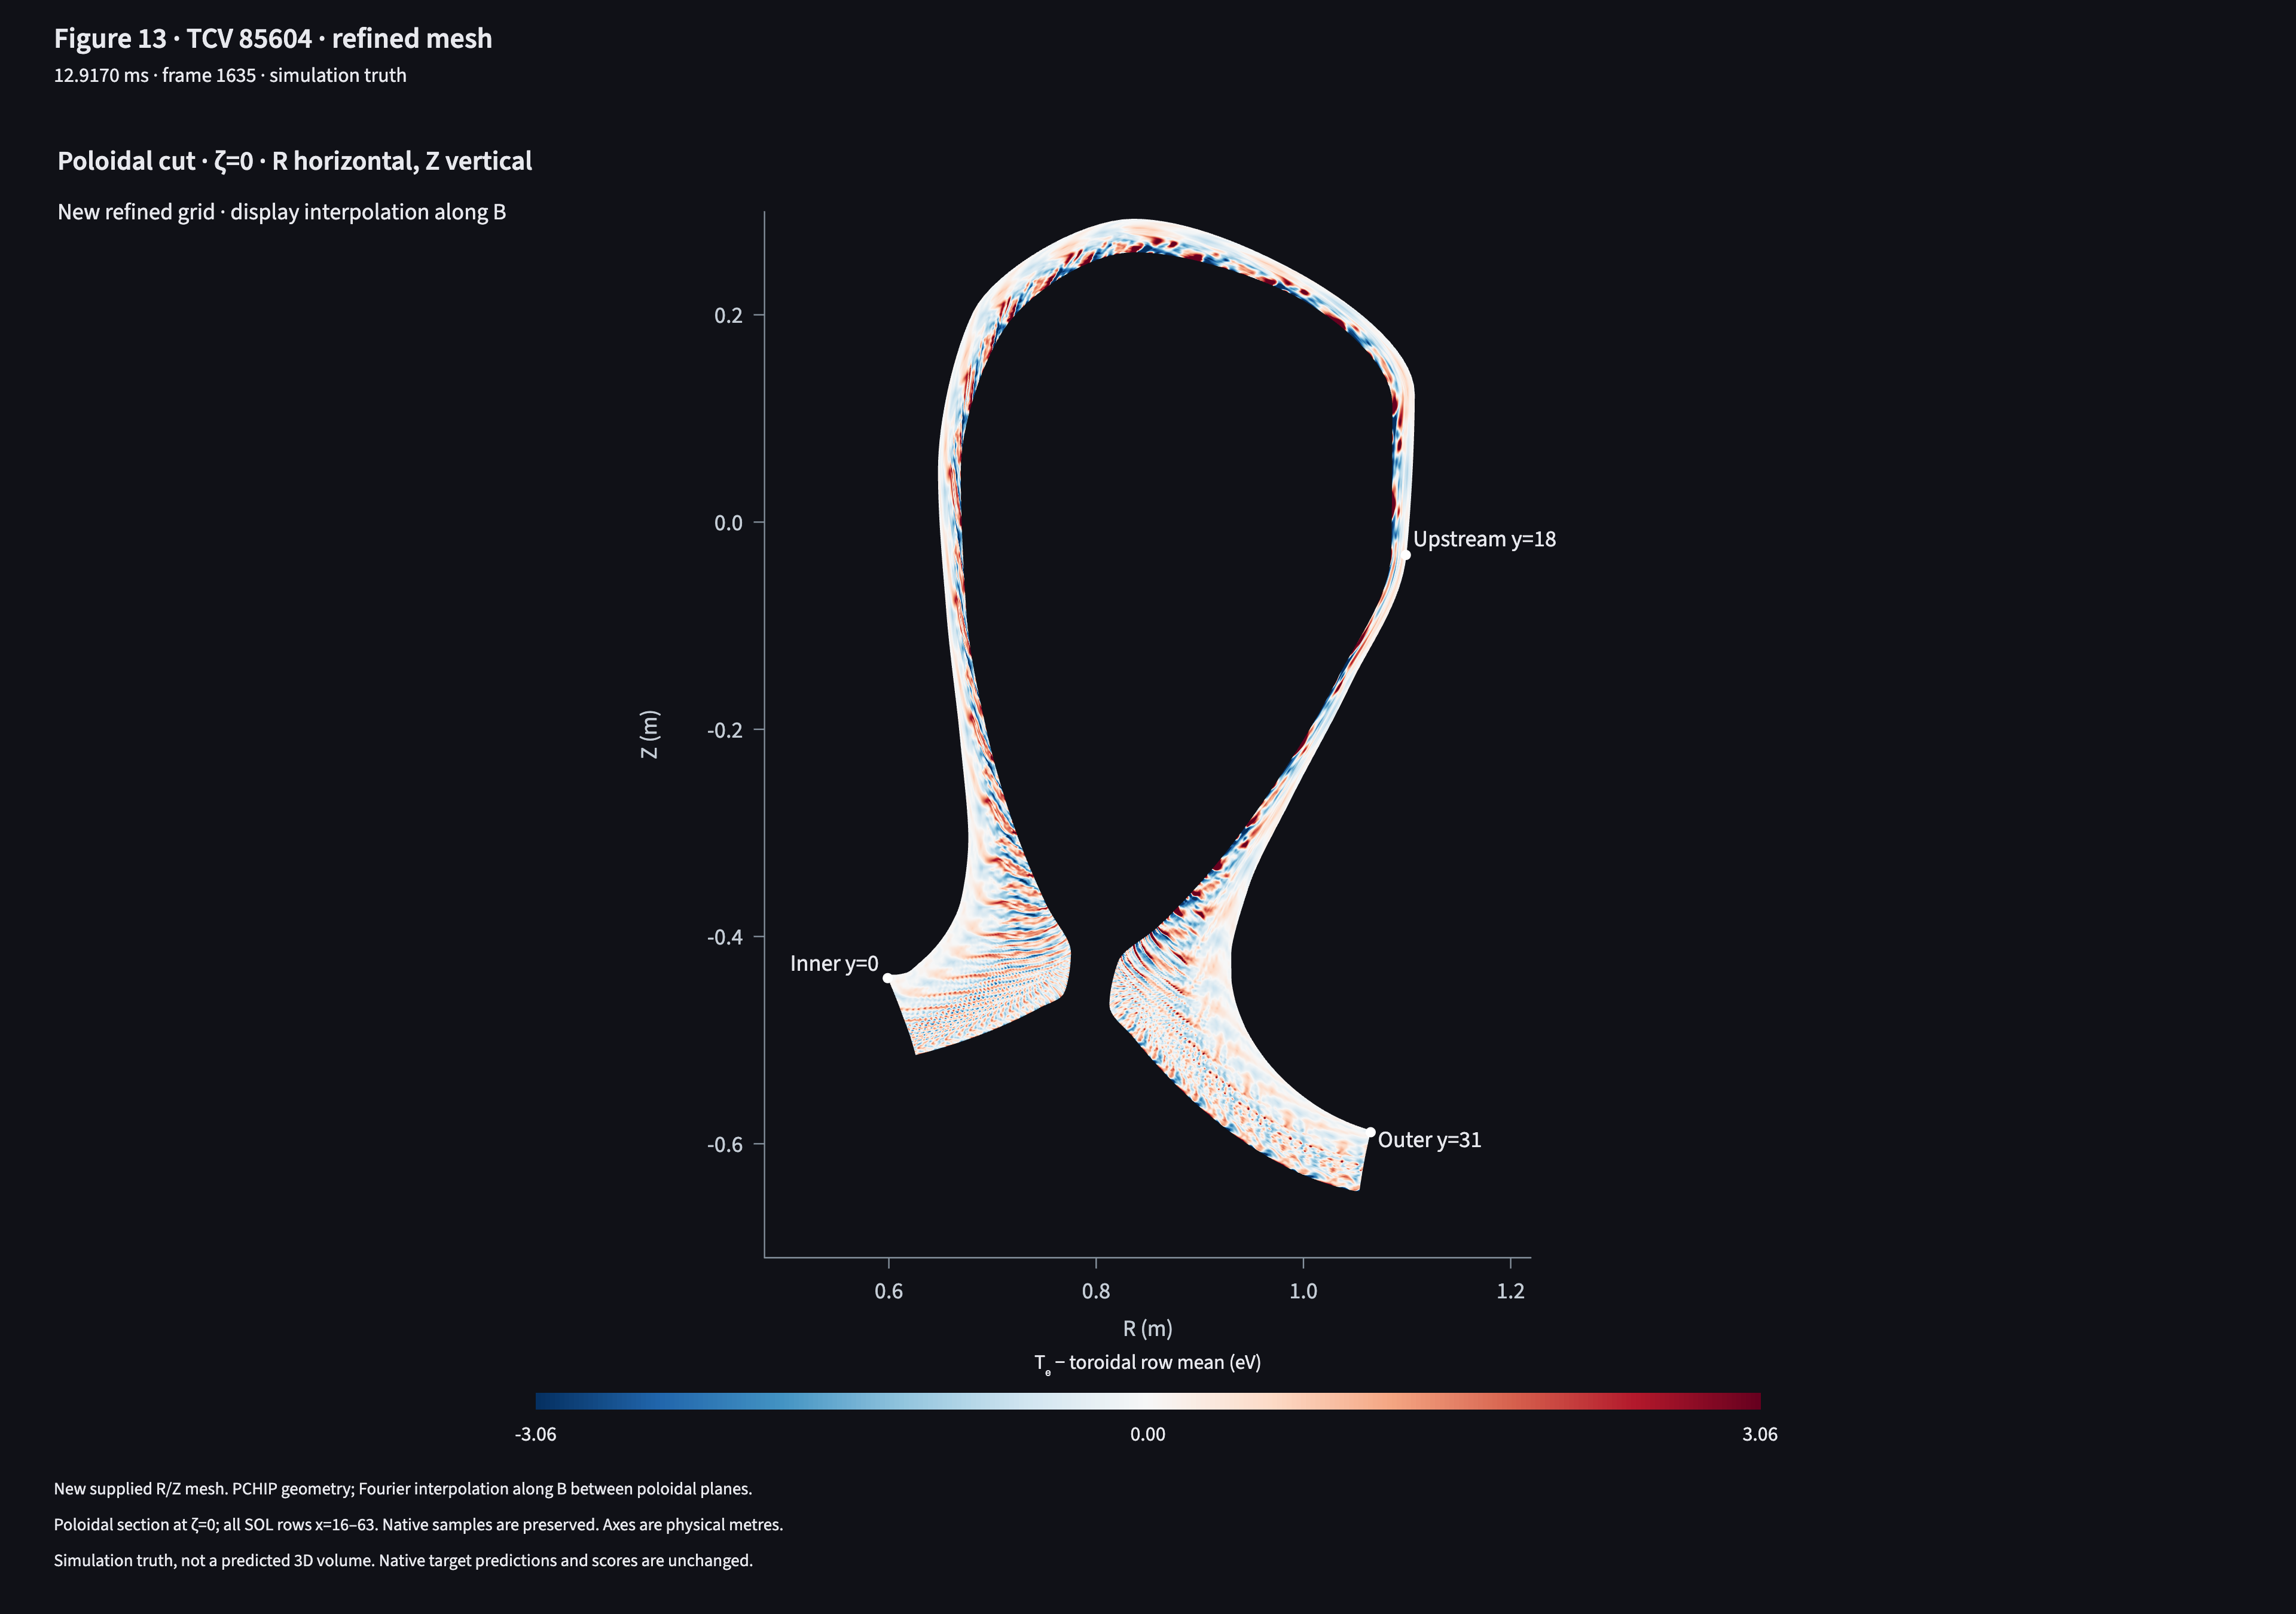
Figure 13 · Explore the mesh and plasma volume
Volume: all available SOL rows, x=16–63. Color uses the same field scale. Transparency reveals the interior; it is a visualization setting, not camera brightness.
Ben’s original video
Same simulation time, density fraction, ±0.12 colorbar and half-torus view. Our rendering uses the newly verified mesh; Ben’s exact rendering settings are not known.
Native simulation indices and display sampling.
4K examples: Density half-torus · 12.7970 ms · Temperature section · 12.9170 ms.
Upstream pattern mapped to the target
OMP = outer midplane; B = magnetic field. Shift the upstream pattern along the magnetic connection, keeping its amplitude unchanged.
Ben’s original movies
Figure 6a · Ben’s poloidal cross-section
Figure 6b · Ben’s half-torus reference
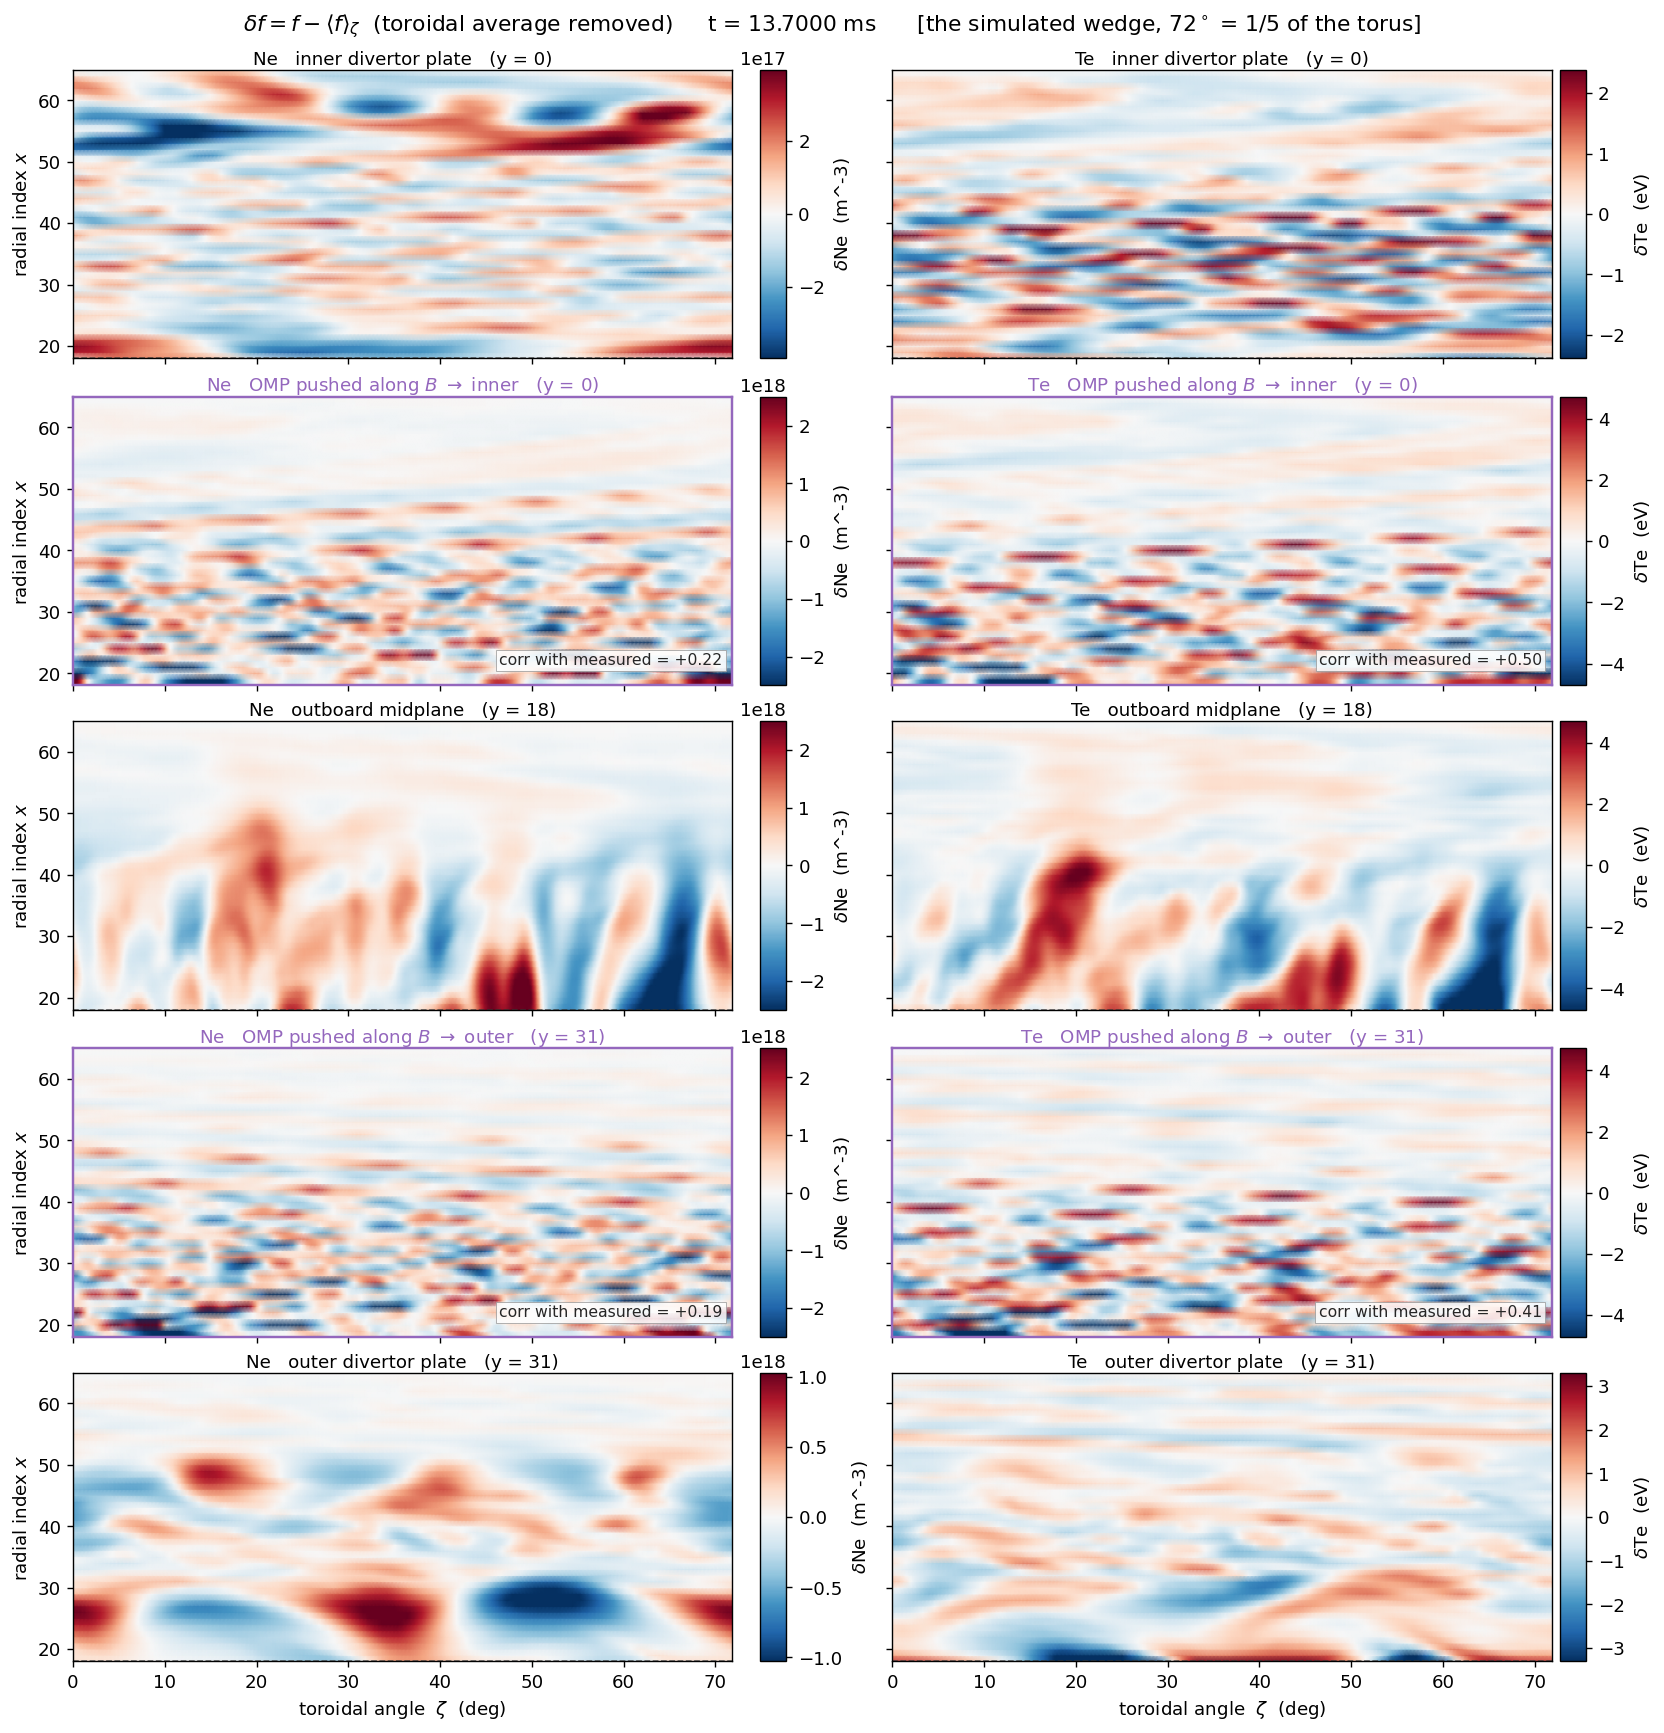
Figure 7 · Ben’s original five-row snapshot and source script
Did the outer leg become more connected?
The stronger inner-leg match remains in this record after the checked mapping. Temperature is more connected than density, and the varying-pattern peak remains near zero sampled delay. Those are measured relationships; the map check does not establish the physical cause of the asymmetry.
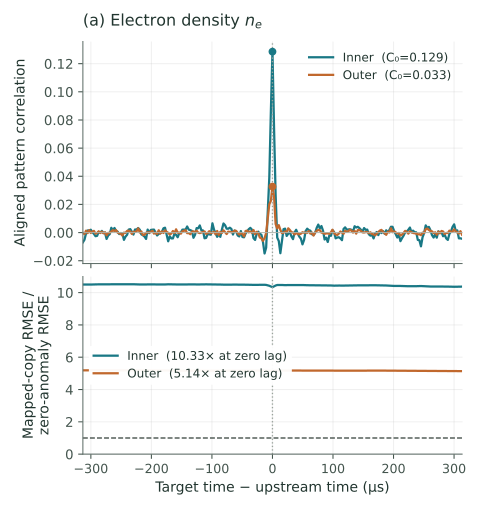
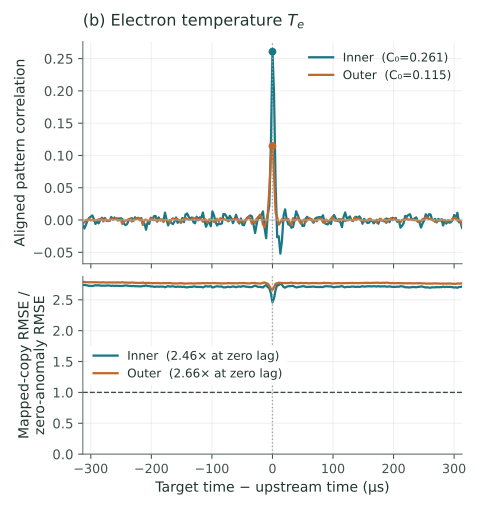
Why a lag peak is not a sound-speed measurement
Ben’s distinction matters: advection and conduction/diffusion act together, and conditions vary along the field line. A local target sound speed is not a path-integrated transit model. These passive correlation curves do not measure an imposed perturbation’s travel time. The n=0 component is the toroidal average and can still evolve in time; it is not automatically a static equilibrium.
September 4 follow-up
The refined mesh and magnetic shift are checked. Field alignment improves GAOT across all four target outputs; Fourier ridge still has lower errors. Recovering toroidally varying structure remains the main challenge.
One seed on a previously inspected 85604 regression block. The window results are an older exploratory pilot, not an optical-camera benchmark. Same-time reconstruction, not a future-time forecast.
The physics and the models, simply
A tokamak confines plasma with a twisting magnetic field. Outside the confinement boundary, open field lines lead to the divertor targets. The plasma can change along those lines through flows, heat transport, sources and losses; a connected line need not carry an unchanged image.
Experiment 1: compare actual upstream and target fluctuations after accounting for magnetic geometry. Experiment 2: learn from earlier upstream/target pairs, then predict later target fields using only upstream observations. These movies reconstruct each observed instant; they do not integrate a complete plasma state forward in time.
The models: a magnetic map copies a pattern with the correct twist; a fitted gain also changes its amplitude. Fourier ridge learns how upstream radial profiles combine into downstream profiles, separately at each toroidal wavelength. GAOT learns a nonlinear mapping. The controlled comparison tests whether its coordinate correction improves prediction under the same fitting and scoring protocol.
Next: use the verified comparison and errors by radial row and wavelength to choose the next change, then define a physically meaningful camera footprint and measurement before claiming camera performance.