petch — machine settings in, measured profiles out
petch starts from a plasma tool's own settings and ends with the etched 3-D profile, on one GPU,
in seconds. It runs on real chip layouts, it is scored against measured wafers, and it reproduces textbook
physics with its production code.
0.70–0.95×
hole etch rate against measured, at all five
biases, starting from a Lam TCP 9400's settings with nothing tuned
7 of 10
held-out wafer holes predicted within 15 % (median
error 8.5 %, from 30 % with the published surface model)
32×
faster than ViennaPS on the same GPU and the same holes
~1¢
per 3-D gate-window etch at 5 nm on one rented
RTX 4090 (70–110 s)
01From the tool's knobs to the wafer surface
Pick a bias. The chamber view shows the plasma a Lam TCP 9400 makes at 800 W and 25 mTorr; the
numbers on the right are what reactorlab predicts lands on the wafer. Below, the sheath: the thin dark layer where the
bias accelerates ions straight down into the features while electrons, much lighter and hotter, are held back
except for a brief burst each rf cycle. The ion trajectories and the energy histogram come from petch's sheath model.
Plasma density drawn as the lowest diffusion mode of the chamber, scaled to reactorlab's electron
density; particles are illustrative. Sheath: collisionless Child-law model with reactorlab's sheath voltage, electron
temperature and ion transit time; the 2 MHz button shows the same plasma with a slower bias, where ions cross in
under a cycle and their energies split into two peaks. Not to scale: the sheath is about a thousand times thicker than
the features.
02From a chip layout to etched gates, in 3-D
Our automated chip-production chain designs a small AI accelerator tile, builds it from
real standard cells, and finds the densest patch of polysilicon gates. petch then etches that patch in 3-D
and reports, gate by gate, whether the film cleared, how far it recessed, and the etched gate length.
Design and process are scored in one loop.
Drag to rotate, scroll to zoom, cut to slice. A 0.6 × 0.6 µm window
of the placed layout: 100 nm poly-Si under a 50 nm hard mask, SF6/O2 for 10 s,
computed at 1.25 nm (the mesh is thinned to 5 nm for your browser). Colours mark height bands:
Si, poly-Si, mask.
RTL
16×16 INT4×INT8 multiply-accumulate tile, checked
against a golden model (31 cases)
Synthesis
yosys onto the open Nangate45 cell library
Placement
real standard-cell GDS, placed in rows
Window
the densest polysilicon patch, clipped from the layout
3-D etch
petch on one GPU, film and mask from the process stack
Metrology
clearing, recess and gate length per gate
clears
Every opening clears
petch reports, gap by gap, that the
100 nm film between the gates is fully removed at this recipe, with no residue at the window edges.
0.2–0.5 s
The recipe punches the gate oxide
With a 1.5 nm
gate oxide added, the poly clears in about 3 s, so the 10 s recipe is about 230 % over-etch. The oxide is
exposed at 3.3 s and punched through 0.2–0.5 s later. That recipe cannot be used on that oxide. (The
oxide etch law is taken from the literature, not fitted to this tool.)
1¢ · 6 min · 1–2.5 h
Cost per window
Wall time at 5, 2.5 and
1.25 nm on a shared, rented RTX 4090: 70–110 s, 6–9 min and 50–150 min. That is cheap enough
to screen recipes against a whole layout.
03Machine settings in, profile out
A plasma model (reactorlab, 0-D SF6/O2/Ar) turns the settings of a Lam
TCP 9400 — 800 W, 25 mTorr, SF6/O2 40/40 sccm, rf bias −20 to
−160 V — into fluorine, oxygen and ion fluxes, ion energies and ion angles. petch takes those and etches
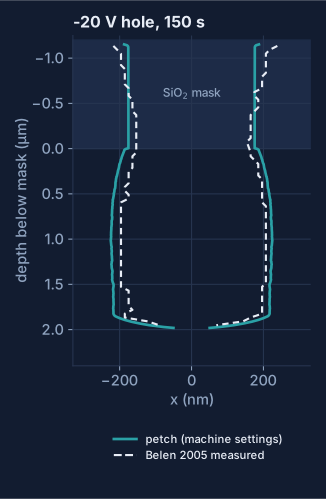
0.35 µm holes through a 1.2 µm oxide mask for 150 s. Nothing is fitted to the holes, and the
test was written down and frozen in the repository before the first run.
Each hole is one simulated cell of a square array with mirror walls, shown 3 × 3 and cut in half (press cut to close it). The frames come from a rerun of the scored runs with the same inputs; final depths agree within 3 nm.
Centre cross-sections of the same runs, four cells side by side. The dashed lines are the walls
Belen et al. (2005) measured after 150 s. At −20 V the prediction lands on them. At
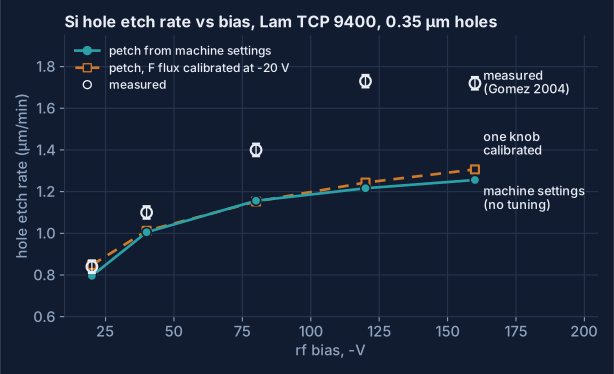
−160 V the measured hole is deeper still: section 04 shows what closes that gap.Etch rate against bias. Straight from machine settings, petch is within 0.70–0.95× of the measured
rate at every bias. Calibrating one fluorine-flux knob at −20 V barely changes the curve: the gap at high
bias is in how the etch responds to bias, not in the overall flux level.
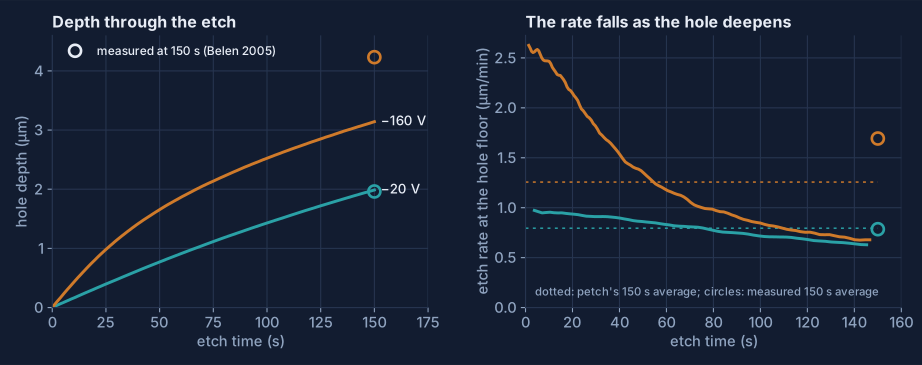
The same two runs through the whole etch. At −20 V the floor etch rate barely changes. At
−160 V petch starts at 2.6 µm/min and slows to 0.7 as the hole deepens, averaging 1.26 against a
measured 1.69 µm/min. The wafers were only imaged at 150 s, so the circles are averages, not a time
history. The shortfall builds up as the hole gets deep, which points at how much fluorine reaches the floor of a
deep hole.
Not independent of the data: reactorlab's own calibration used the fluxes Belen fitted to this
chamber. What the test does show is that the chain from settings to profile runs end to end with no per-case
tuning and lands within a factor of 0.7–0.95 on rate.
04Predicting wafers it was not tuned on
The published SF6/O2 surface model (Belen 2005, the one ViennaPS ships) etches
deep holes too slowly at high bias. Raising one of its constants, the ion-enhanced etch threshold, from 15 to
25 eV — set on Belen's bias scan alone, by a rule frozen in the repository before the test — lets the
model run on fluxes close to the ones Belen measured. Then it predicts the oxygen and pressure scans it never saw.
8.5 %
Median depth error on held-out holes
Ten conditions
across two oxygen scans and two pressures, none used to set anything. The published model: 30 %.
7 of 10
Within 15 % of the wafer
Up from 1 of 10. The
0.5 µm holes at 44 and 50 % O2 land within 0.3 %.
0.77
Of Belen's measured fluxes
The one flux scale the model
needs, up from 0.40: with the right threshold, the measured fluxes and the measured holes come within 25 % of each other.
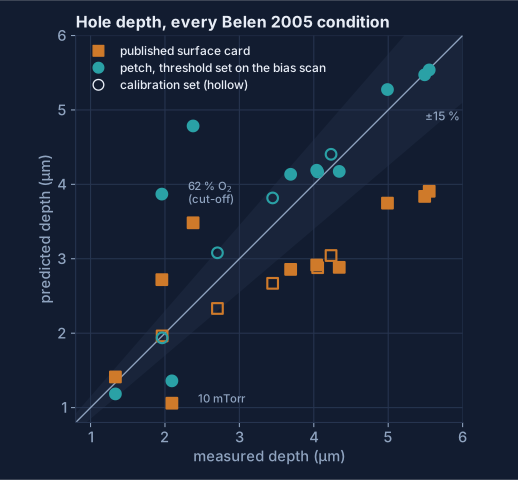
Every Belen 2005 hole. Hollow: the bias scan the threshold was set on. Solid: predictions. The two
points far above the line are the oxygen cut-off at 62 % O2, where real etching collapses and the
model's does not yet; the low one is the 10 mTorr hole. Protocol BELEN-2005-PROFILES-V2.
05Against ViennaPS, on measured wafers
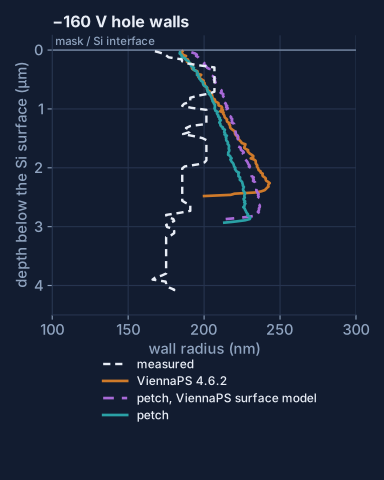
We gave ViennaPS 4.6.2 and petch the same job: Belen's fitted fluxes for five bias settings, the
same ion energies and angles, the same 20 nm grid, one flux scale calibrated on the −20 V hole, and the
same RTX 4090 (ViennaPS on its OptiX GPU engine). Then we scored all of them against the holes Belen measured.
The −160 V hole, both engines on one wall clock. petch finishes the 150 s etch in
20 s; ViennaPS takes 562 s. The dashed line is the measured depth.
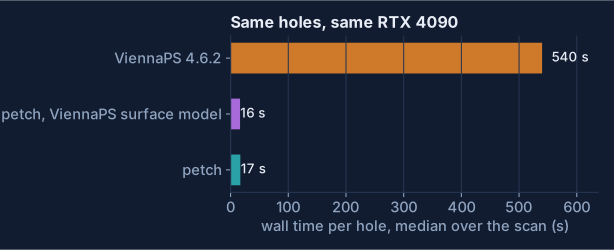
32×
Faster on the same GPU
Median wall time per
150 s hole: 17 s for petch, 540 s for ViennaPS.
22 vs 17 nm
Wall shape
Median wall error against the measured profiles over the four uncalibrated biases, petch vs ViennaPS
(petch running ViennaPS's own physics: 30 nm). The wall is compared down to
90 % of the shallower hole, so the shallower ViennaPS holes are scored over less wall.
25 % / 34 %
Depth: both miss
Median depth error (petch / ViennaPS). Both etch too slowly at high bias: the shared surface model is the limit there, not the engine.
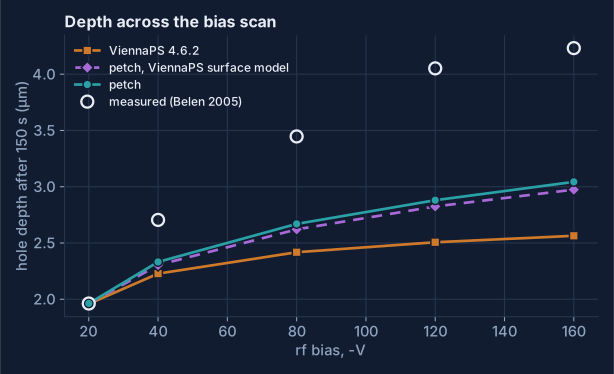
Depth after 150 s across the bias scan. All three engines are pinned to the measured depth at
−20 V by the one calibrated flux scale.The −160 V hole walls against the measured profile.
Wall time per hole on one RTX 4090, median over the five biases, each run alone on the GPU.
06Checked against textbook physics
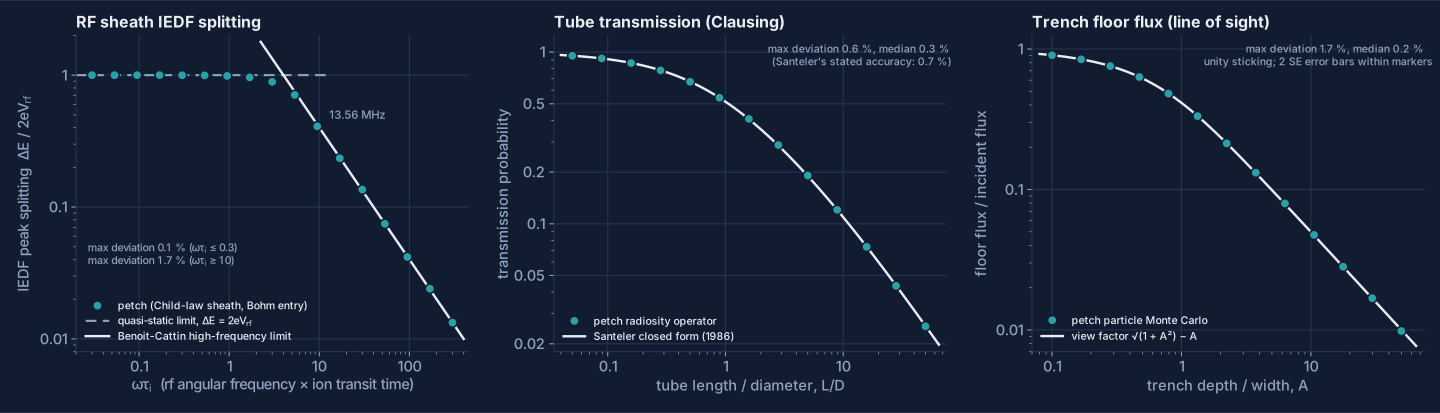
Where the answer is known exactly, petch's production code reproduces it: the ion-energy spread
of an rf sheath across three decades of frequency, the Clausing transmission of a tube, and the line-of-sight flux
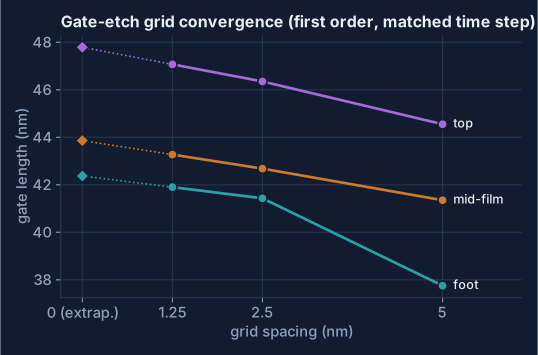
reaching the floor of a trench. And the numbers hold when the grid is refined.
Markers: petch. Lines: the analytic results — Benoit-Cattin's high-frequency sheath limit and the
quasi-static 2eVrf limit (agreement within 1.7 % and 0.1 %), Santeler's closed form for the
Clausing tube (within 0.6 %, inside the formula's own 0.7 % accuracy), and the exact view factor for a
trench (within Monte Carlo noise).
Gate length on the layout window against grid spacing: first-order convergence, about 1 nm of
grid error at 2.5 nm. Extrapolated: 42.4 / 43.9 / 47.8 nm (foot / mid / top) for a 50 nm drawn
gate, within about 1 nm of ViennaPS on the same window.The −20 V hole from section 03 as a profile, against Belen 2005's measured walls.
07What's new since July
Reactor in the loop
A plasma model turns power, pressure, gas flows and bias into the
fluxes, ion energies and angles petch etches with, so a recipe can be the input.
Real layouts in 3-D
GDS windows from a placed design go straight into a 3-D etch, with
clearing, recess and gate length reported per gate.
Seconds per feature
A 150 s hole etch in about 20 s on one RTX 4090; GPU
surface meshing 18–55× faster than the CPU path with identical meshes.
More physics
Ion fragmentation on reflection, Yamamura–Tawara sputter yields, two-component
ion angular distributions, an eroding SiO2 mask, gate-oxide punch-through, e-beam exposure.
Scored against wafers
Test protocols are written down and frozen in the repository before
the first run, and every verdict is published as it falls.
Movies from the solver
Every frame on this page is the solver's own level set, saved during
the run and drawn in your browser.
Status & claim boundaries
Known limits. The oxygen cut-off at 62 % O2 and the 10 mTorr hole are not yet
reproduced. Wall shapes are about 35 nm off in the median. Sections 03 and 05 run the published surface
model; section 04's threshold is set on Belen's bias scan with the fluxes Belen fitted to these holes. His fitted ion
flux is about twice the ion current Gomez measured in the same chamber (0.8–0.9 mA/cm2), which
reactorlab reproduces to within about 15 %; re-setting the threshold on measured-flux inputs, so the
machine-settings chain inherits it, is the next step.
Hole tests: Gomez 2004 and Belen 2005 (same chamber); protocols frozen before the first scored run
(GOMEZ-2004-HOLE-PROFILE-V1, BELEN-2005-PROFILES-V1, REACTORLAB-PETCH-GOMEZ-E2E-V1). The machine-settings chain
is not independent of Belen's data (reactorlab's calibration used Belen's fluxes). Gate-window results are
geometric metrology on the level set for one etch step, with literature chemistry not calibrated to any fab;
device-level verdicts are not claimed. The gate-oxide finding rests on transferred SiO2 etch laws.
Costs are wall time on a shared, rented RTX 4090 at $0.46/h. Meshes in the 3-D viewers are thinned for the
browser; the metrology uses the full-resolution fields.
scroll to zoom · drag to pan ·
double-click to toggle · Esc to close