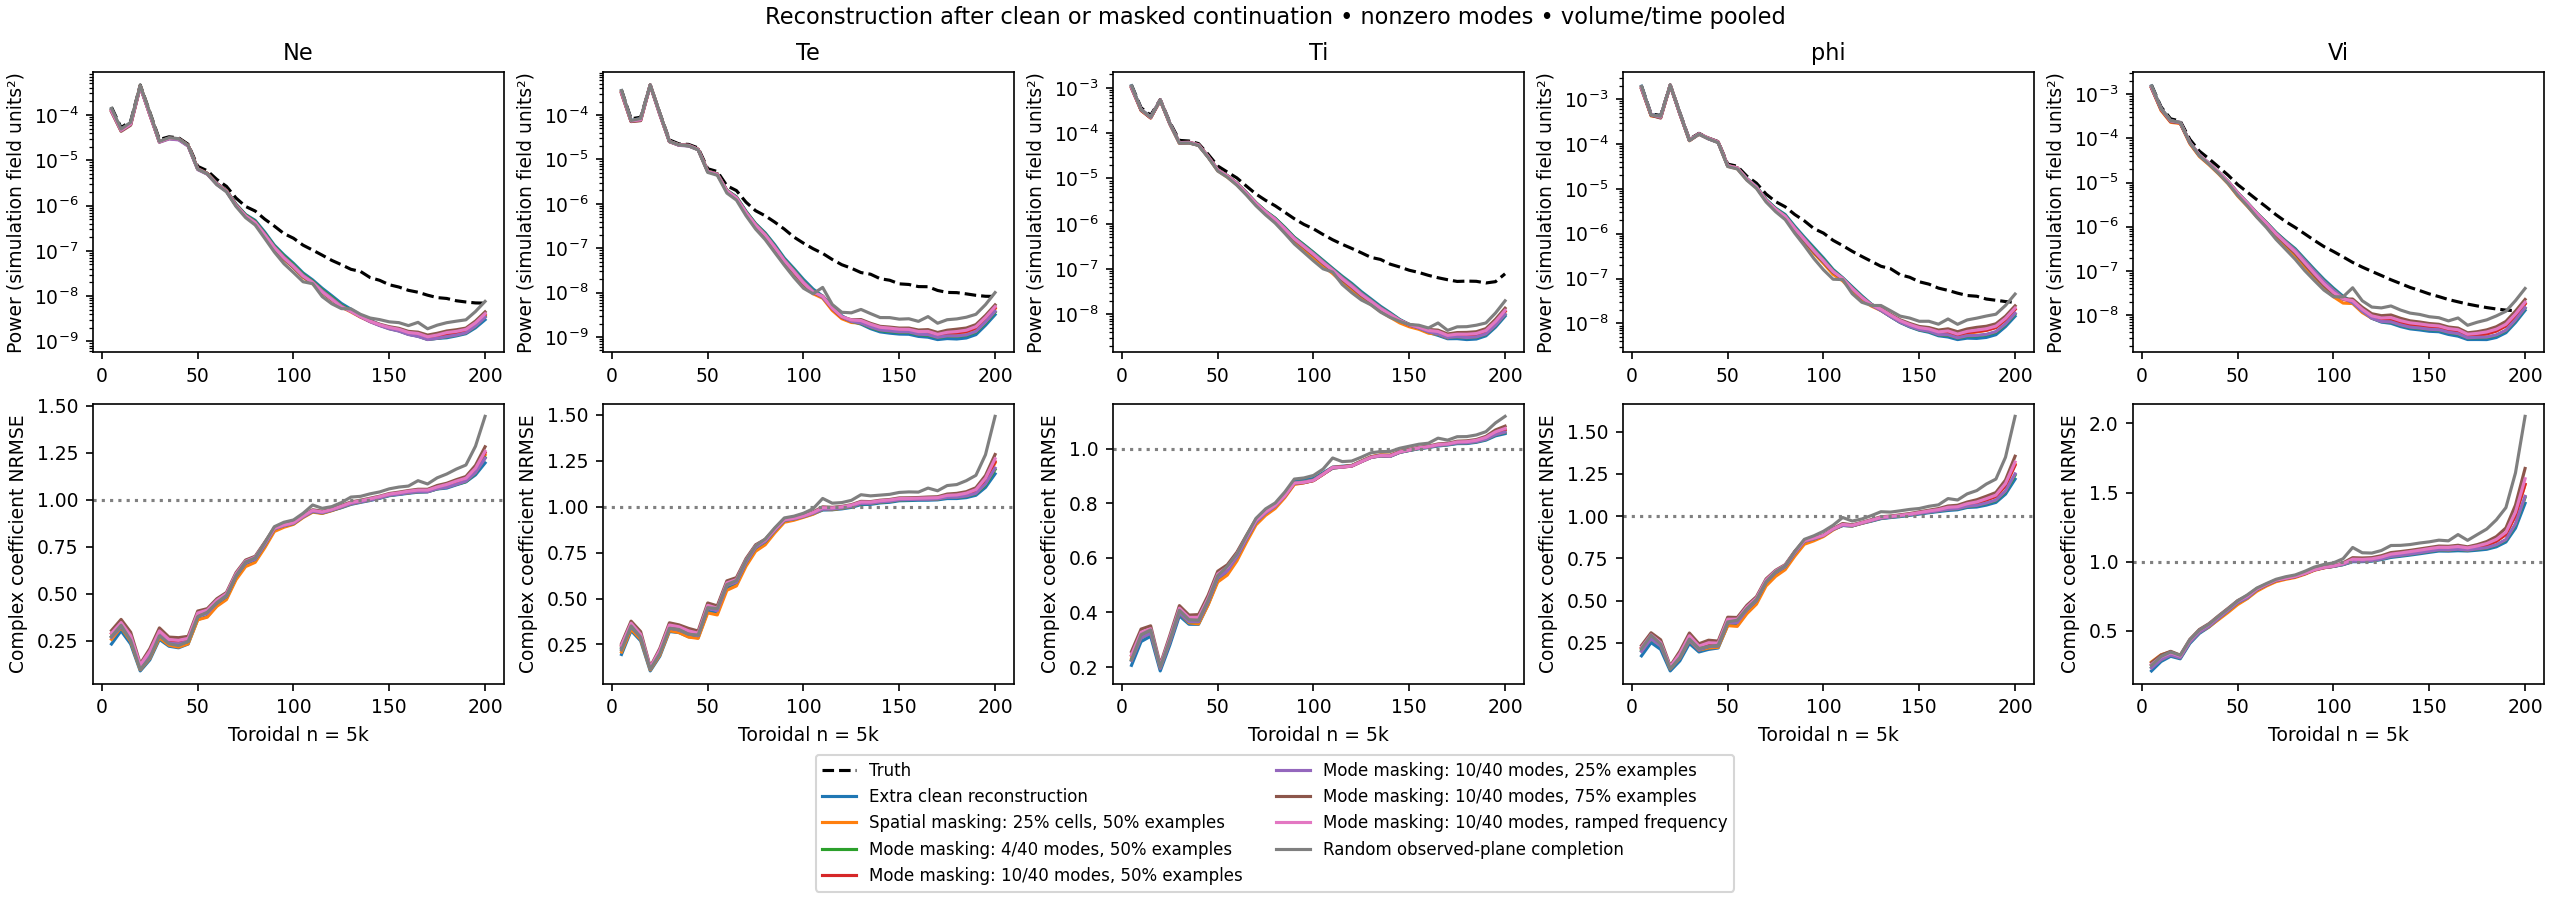
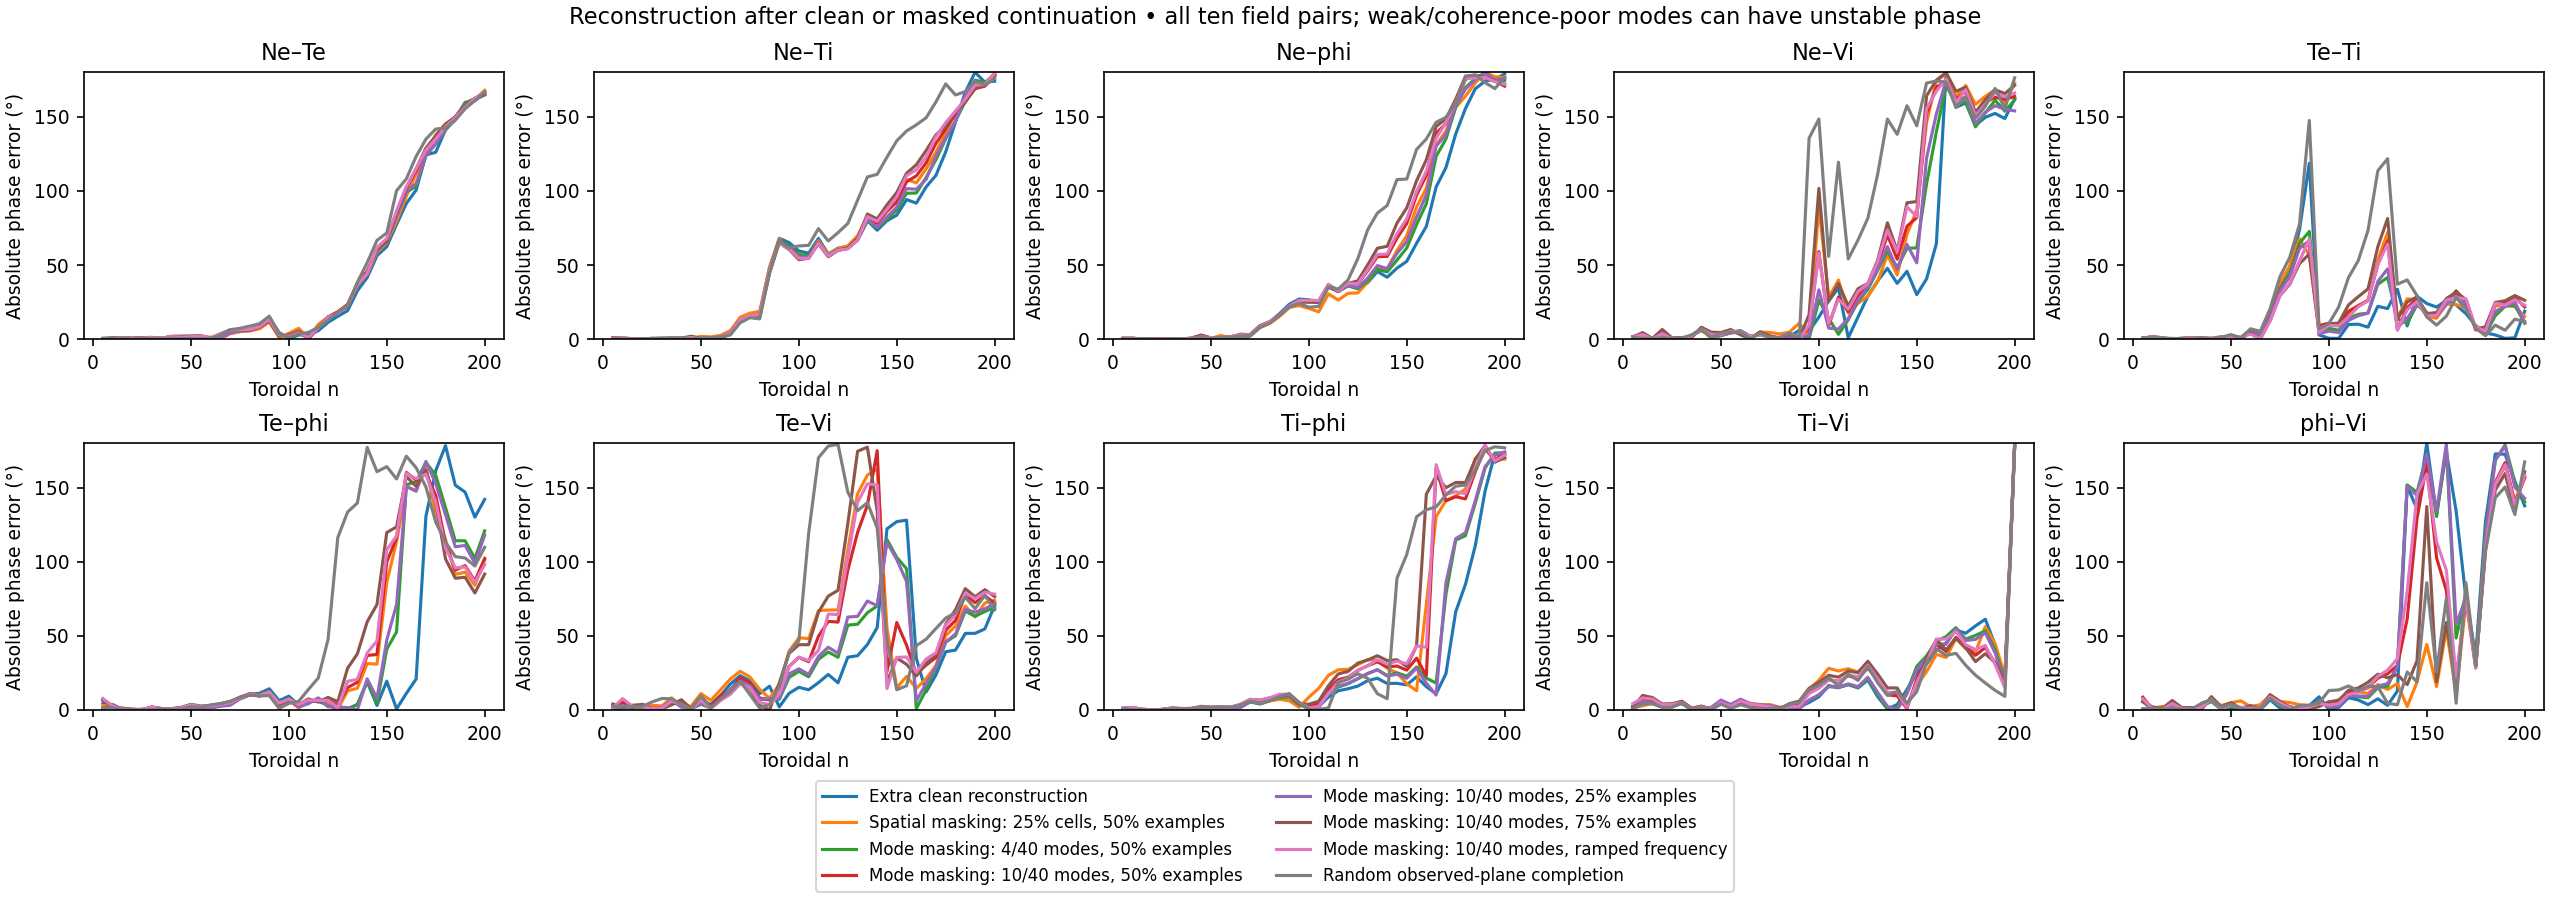
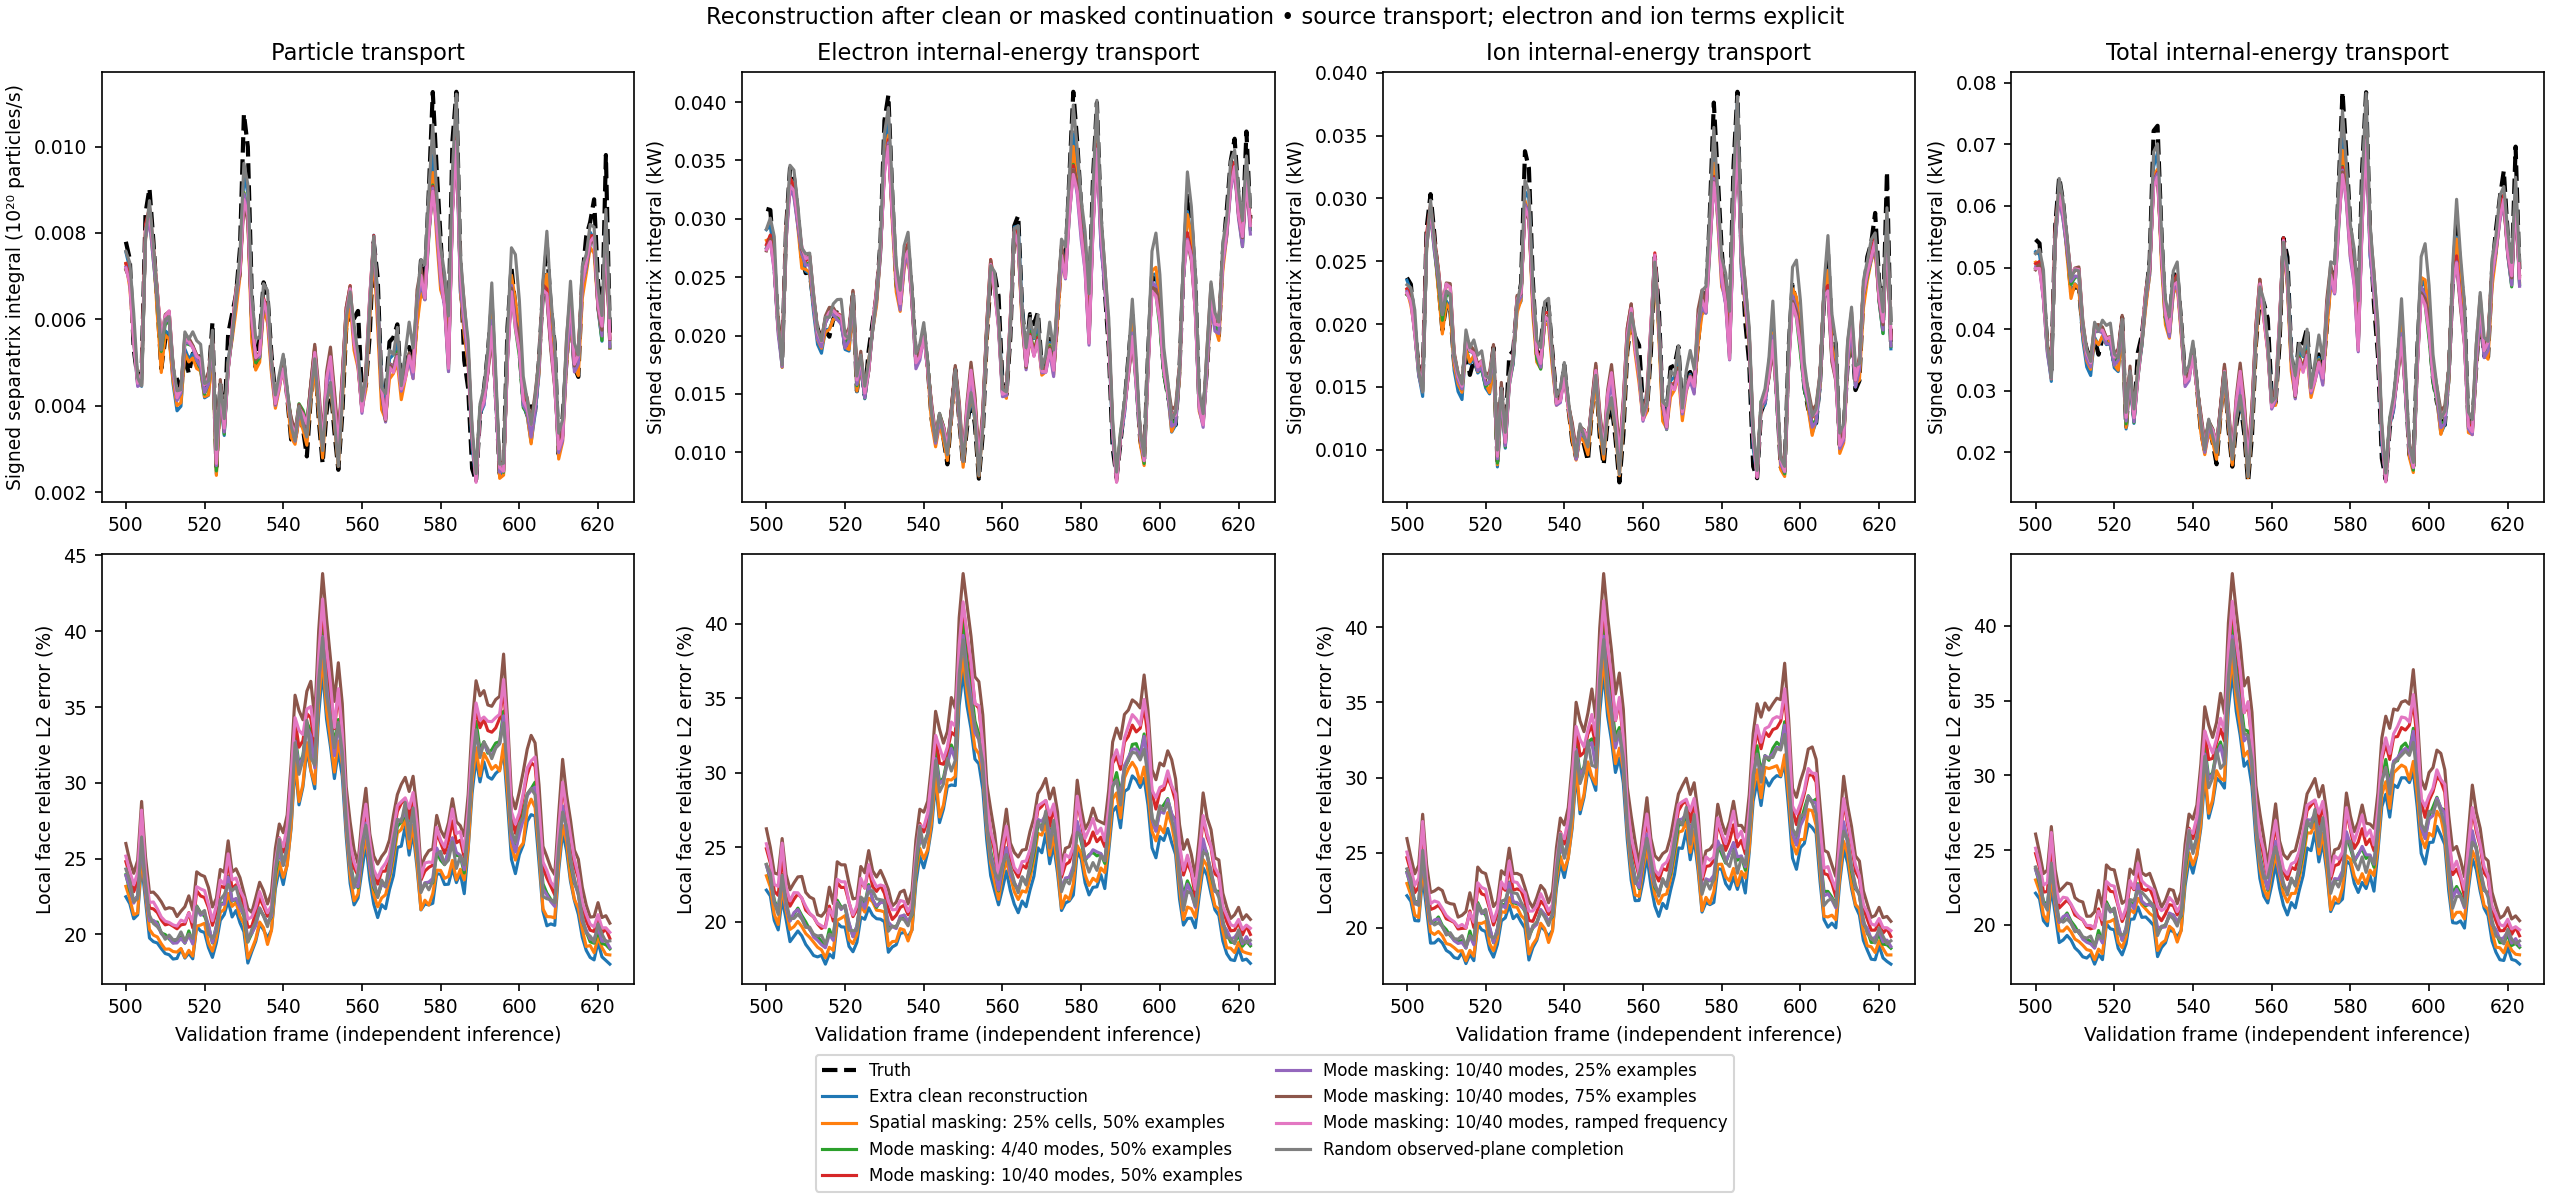
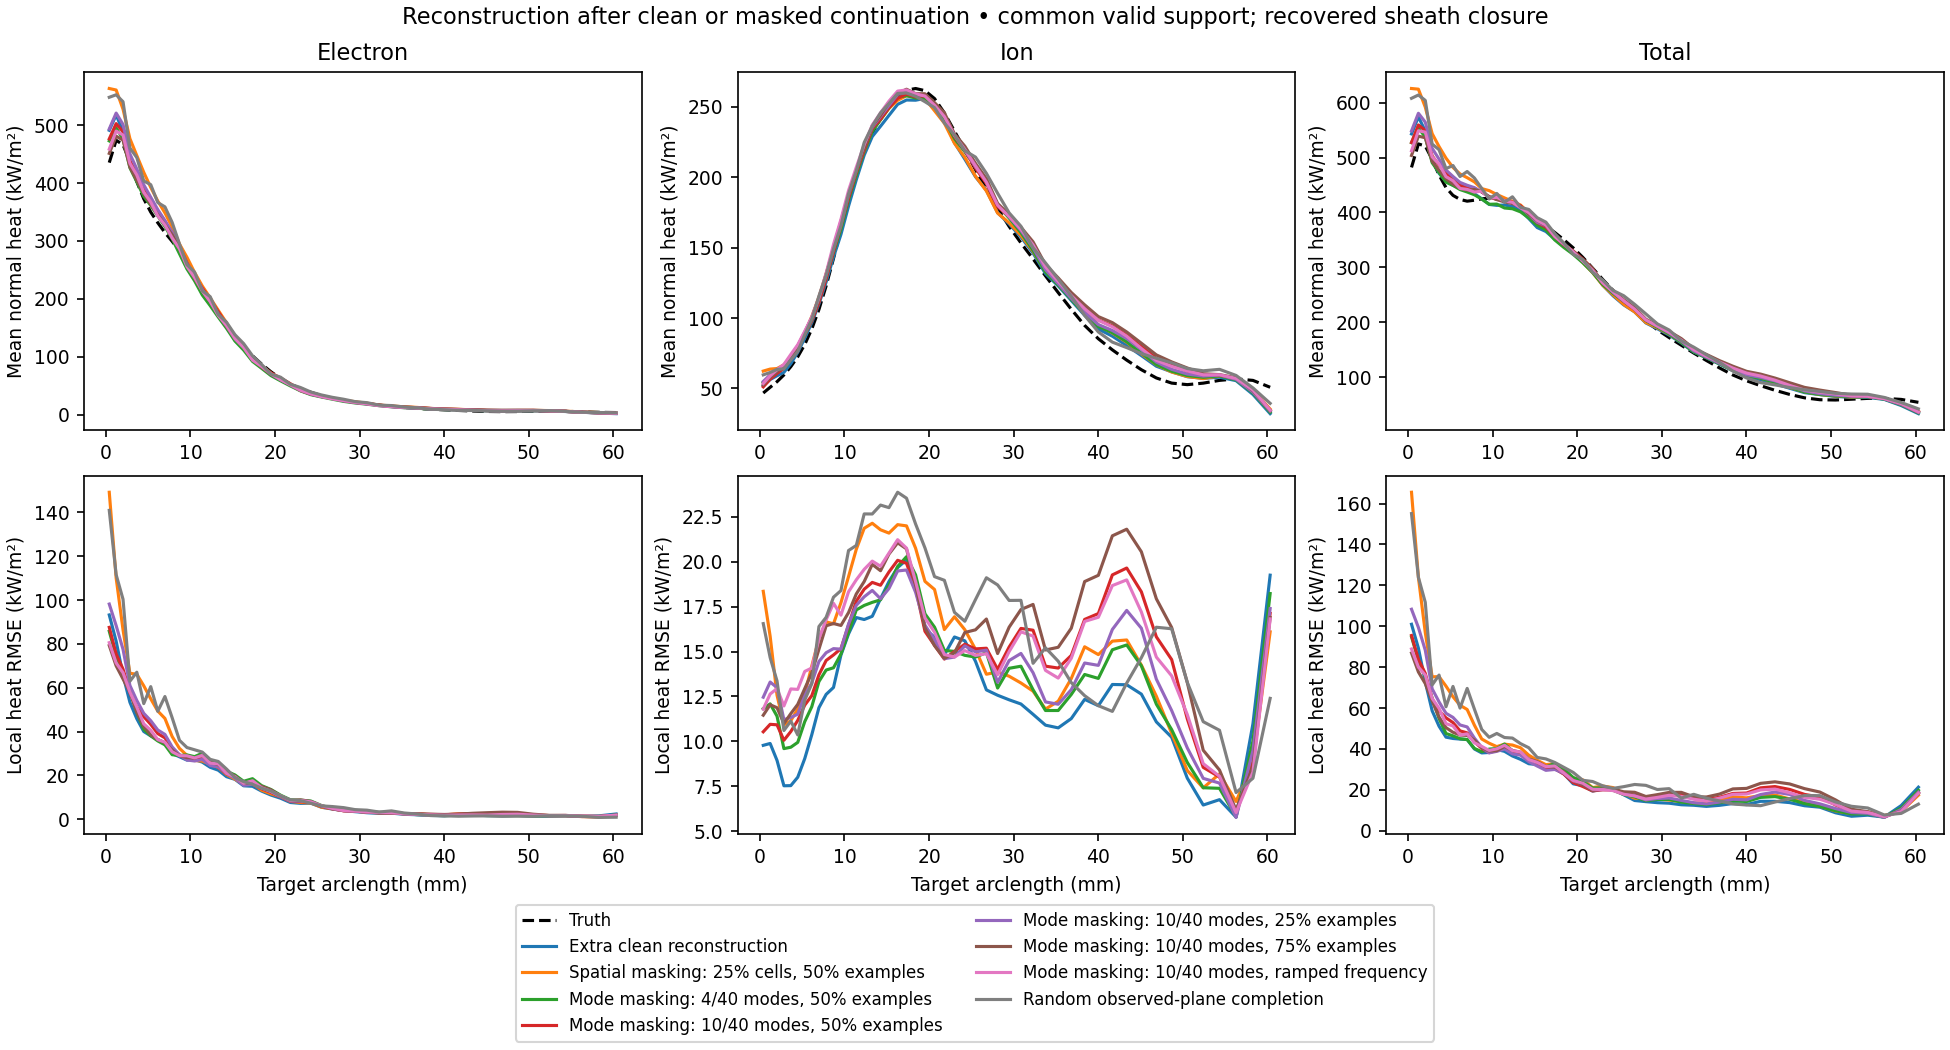
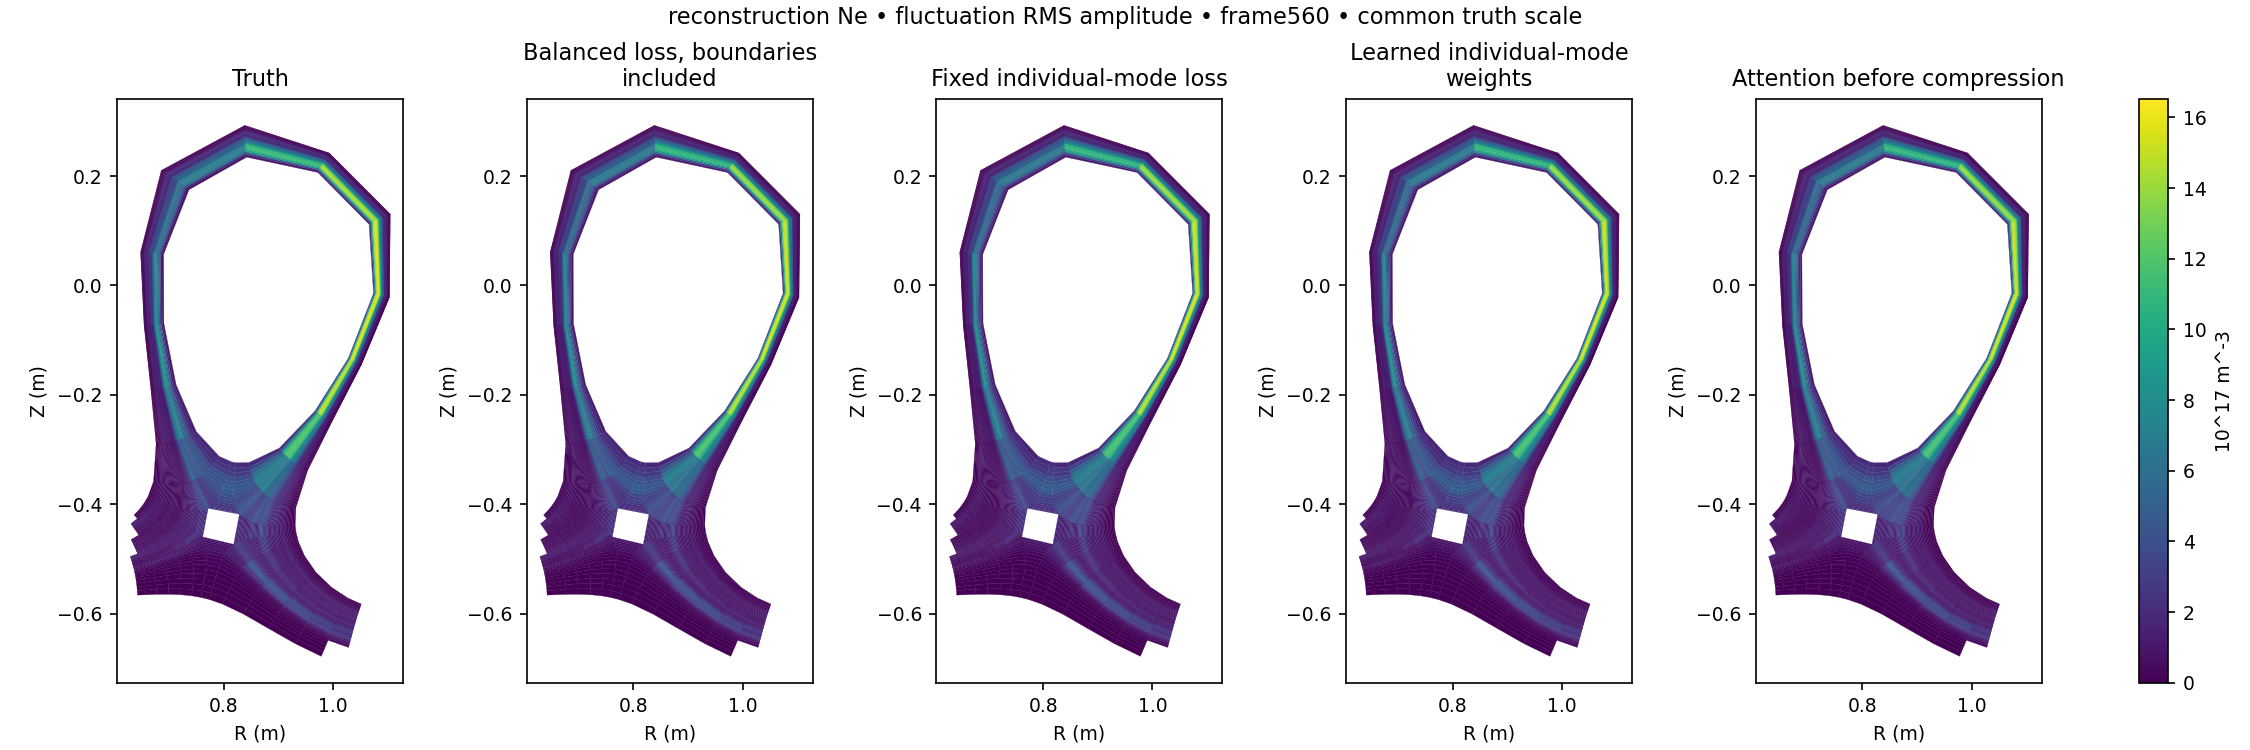
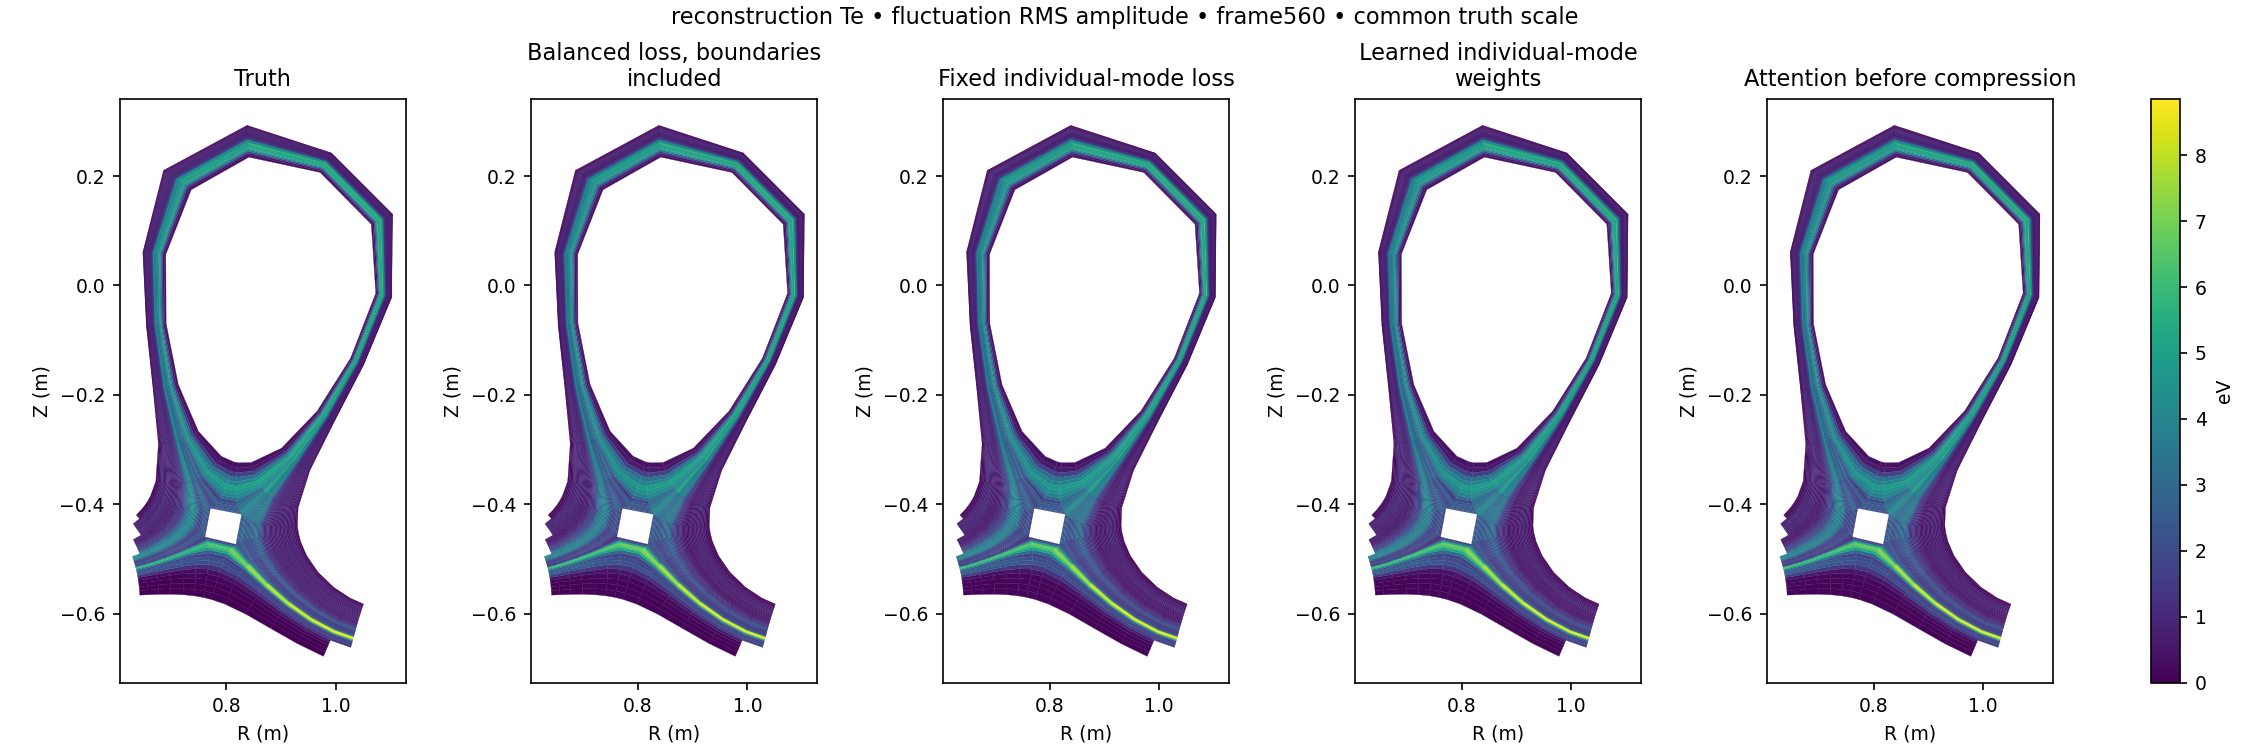
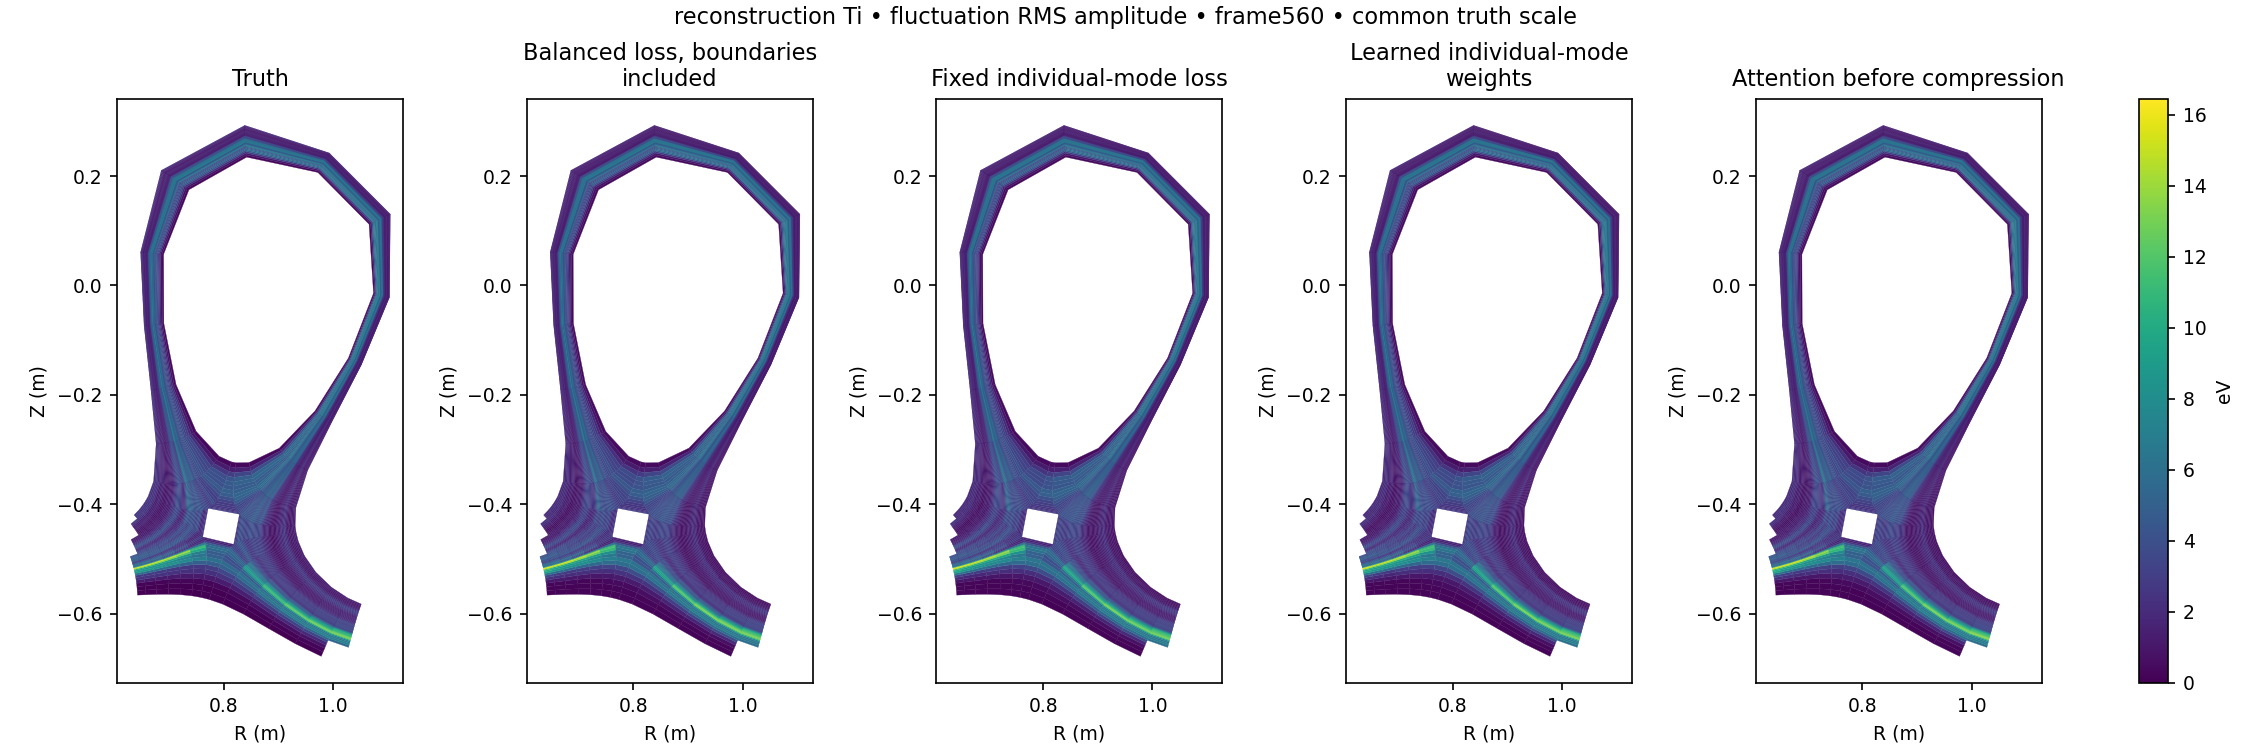
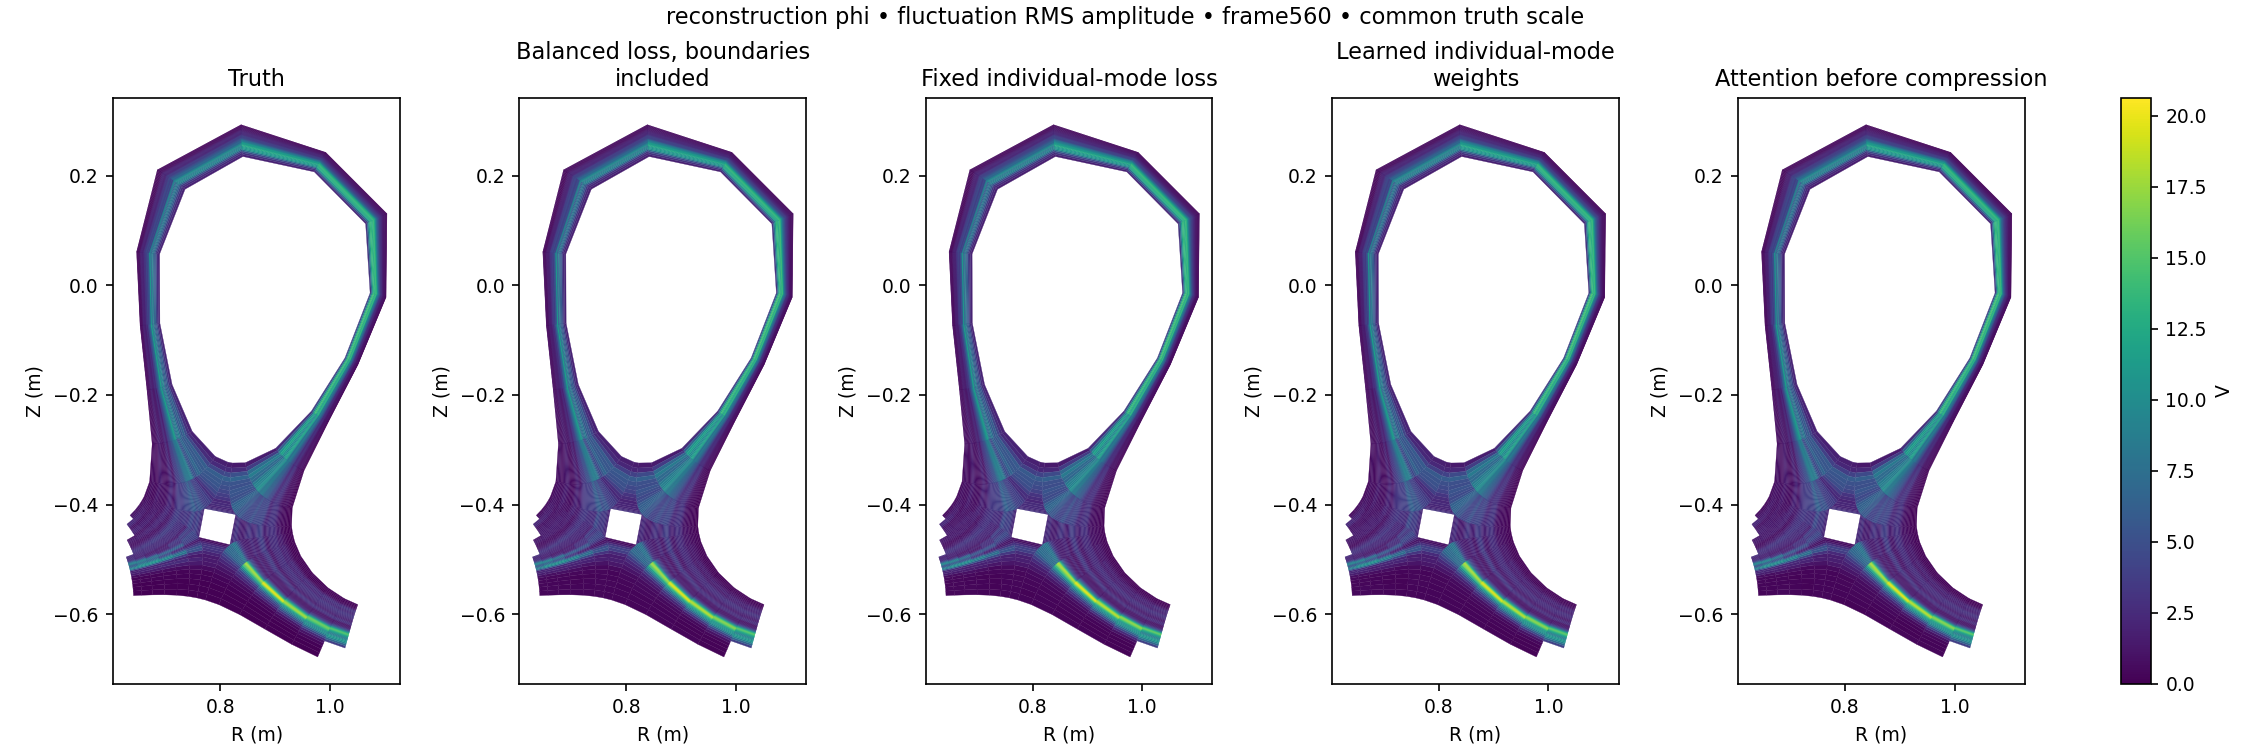
Reconstruct five plasma fields. Transfer to a new equilibrium. Generate their evolution.
Truth → models → error, through time
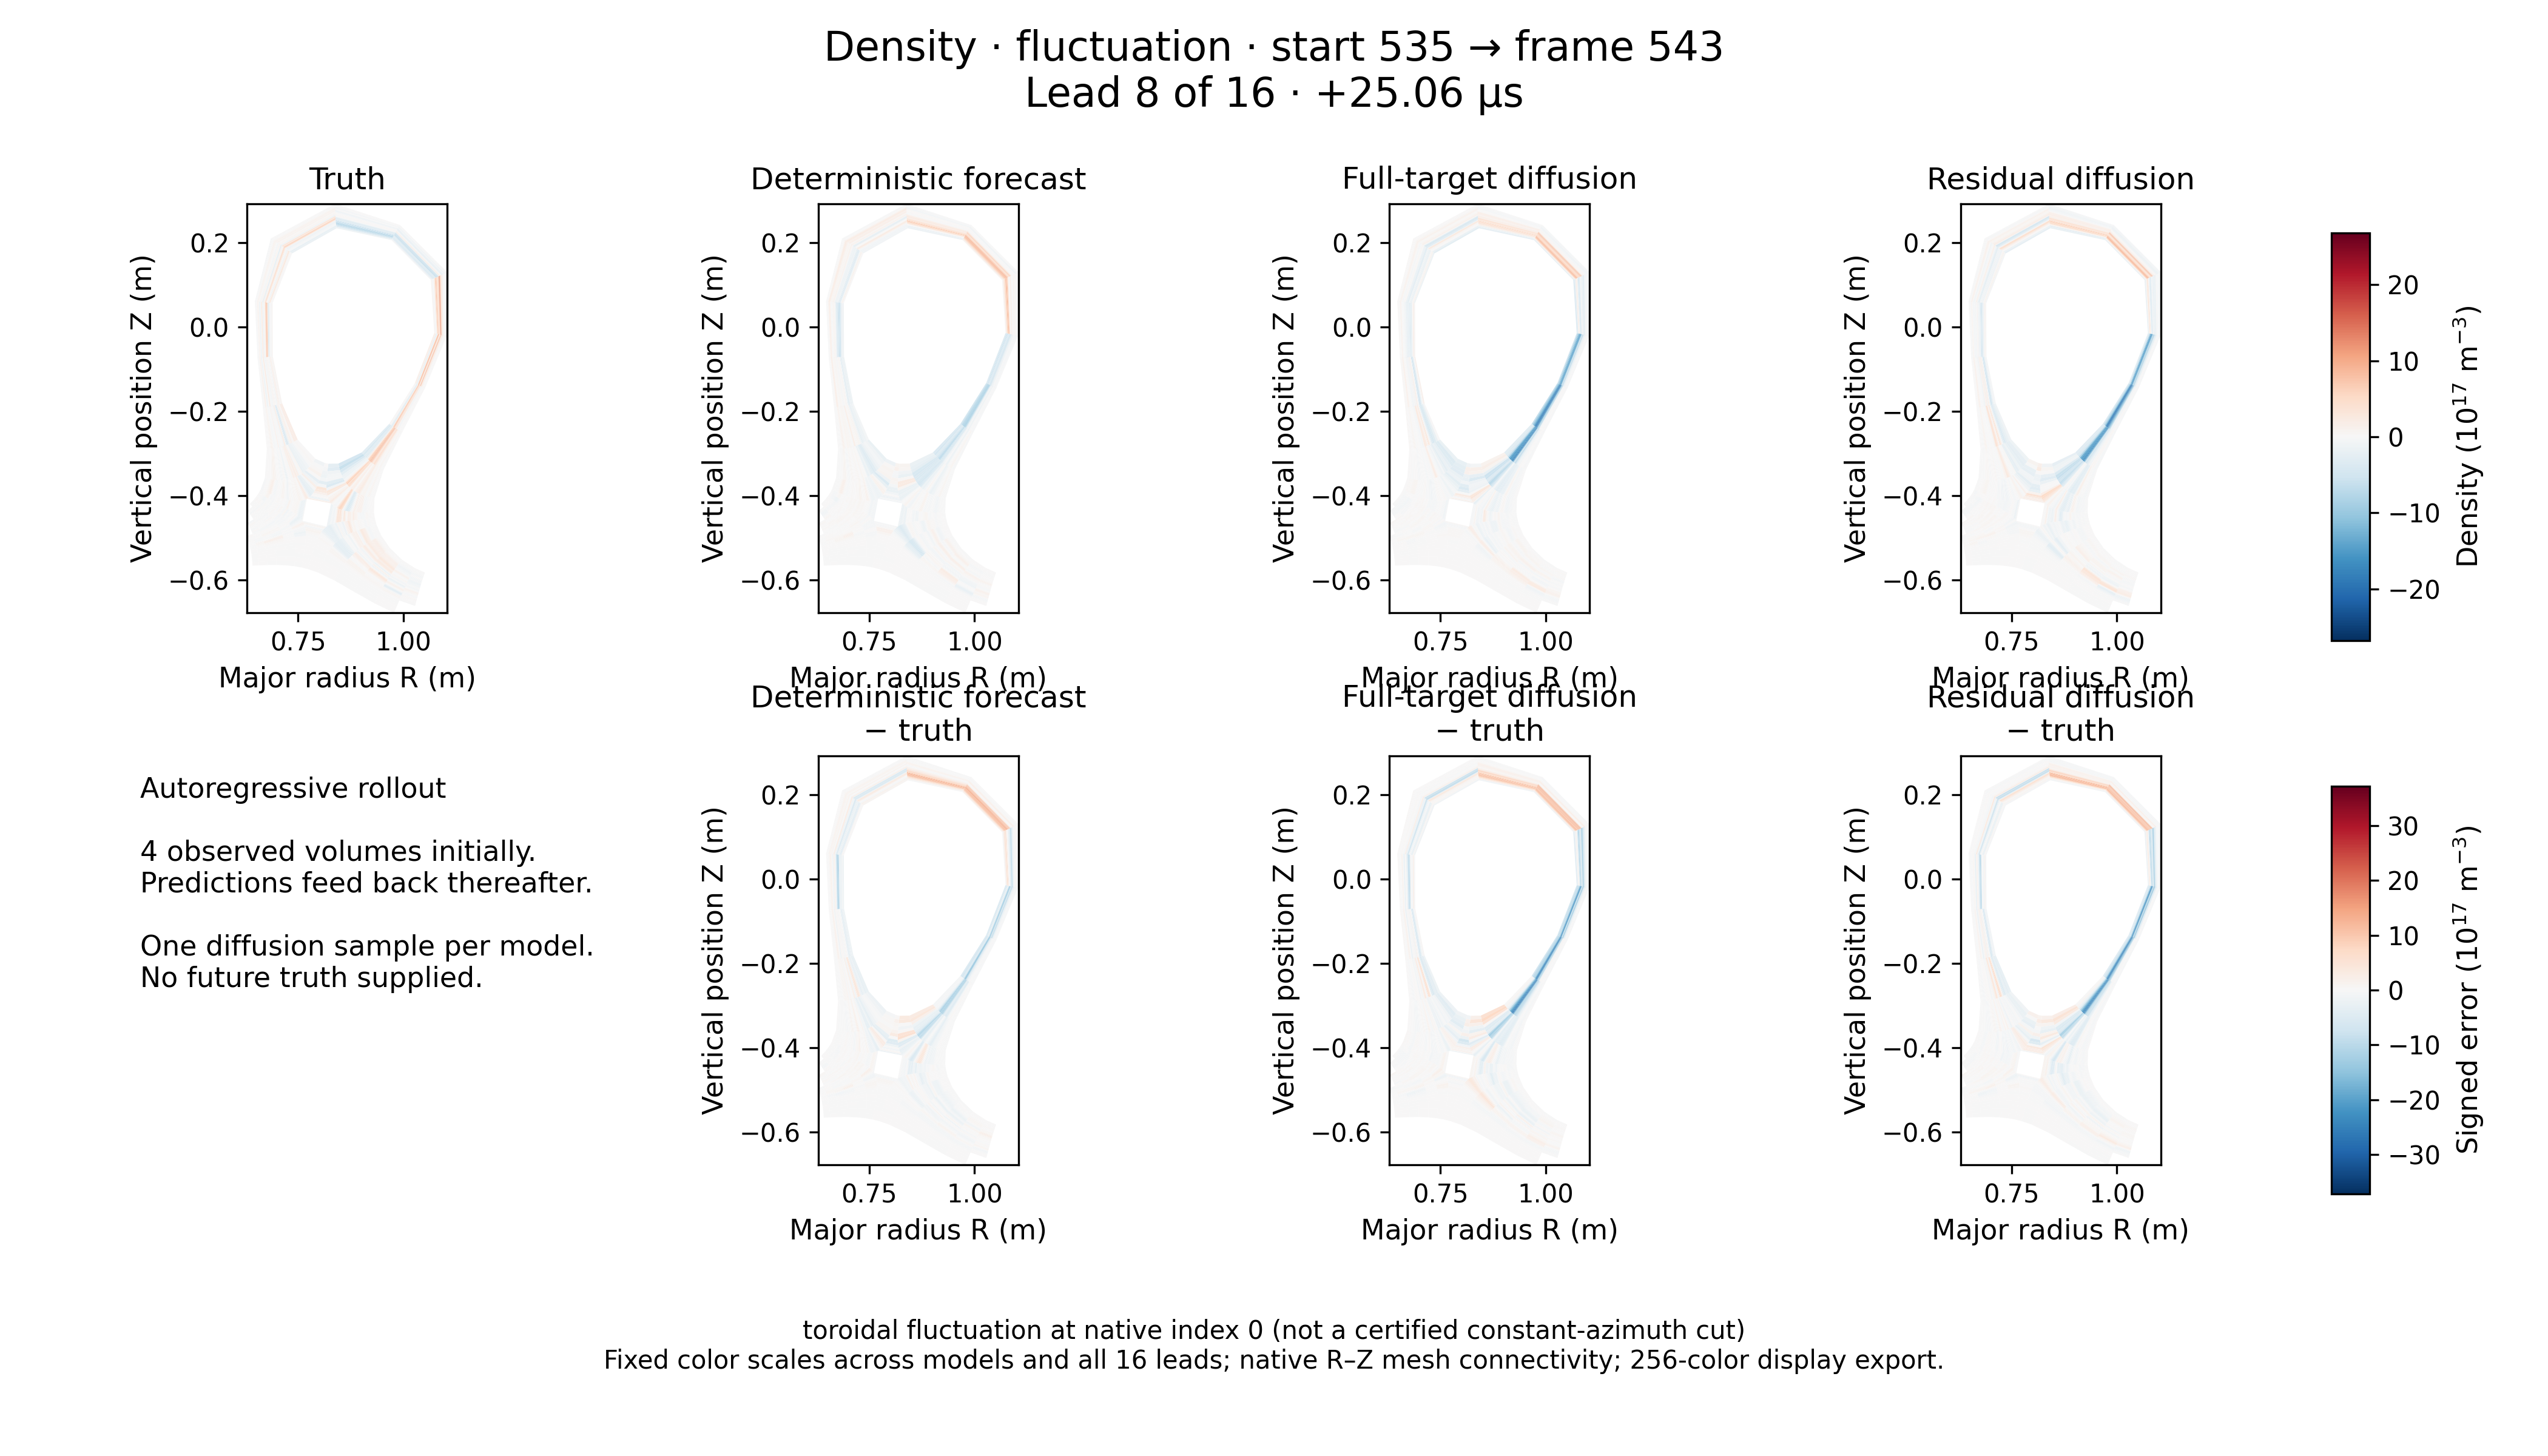
Free forecasts from four observed volumes. Fixed physical color scales; predicted states feed back.
R–Z native geometry. Fluctuations use native toroidal index 0; this is not a certified constant-azimuth cut. One sampled trajectory per diffusion model.
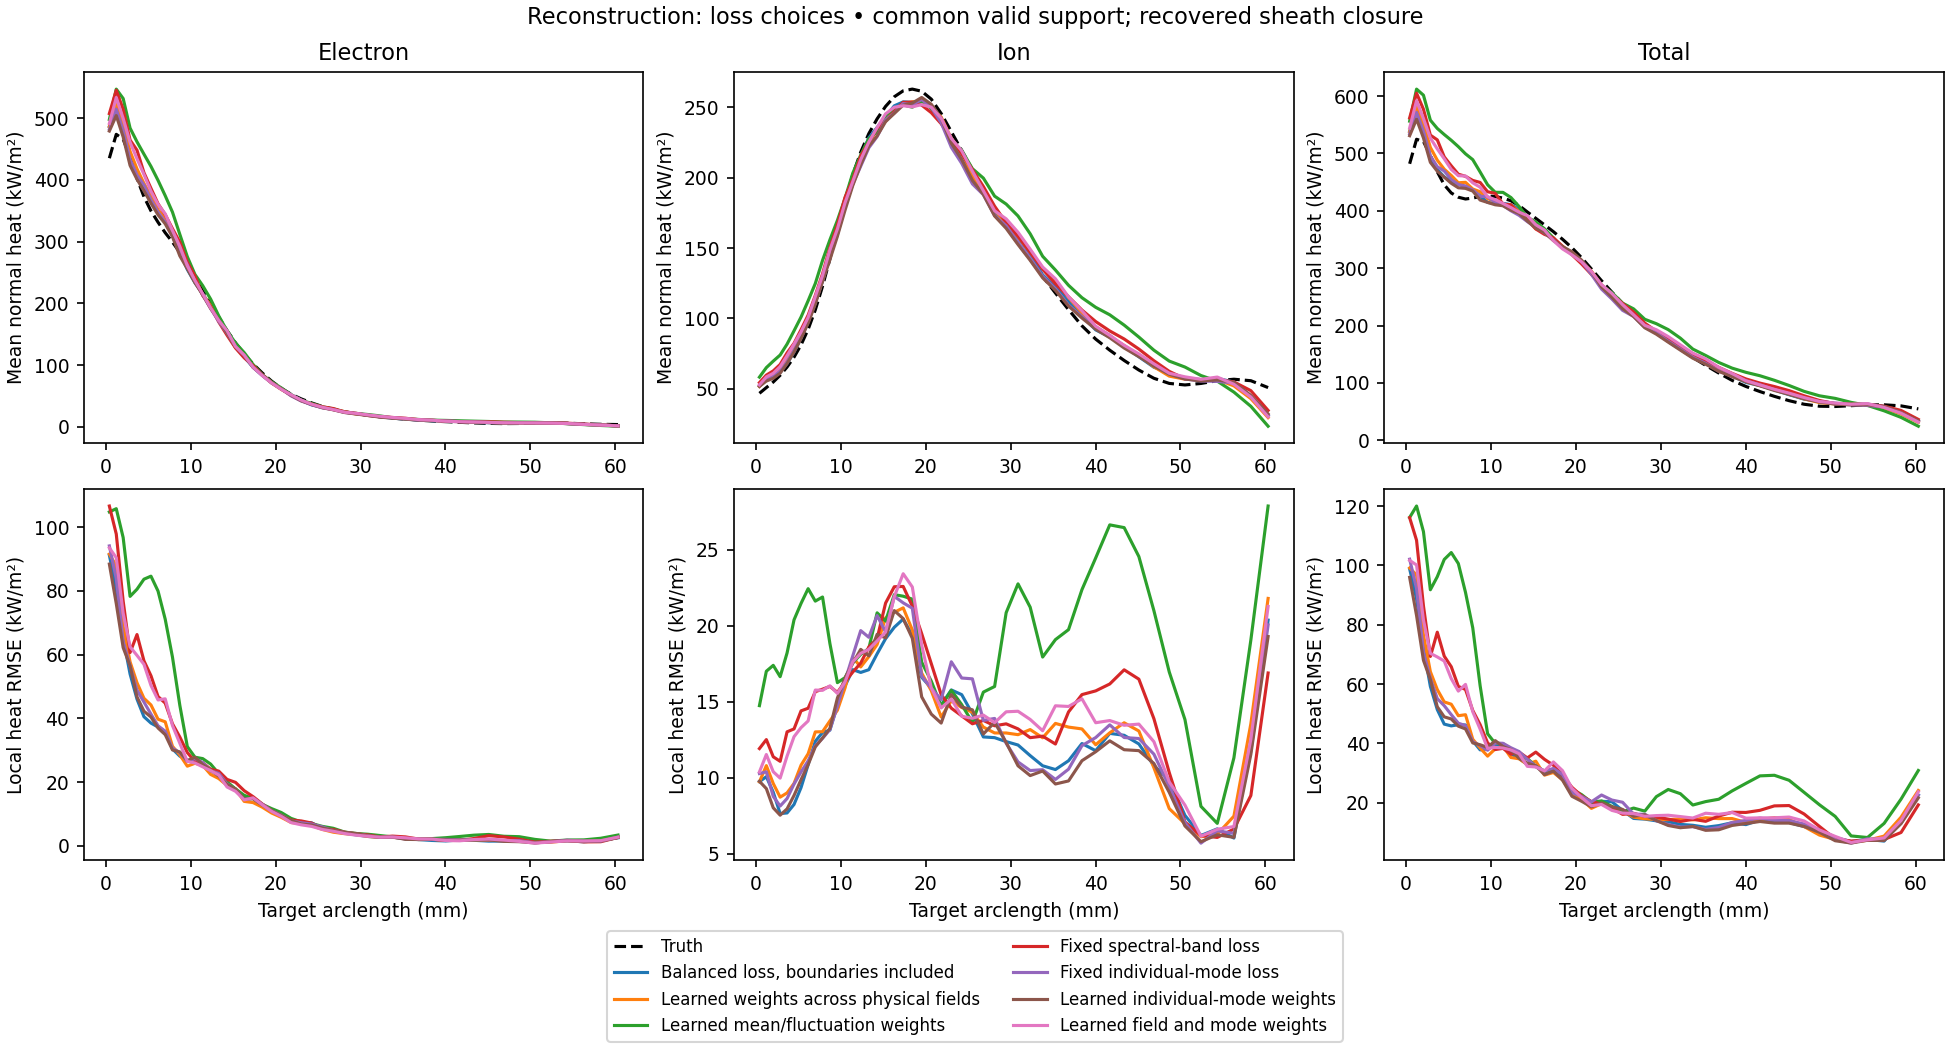
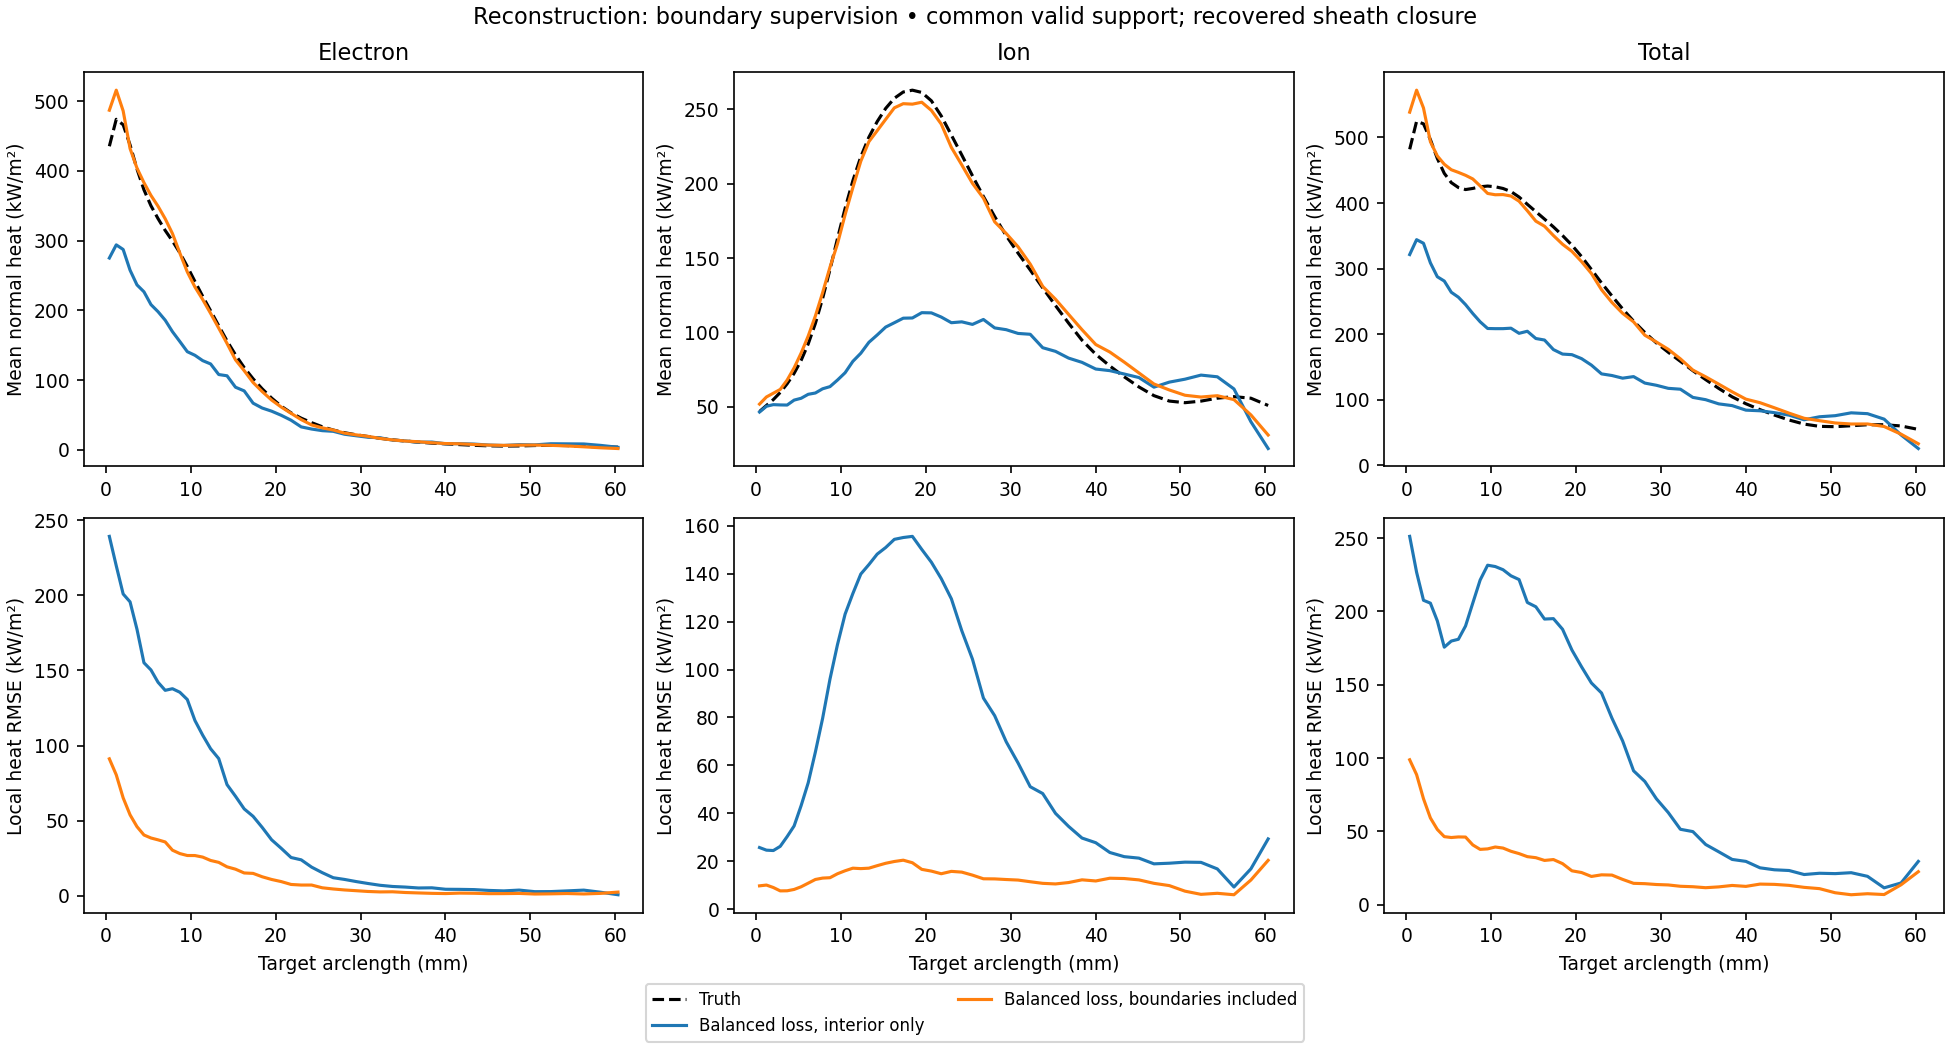
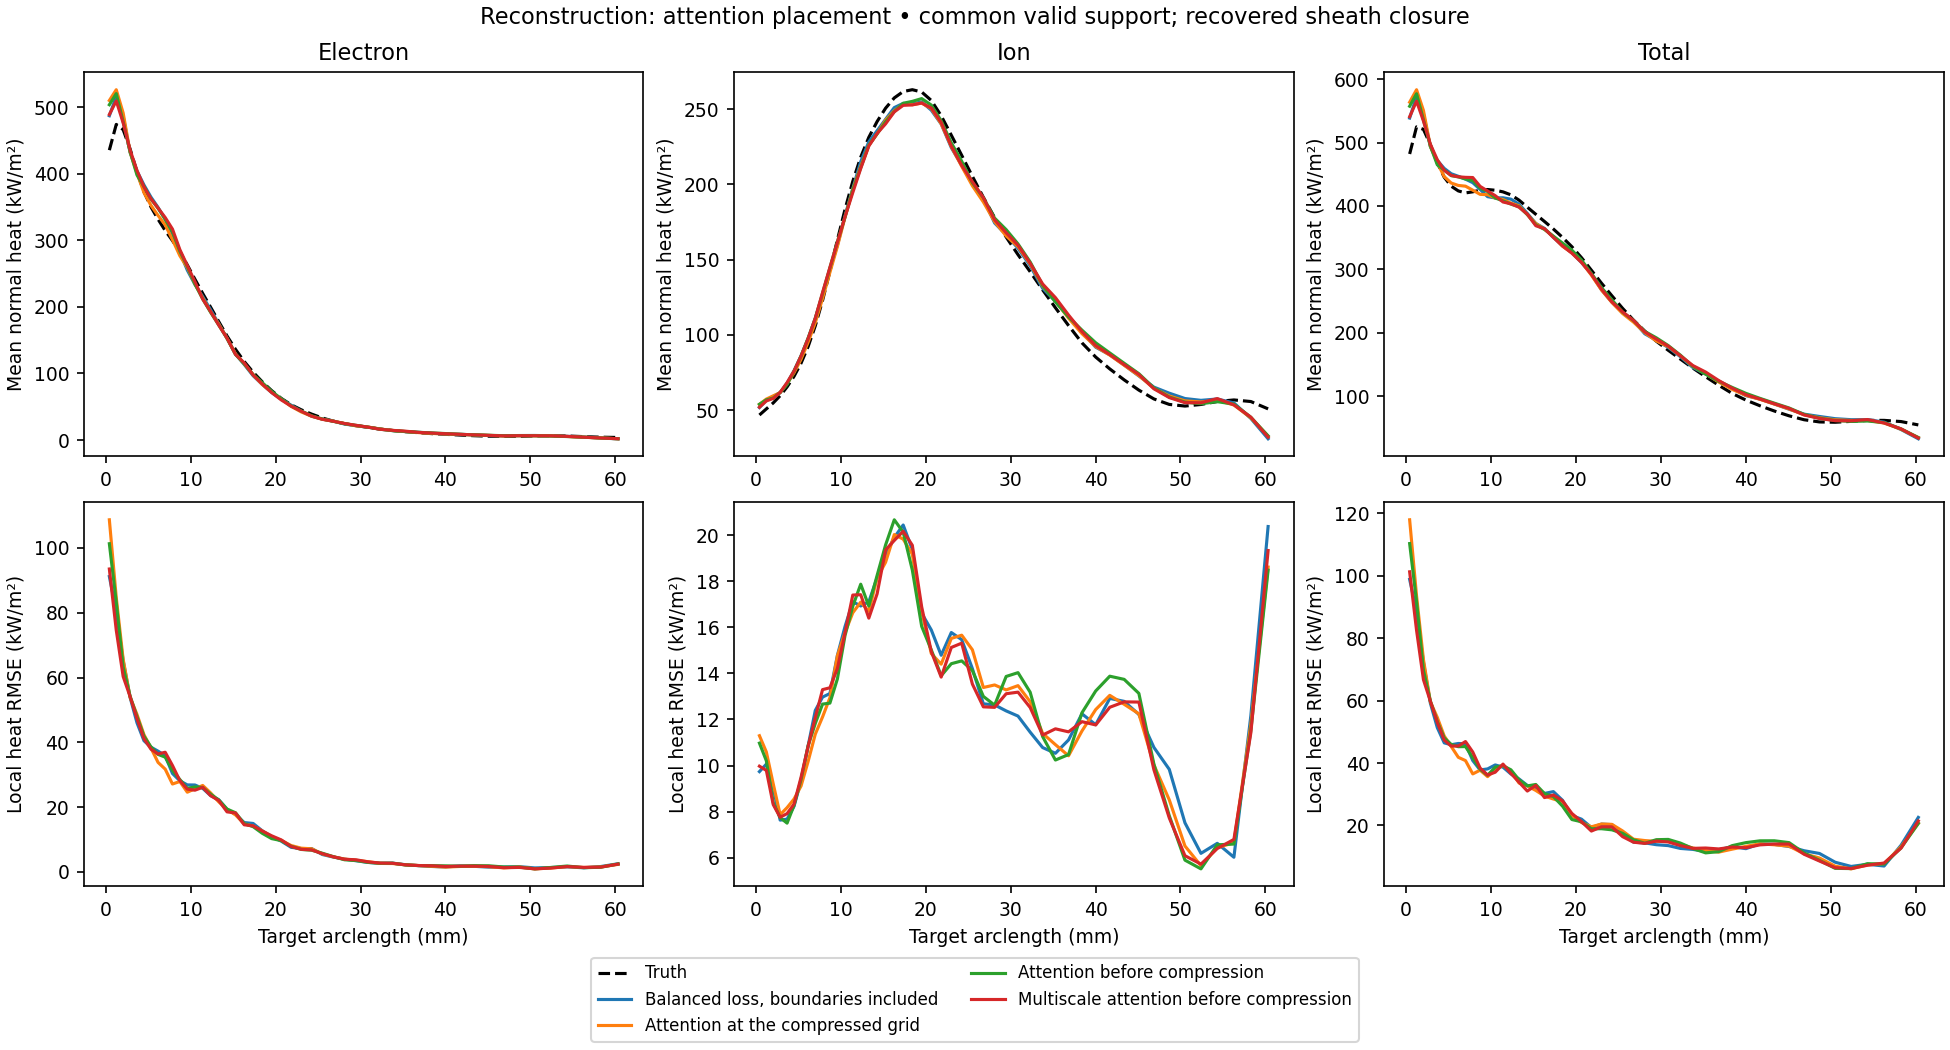
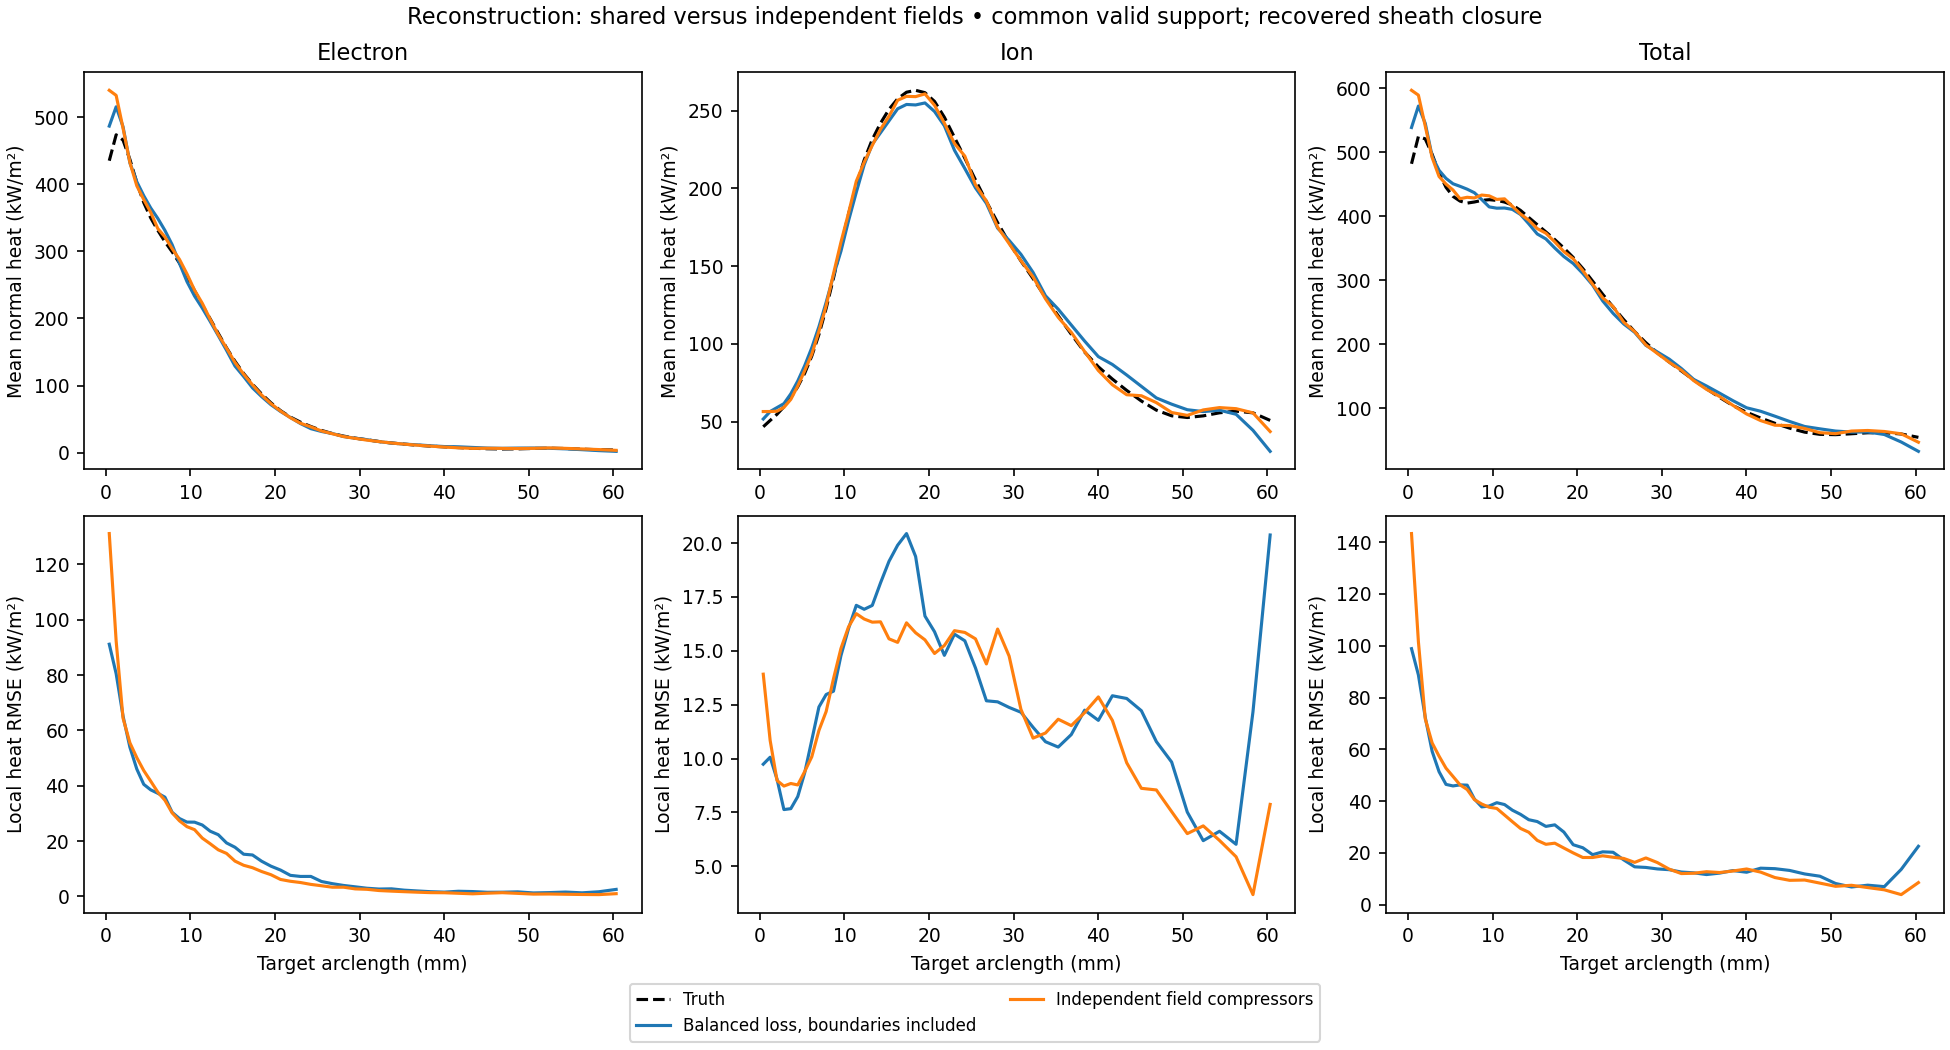
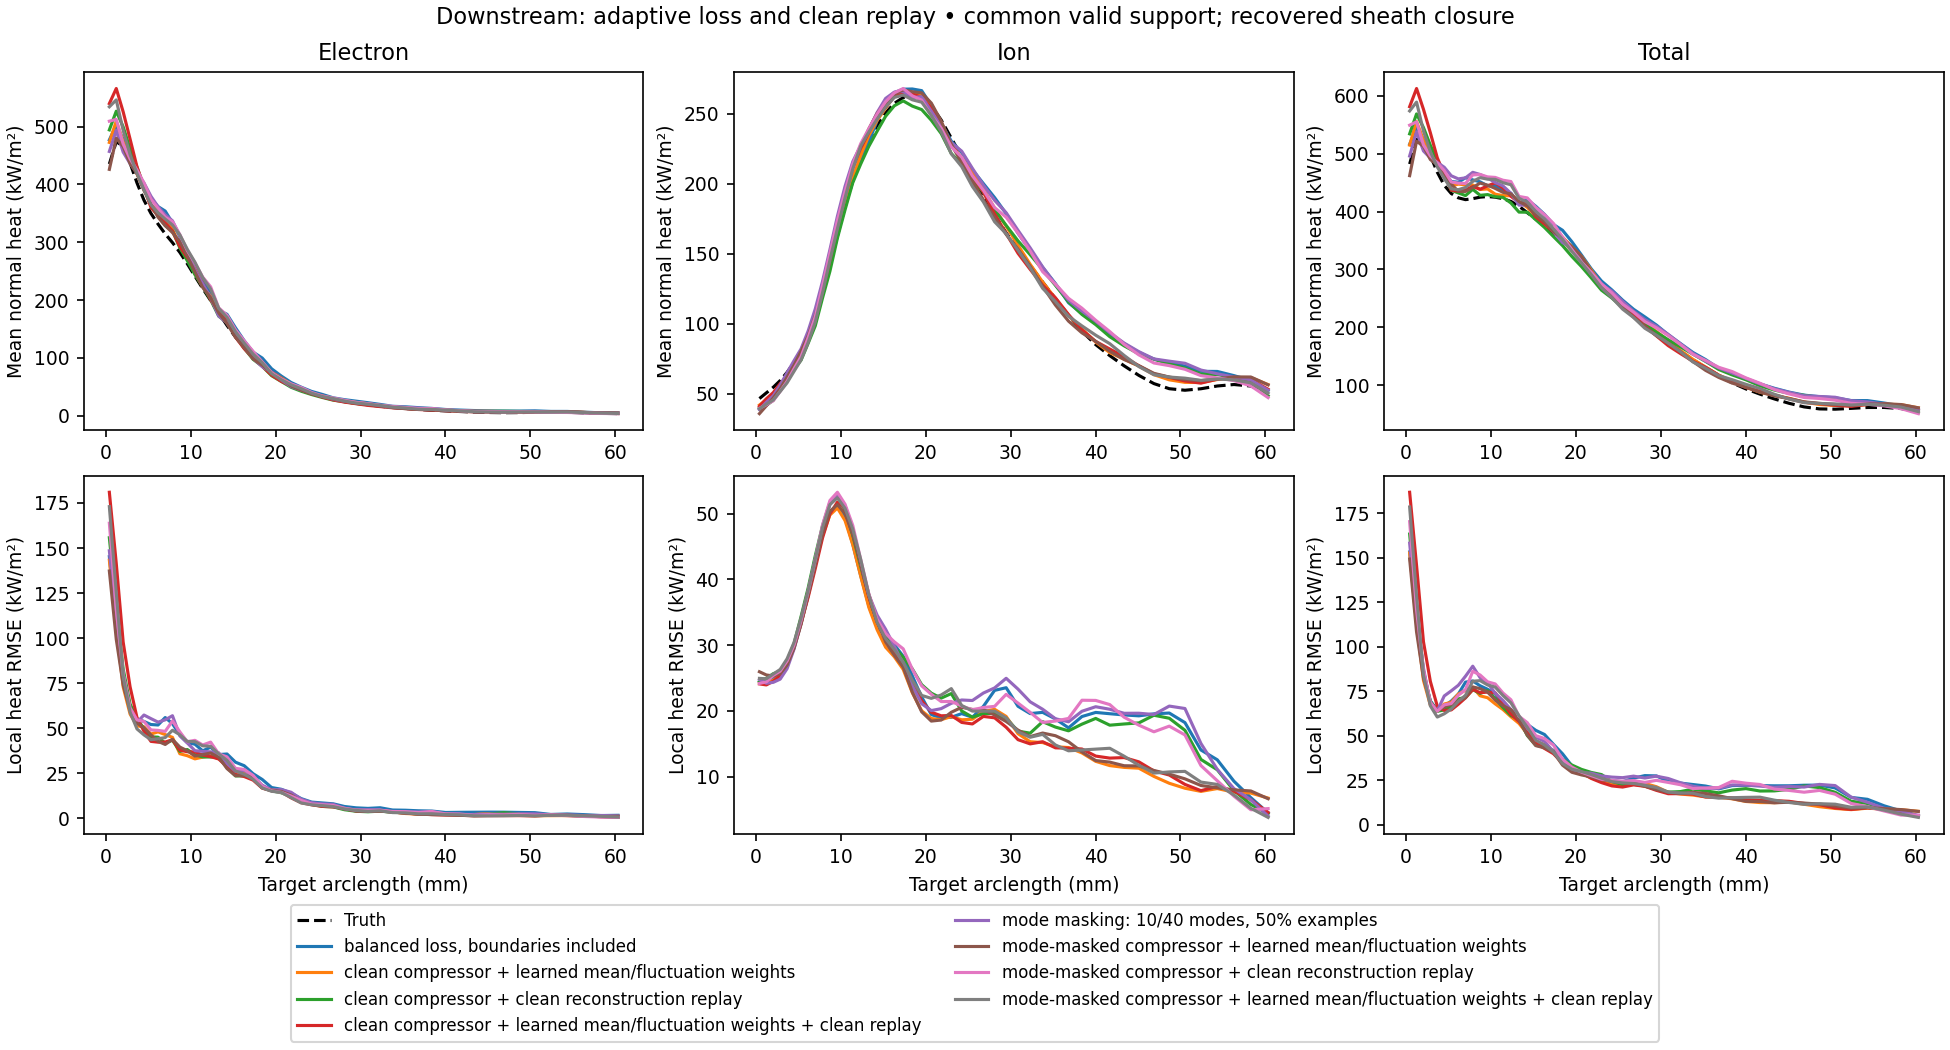
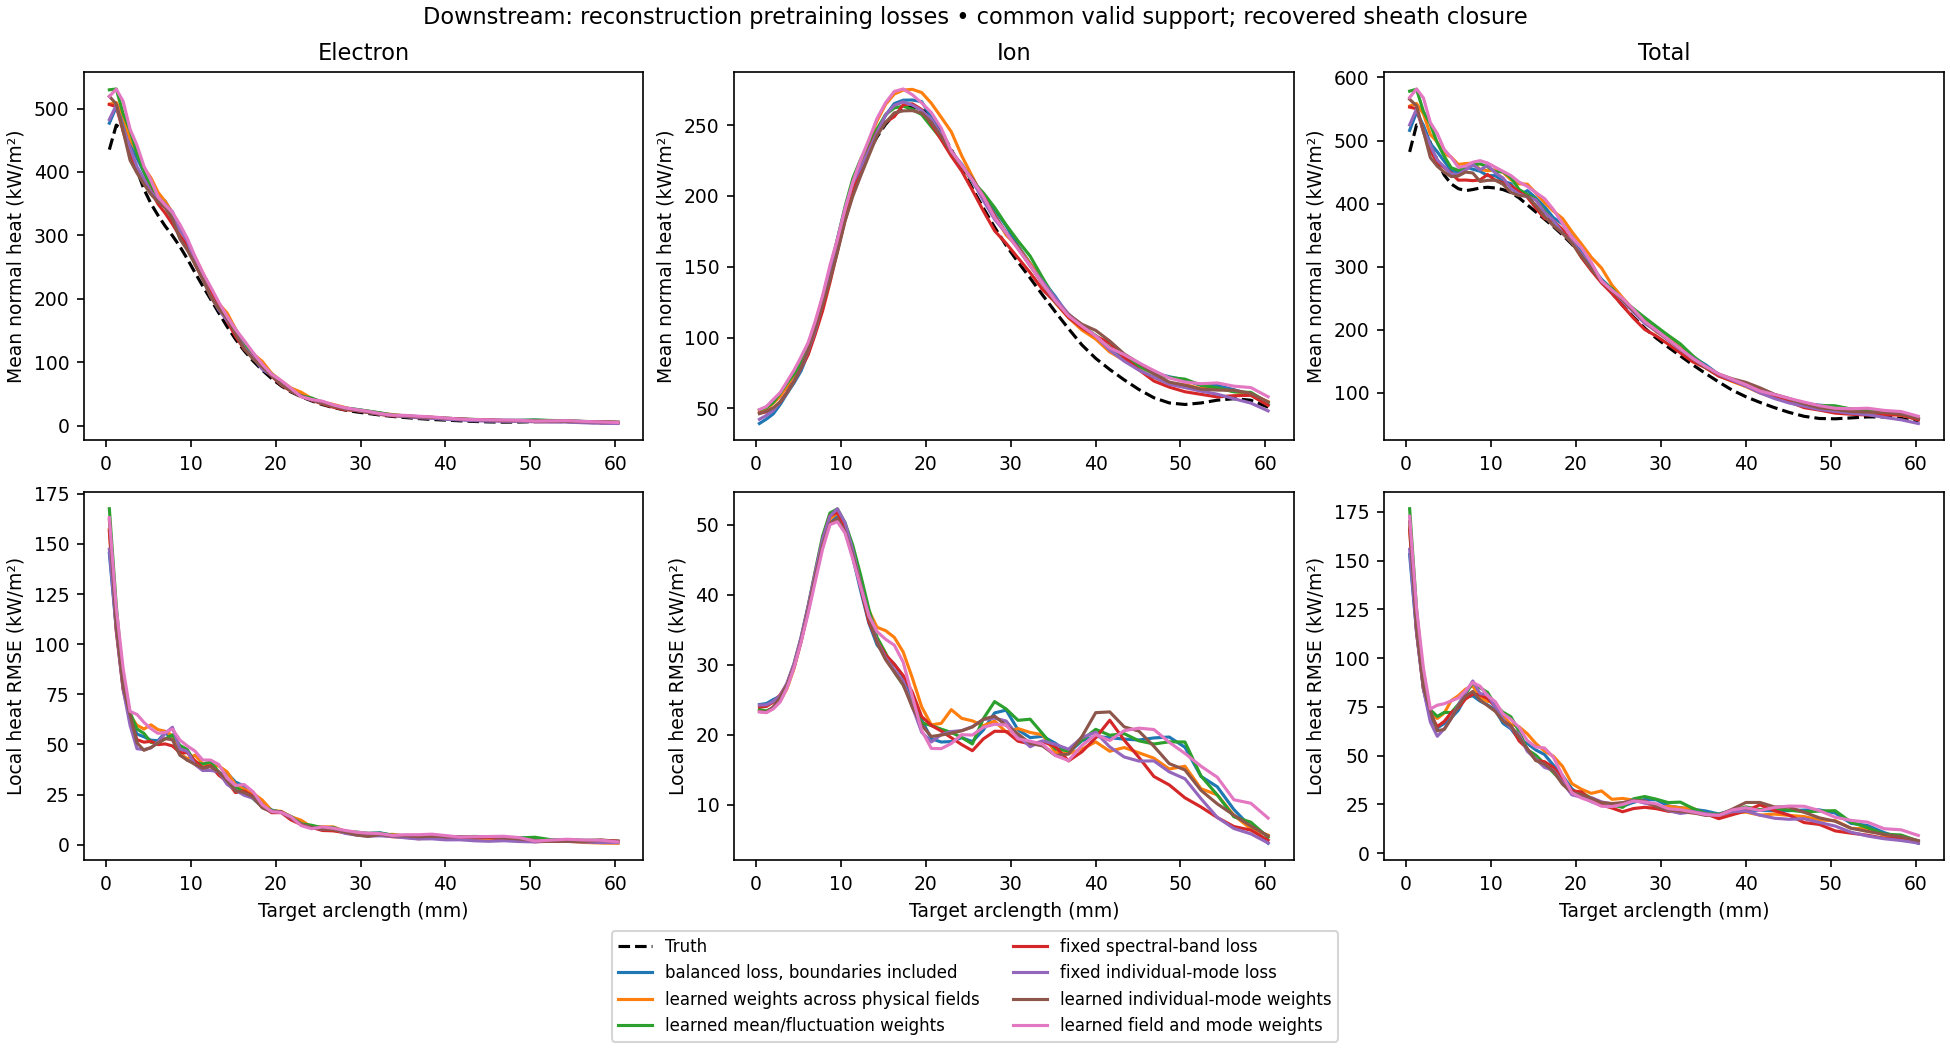
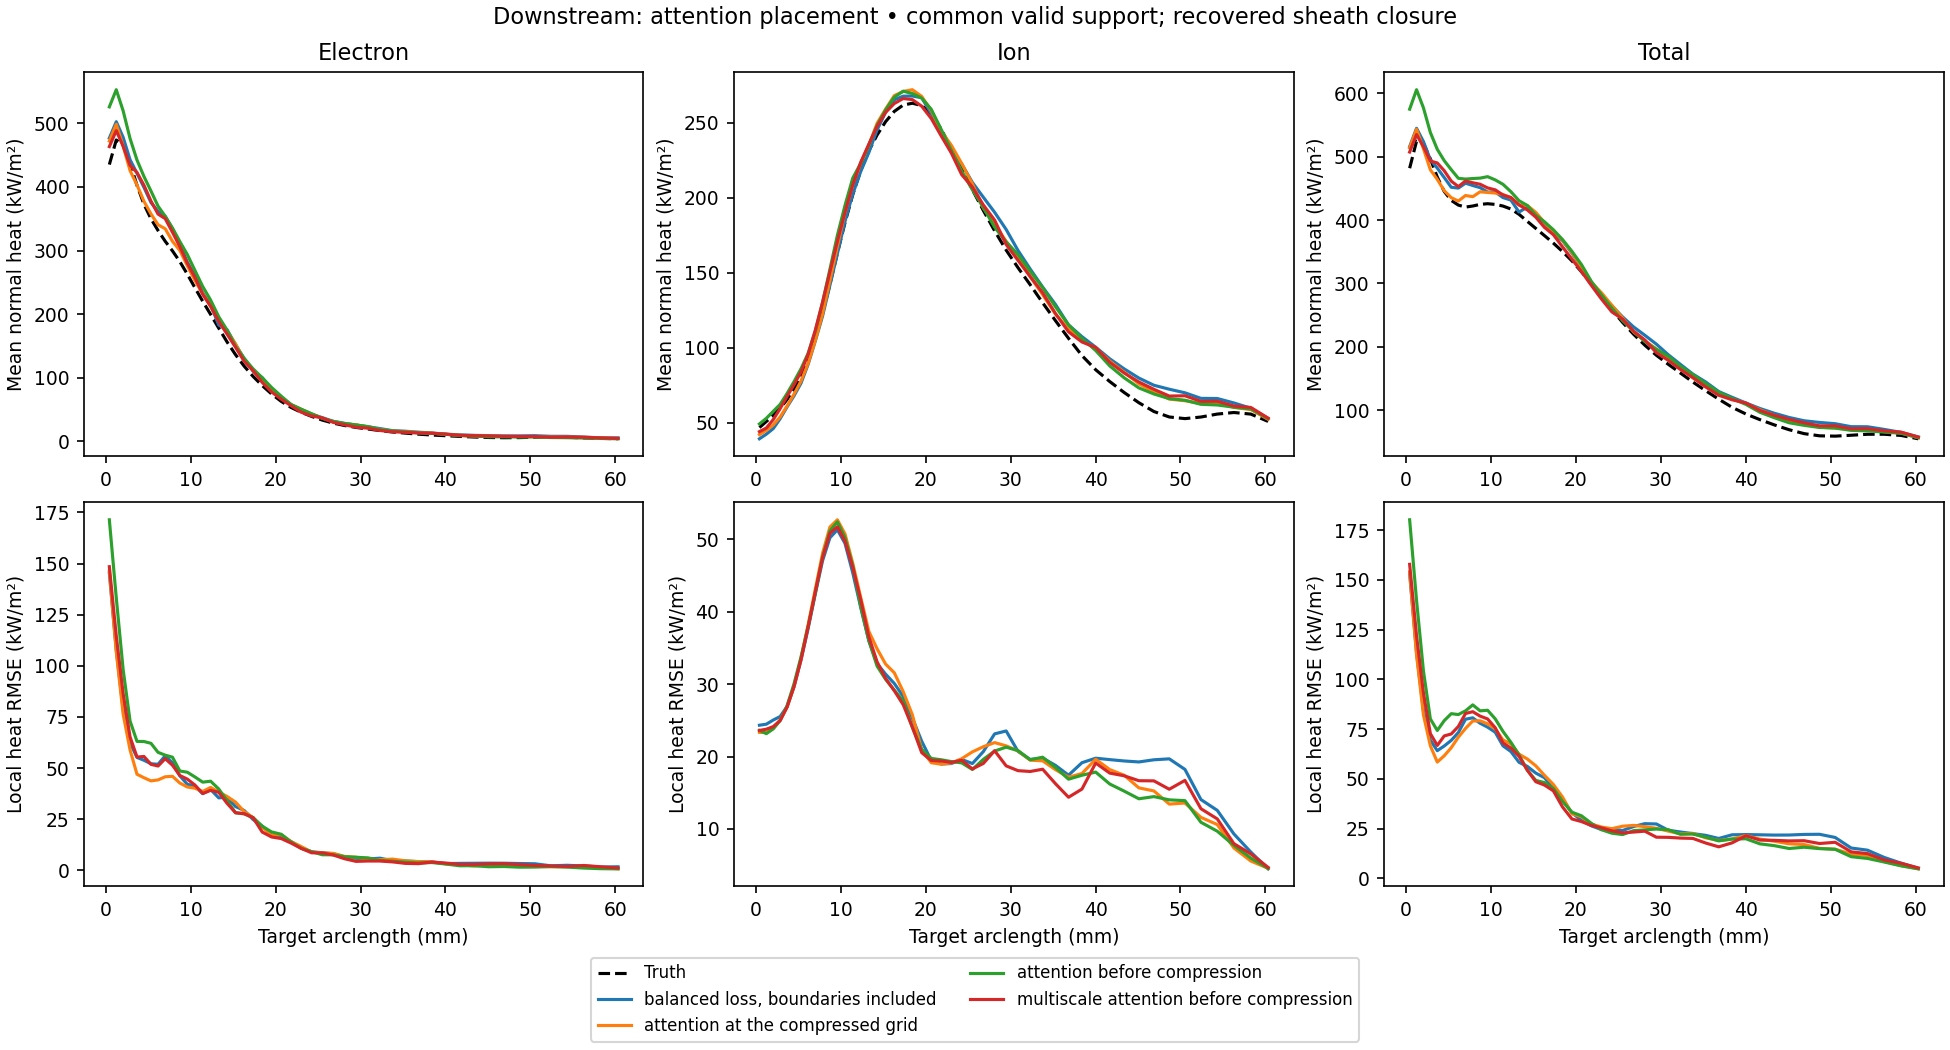
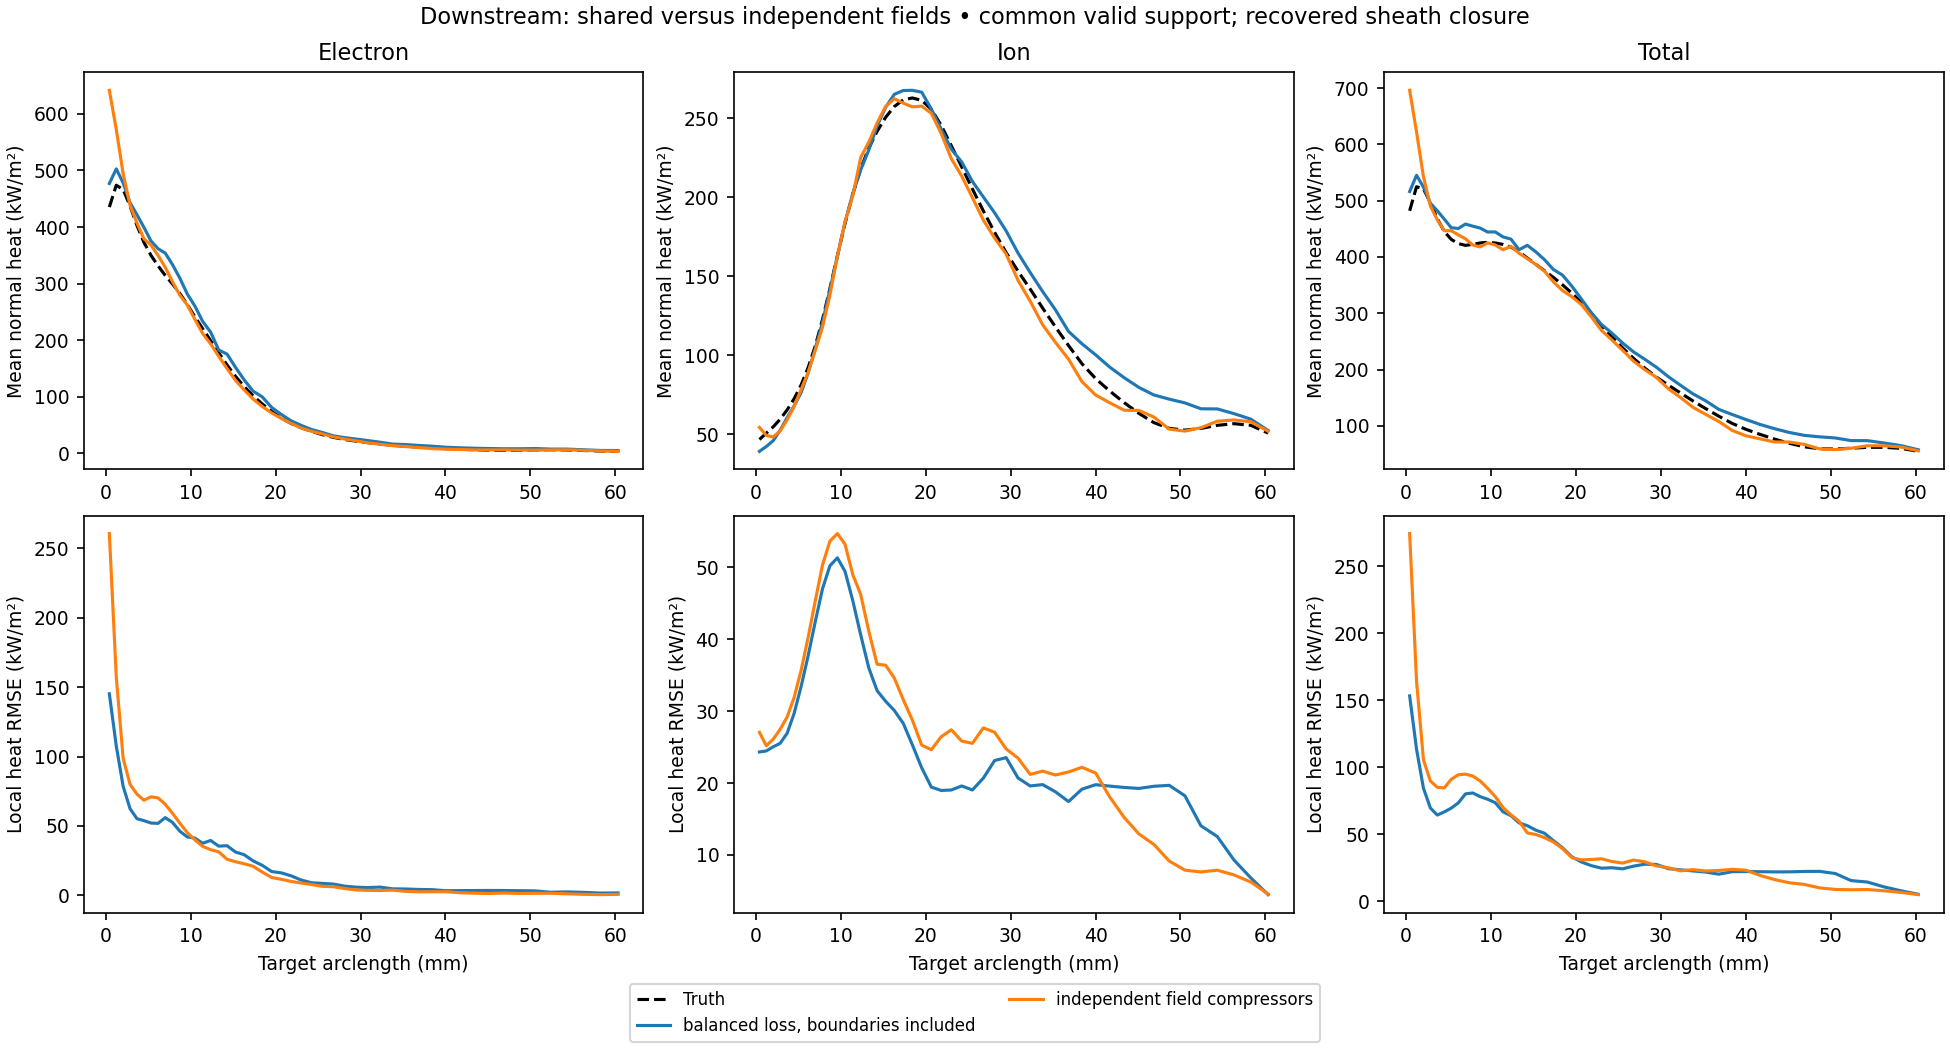
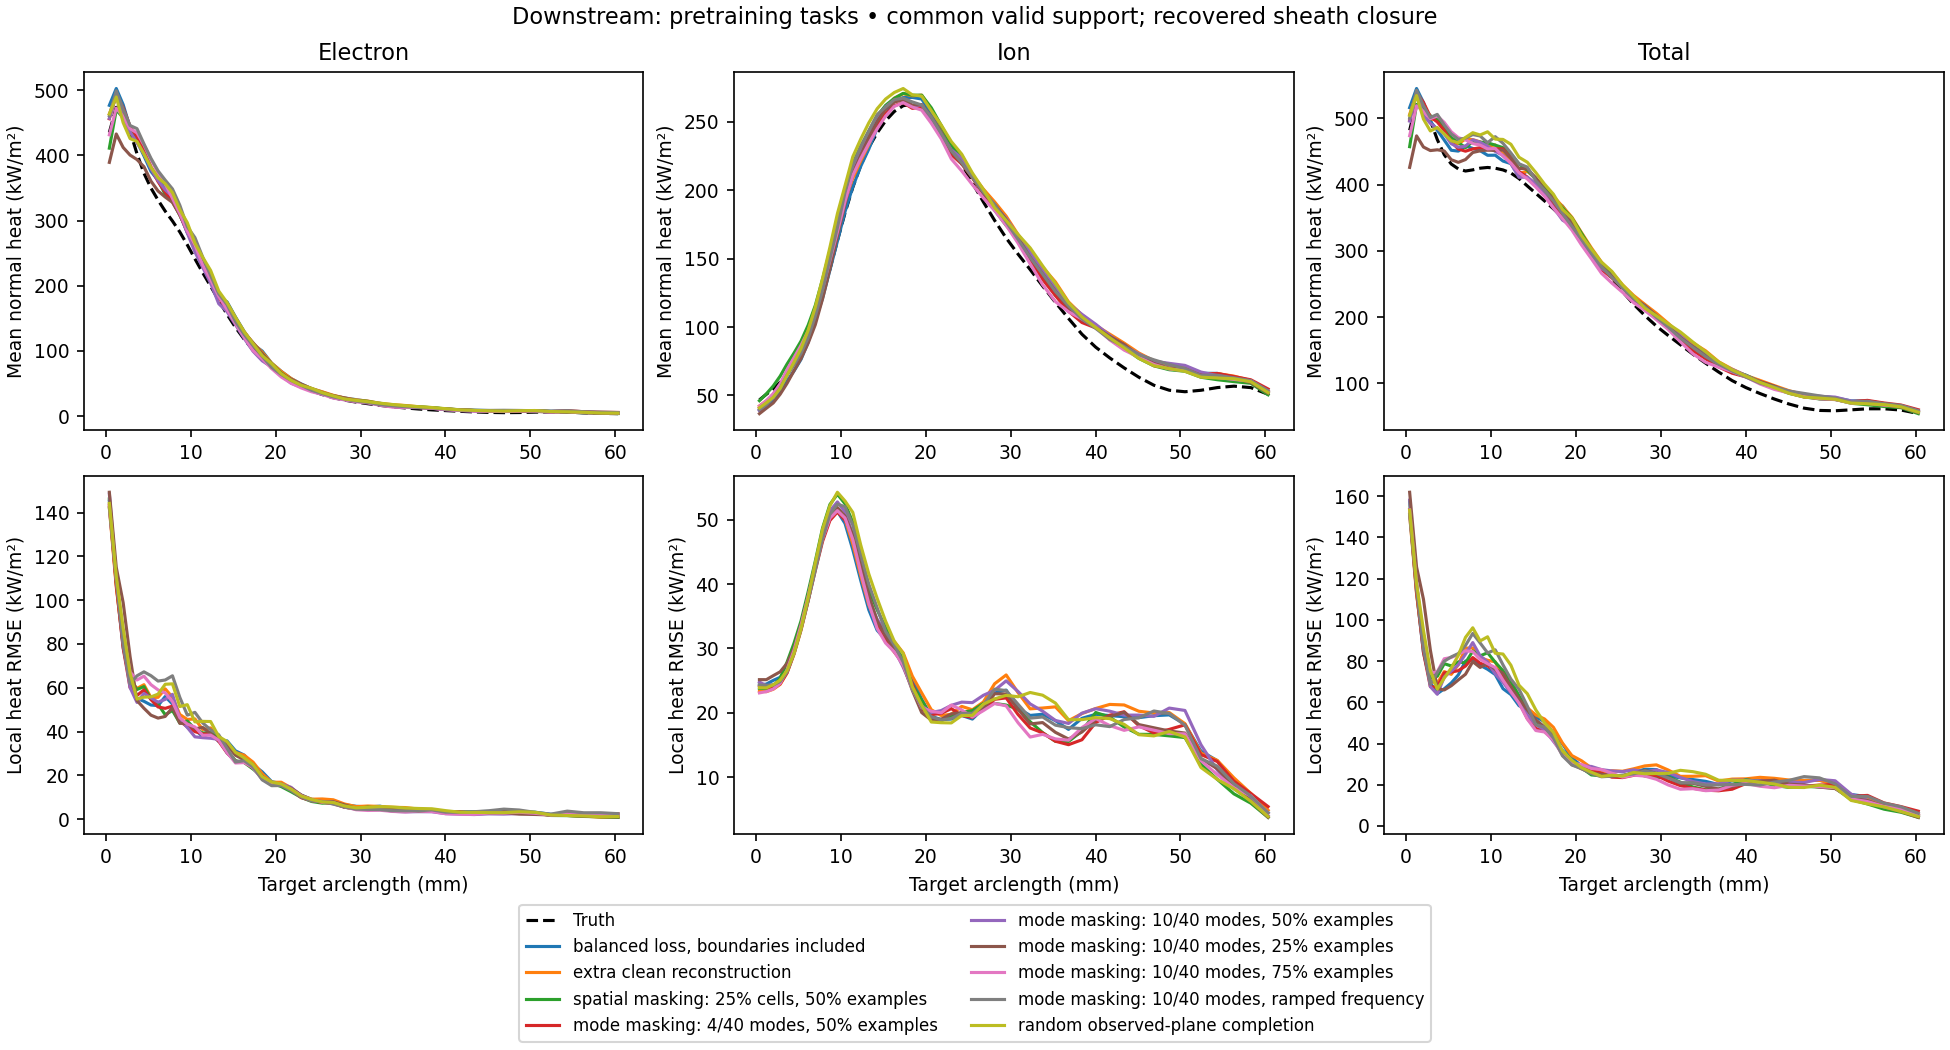
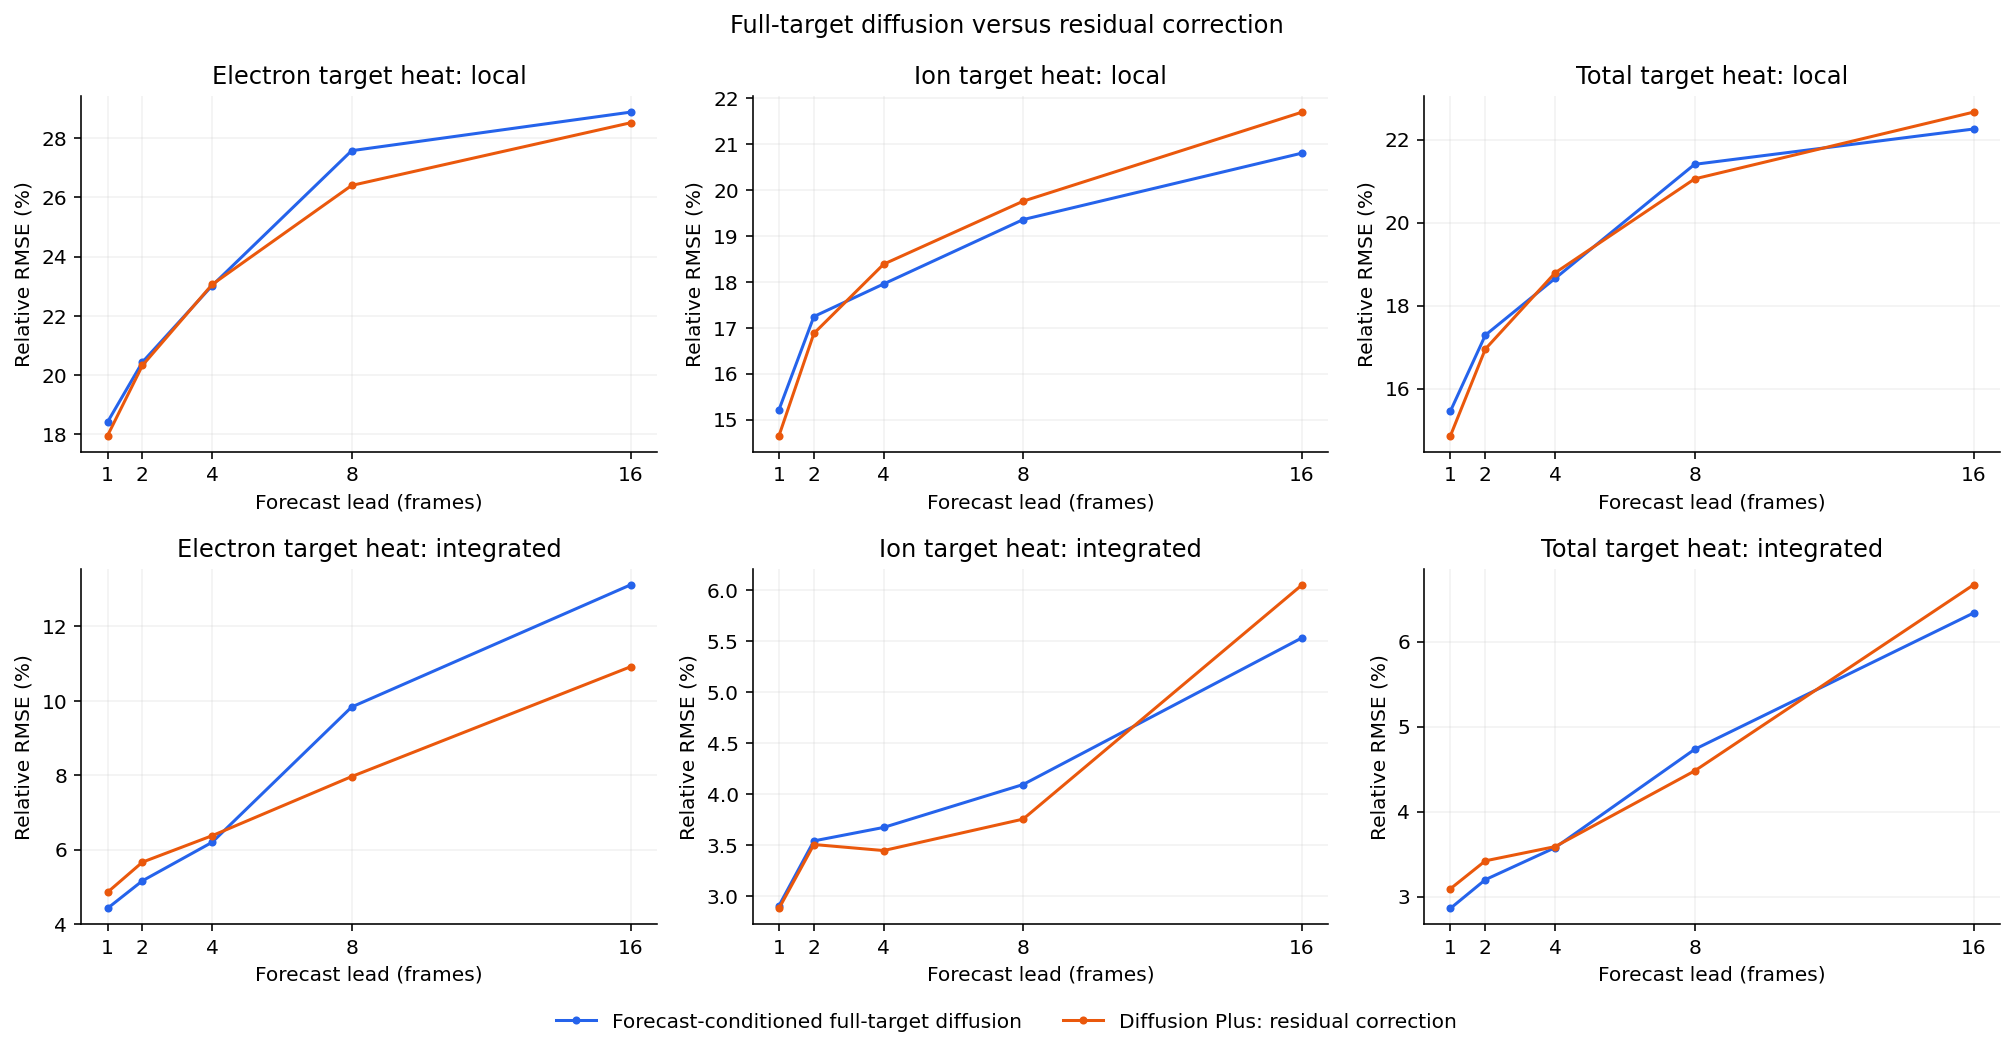
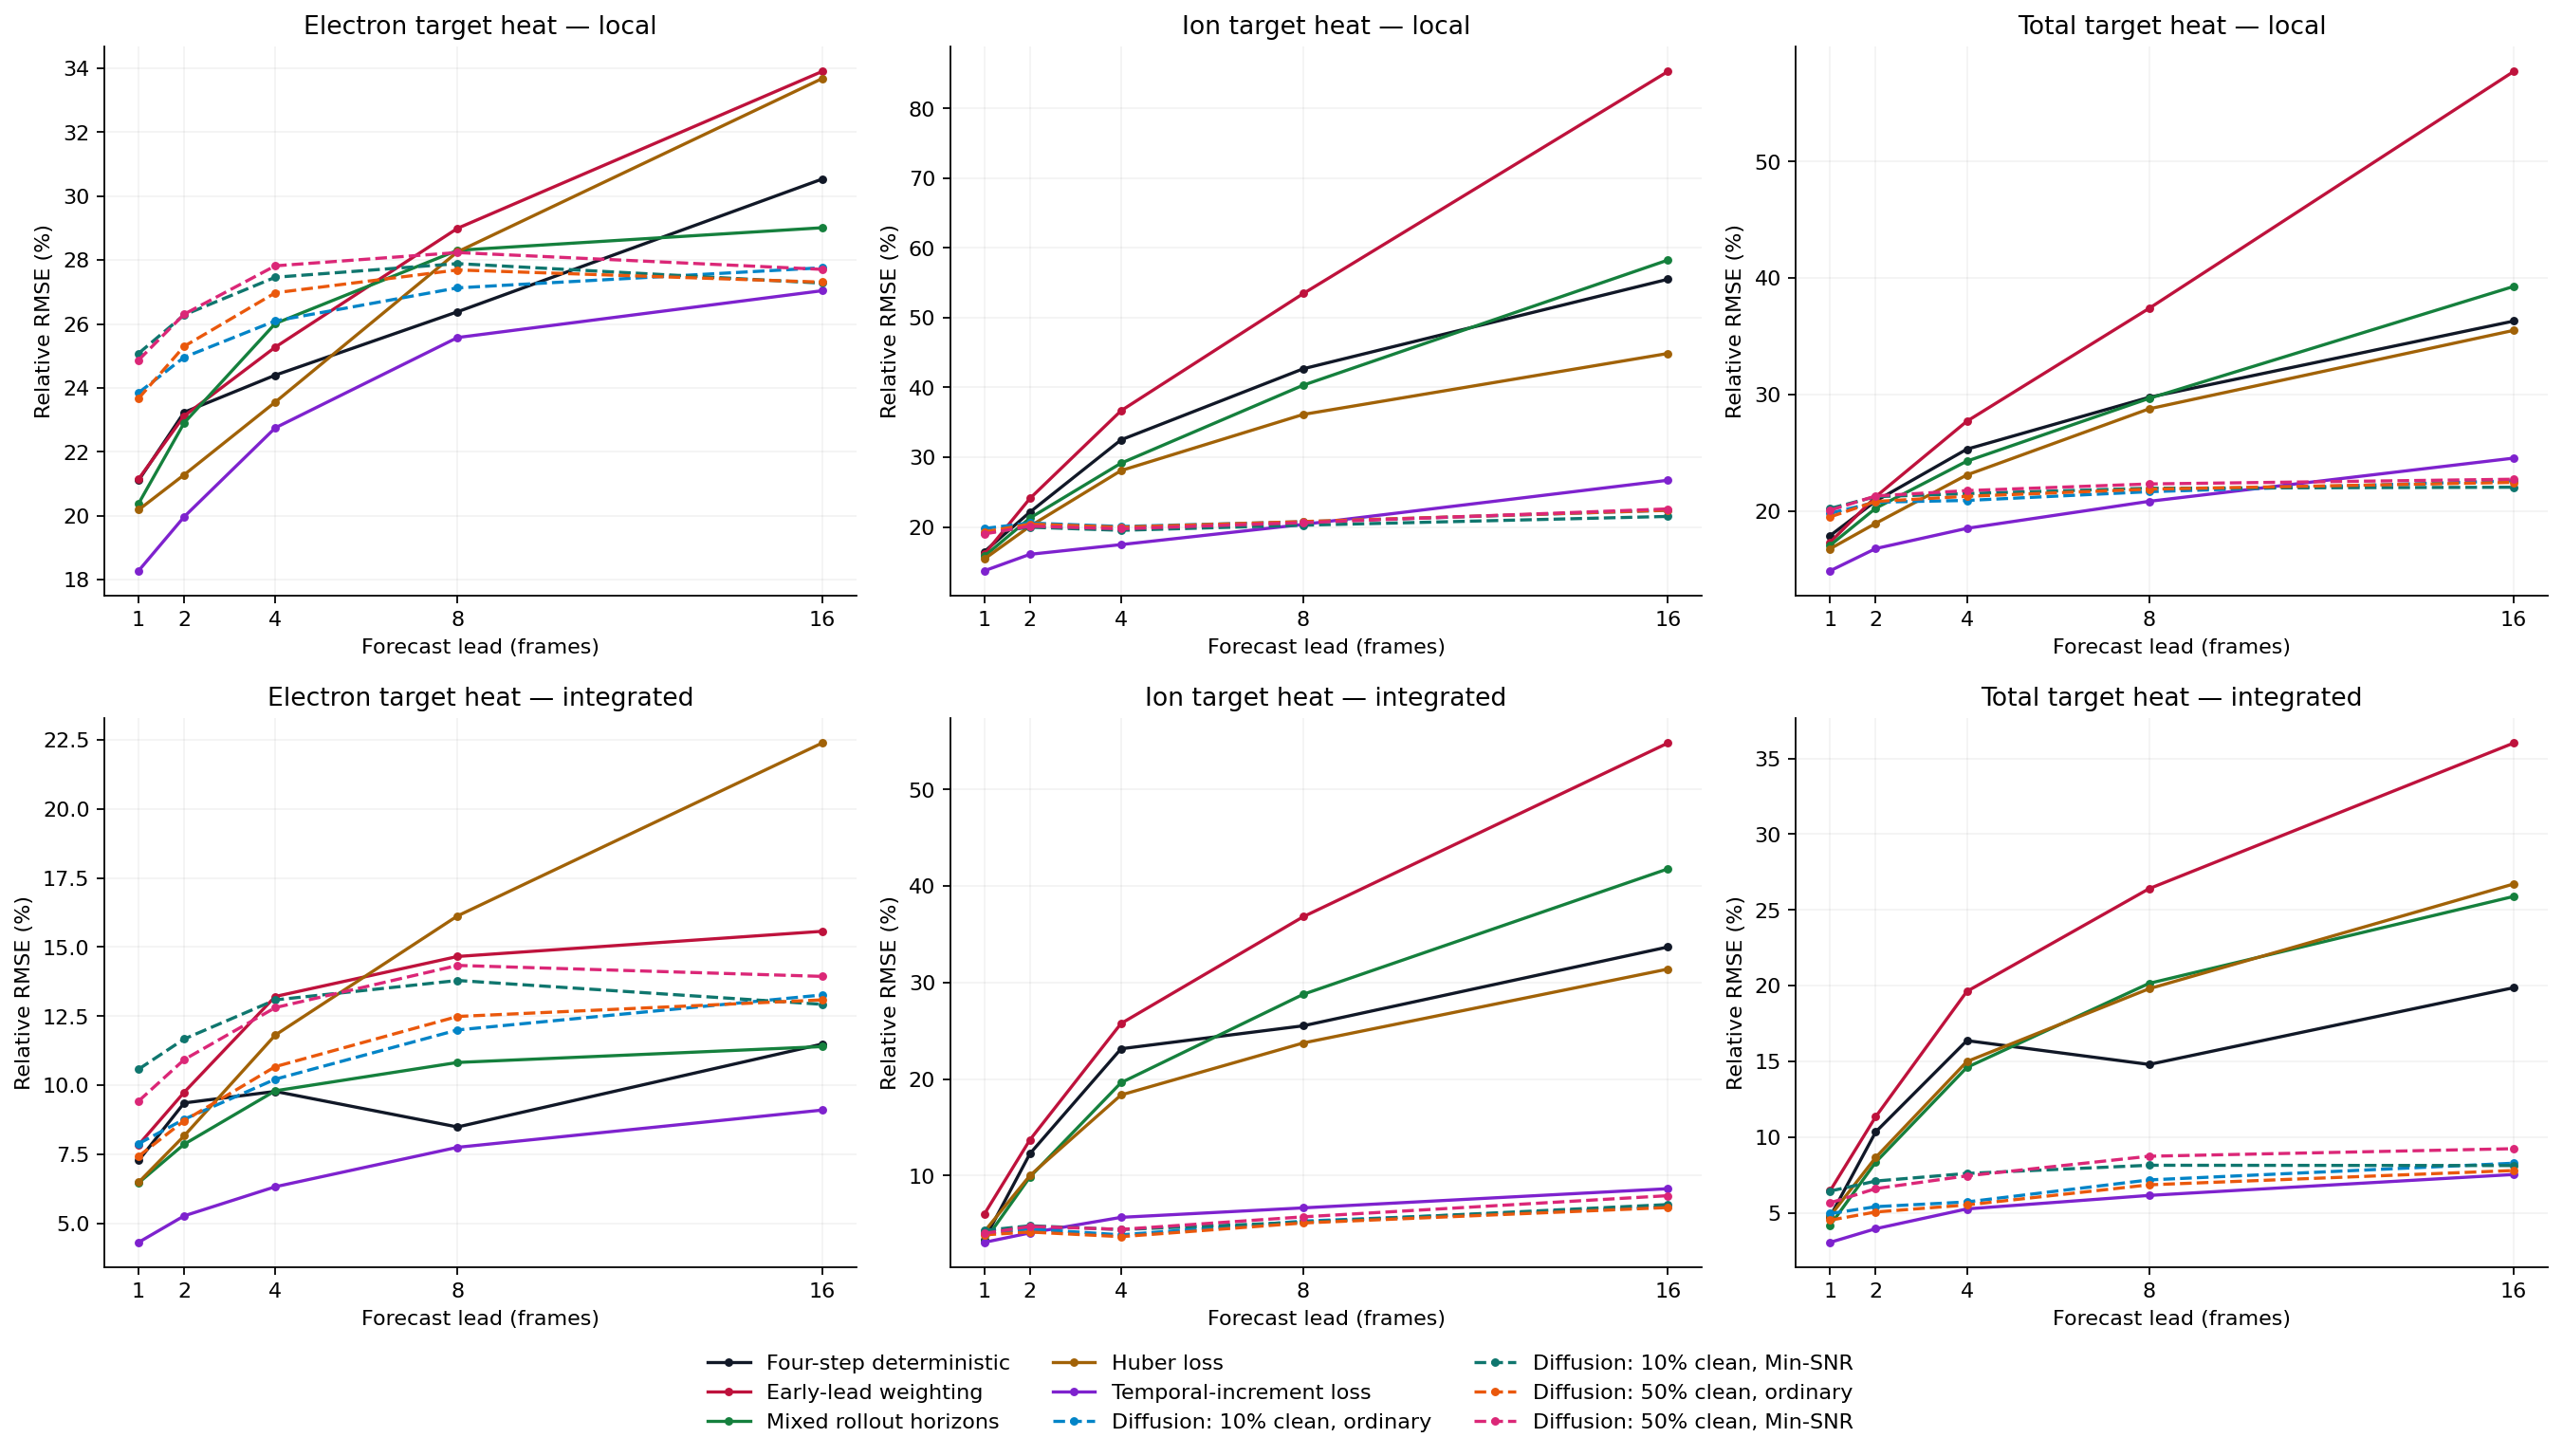
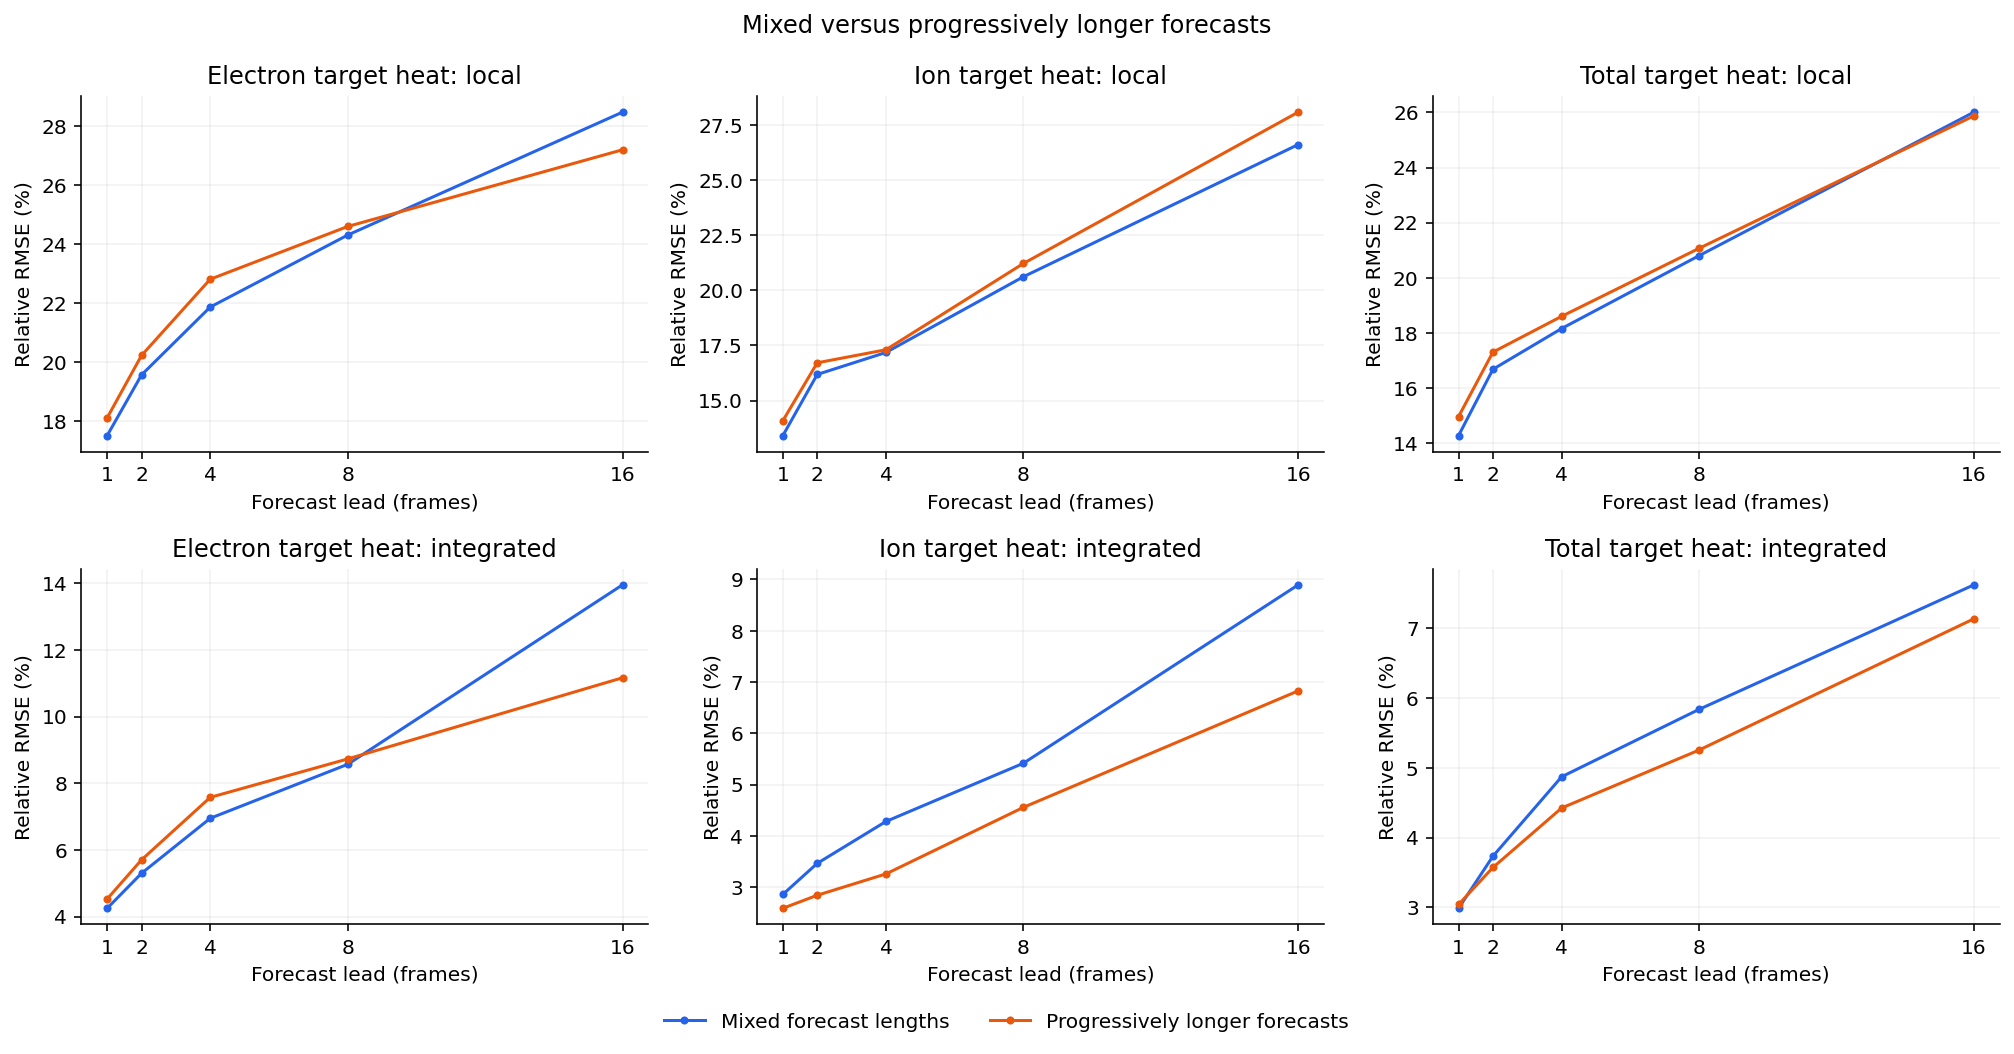
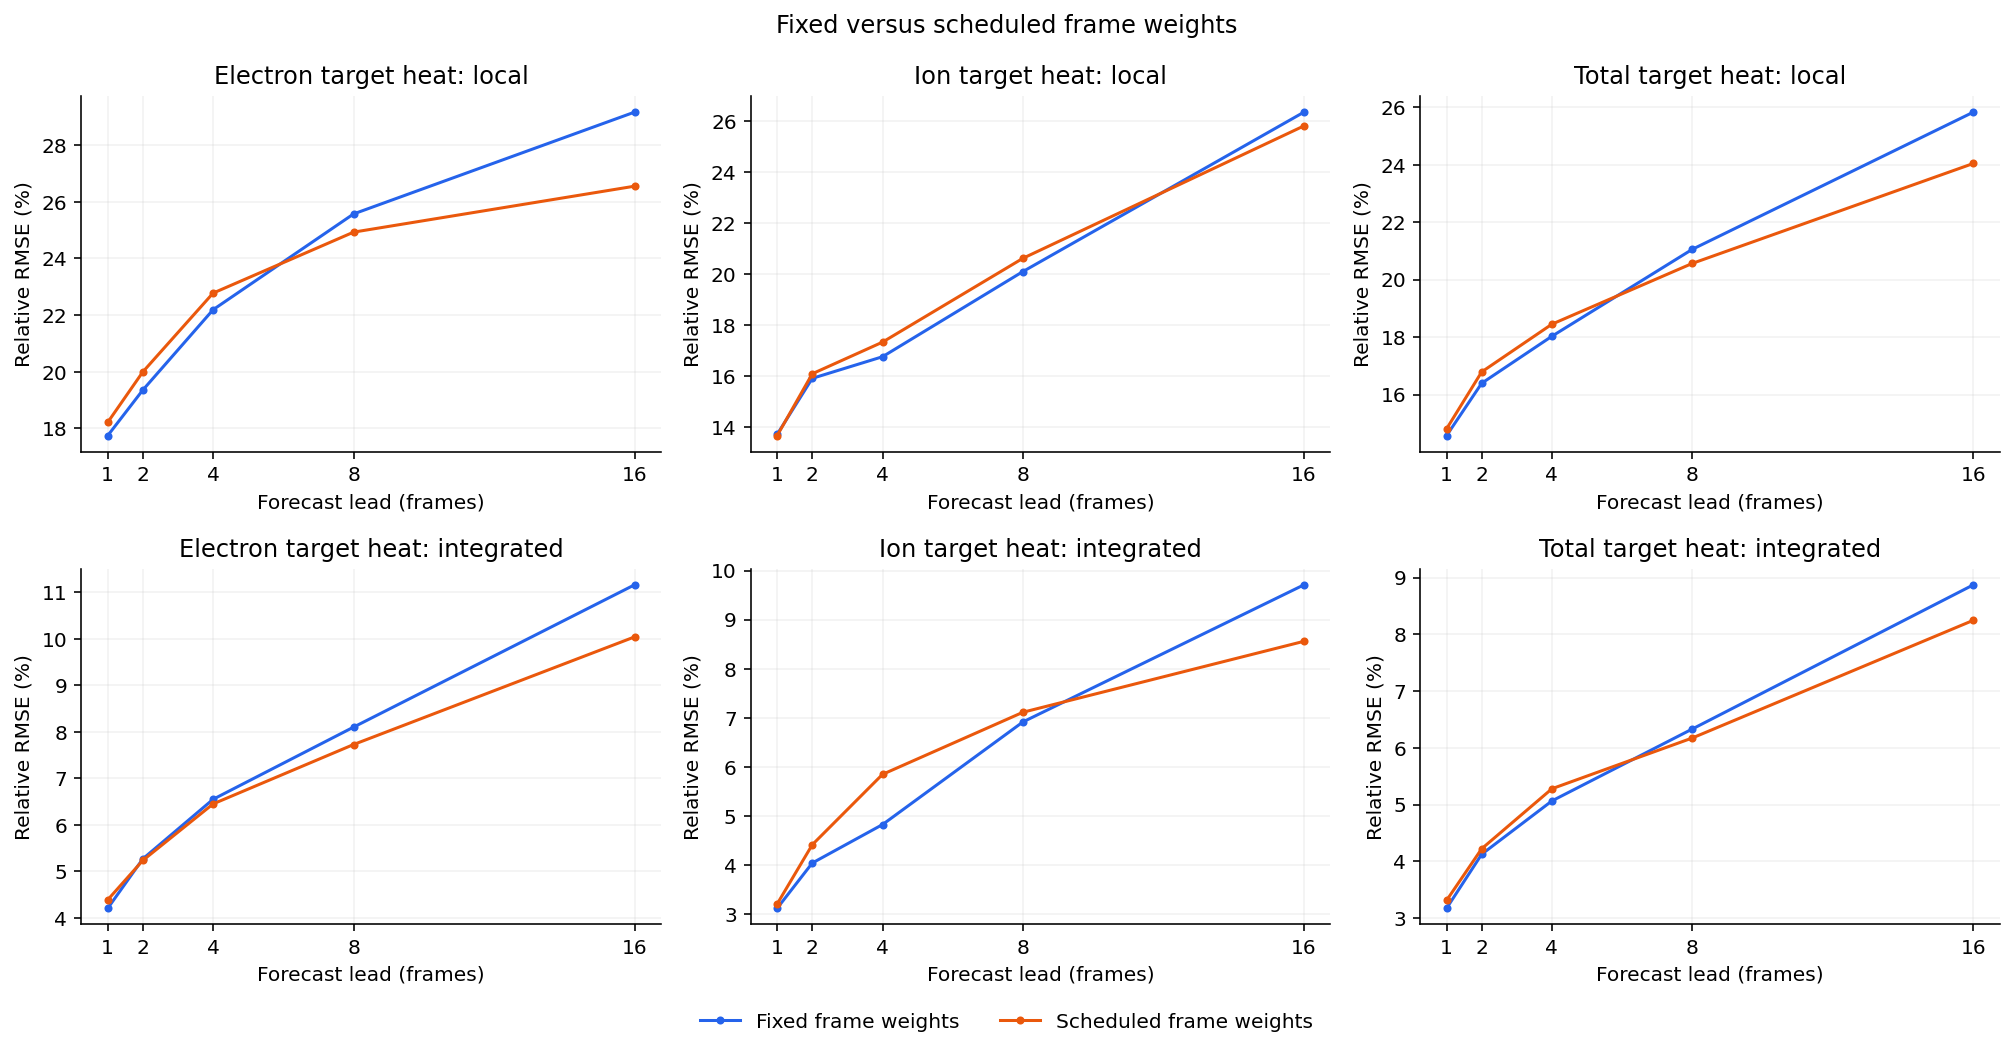
Electron, ion and total target heat
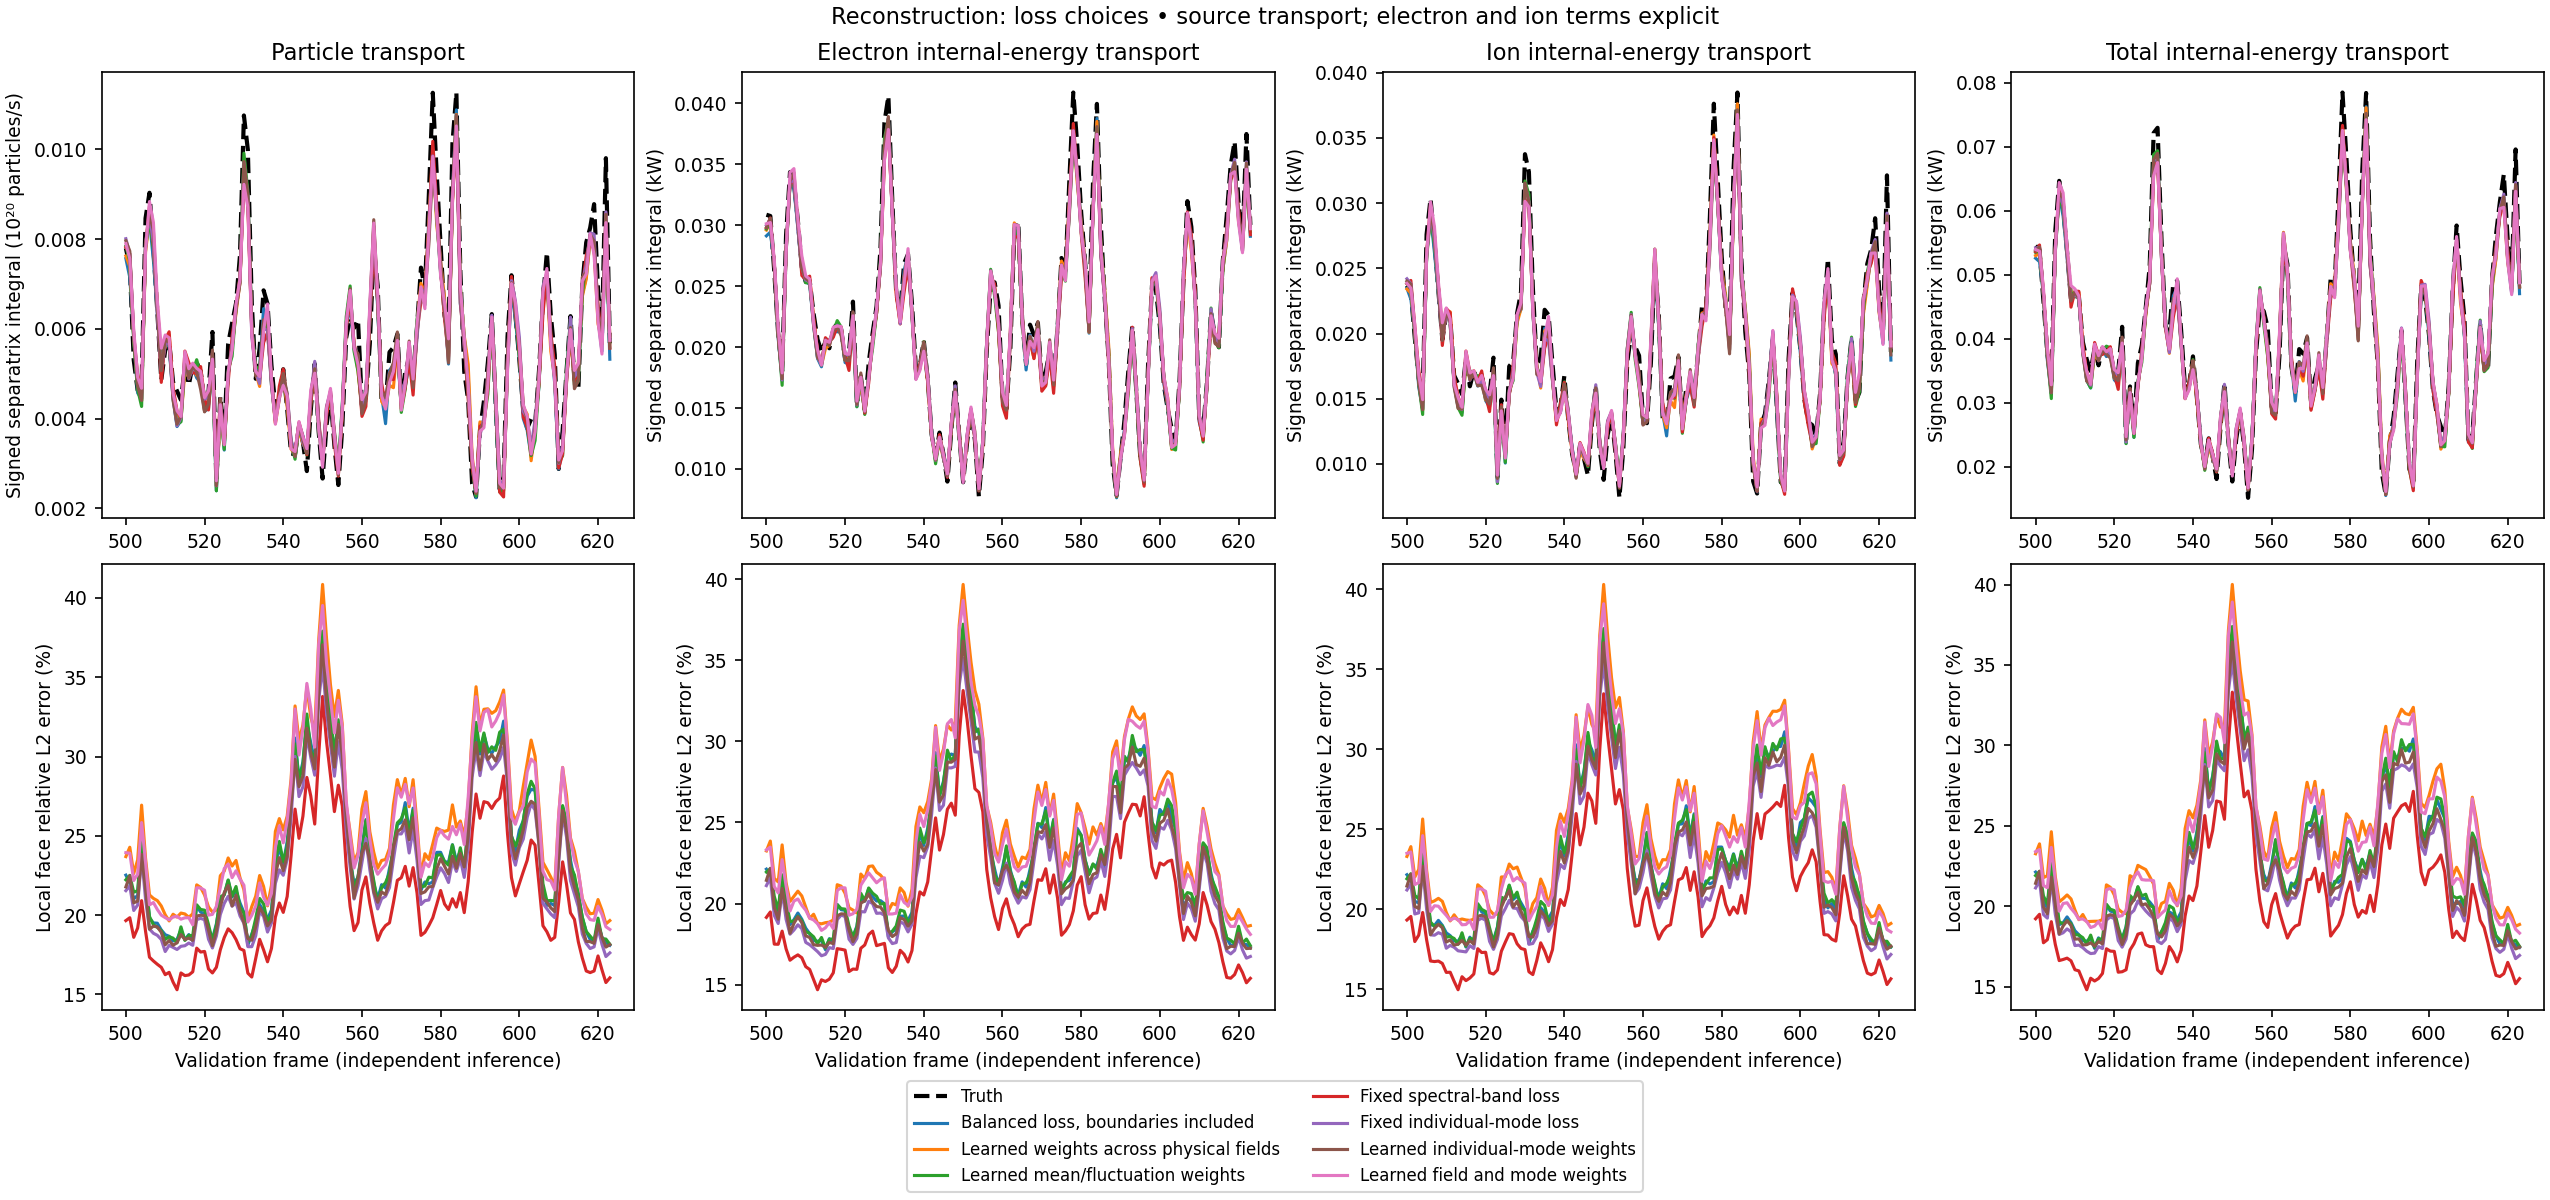
Recovered sheath estimate, not measured tile loading. Five saved leads; no temporal interpolation. Radial internal-energy transport is a different diagnostic.
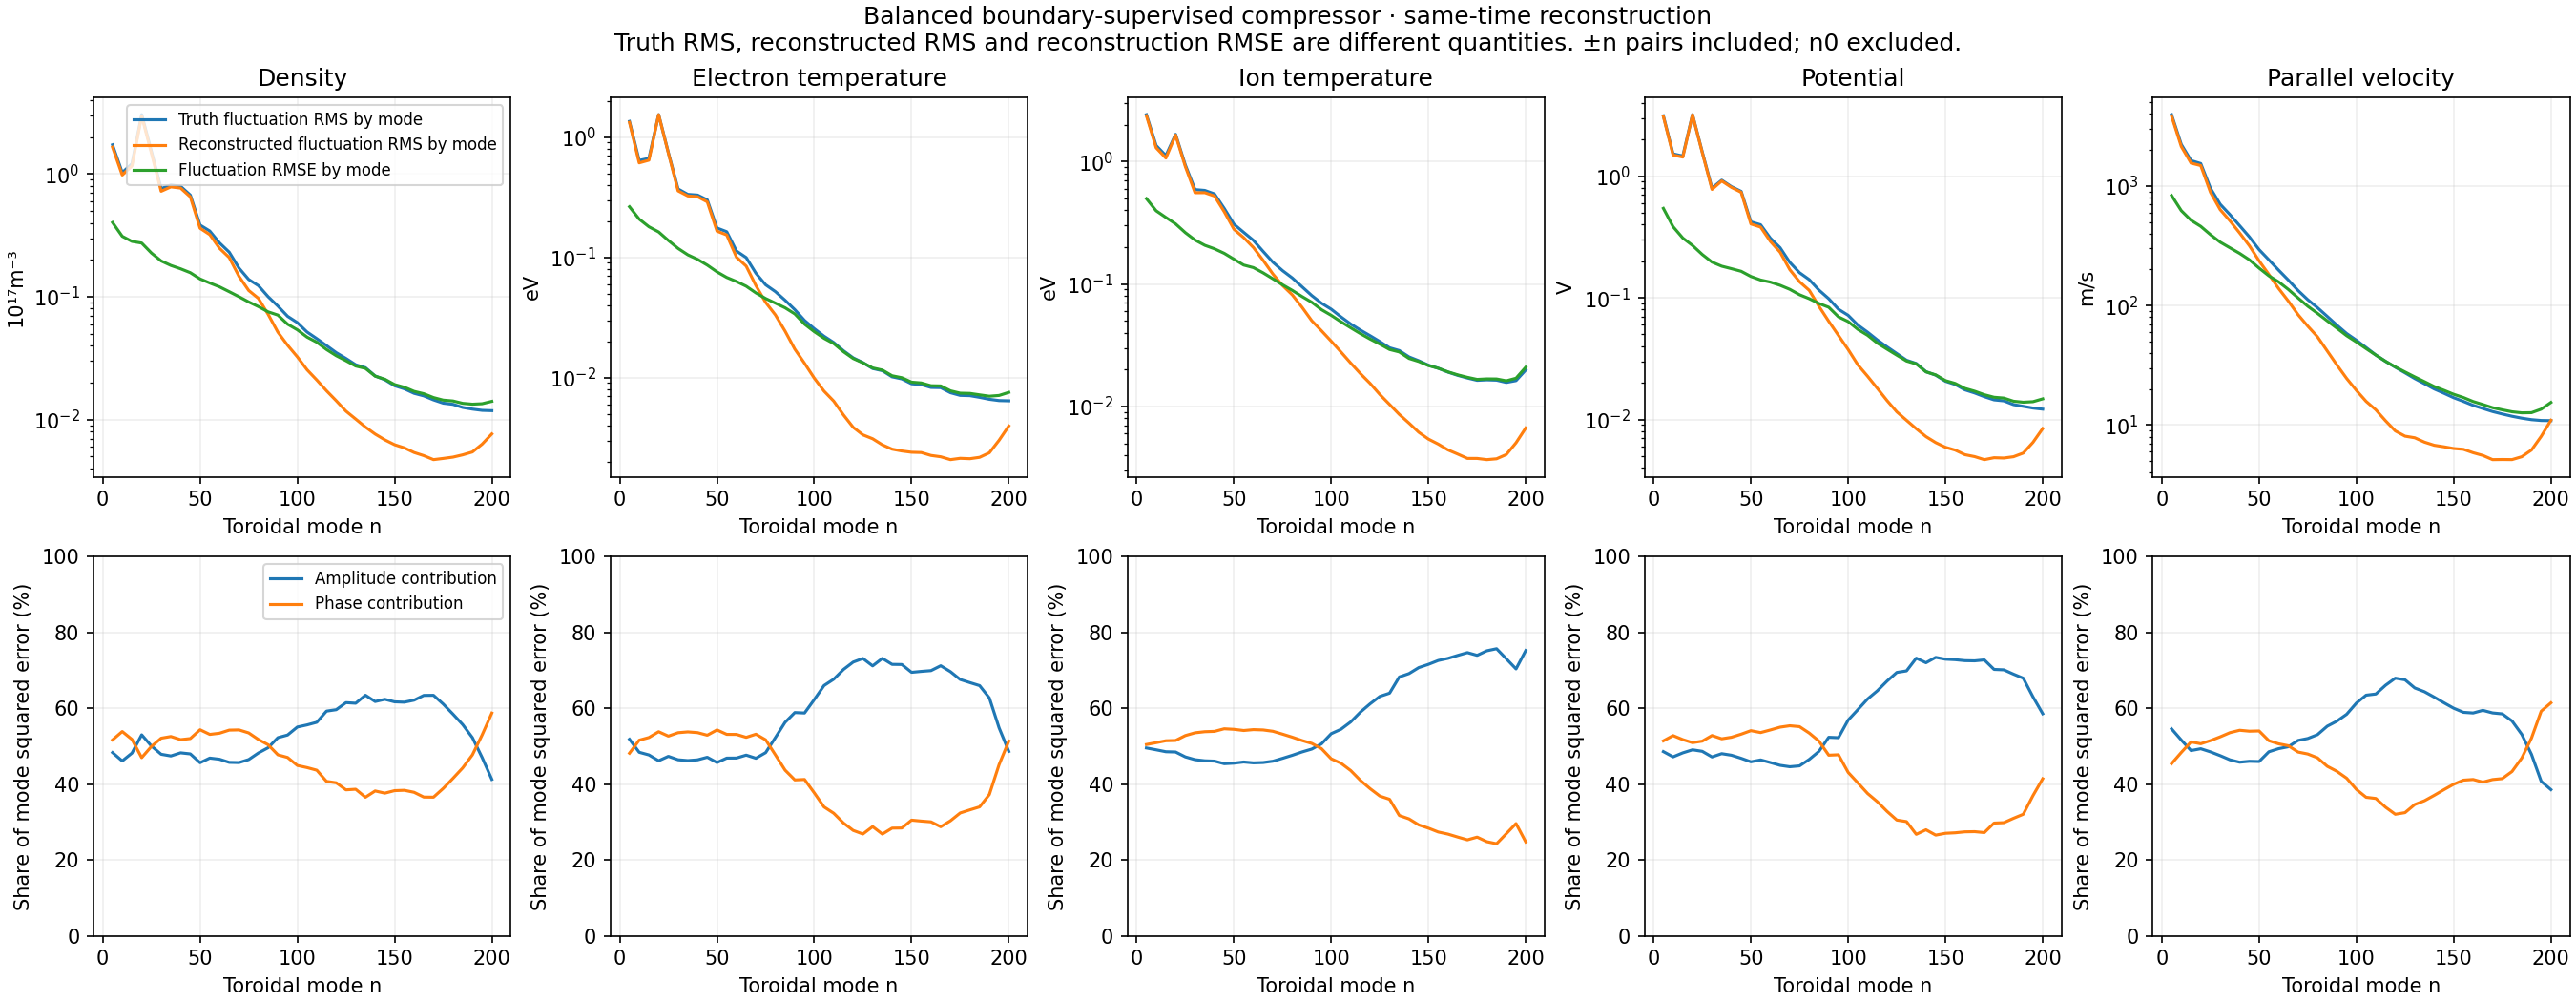
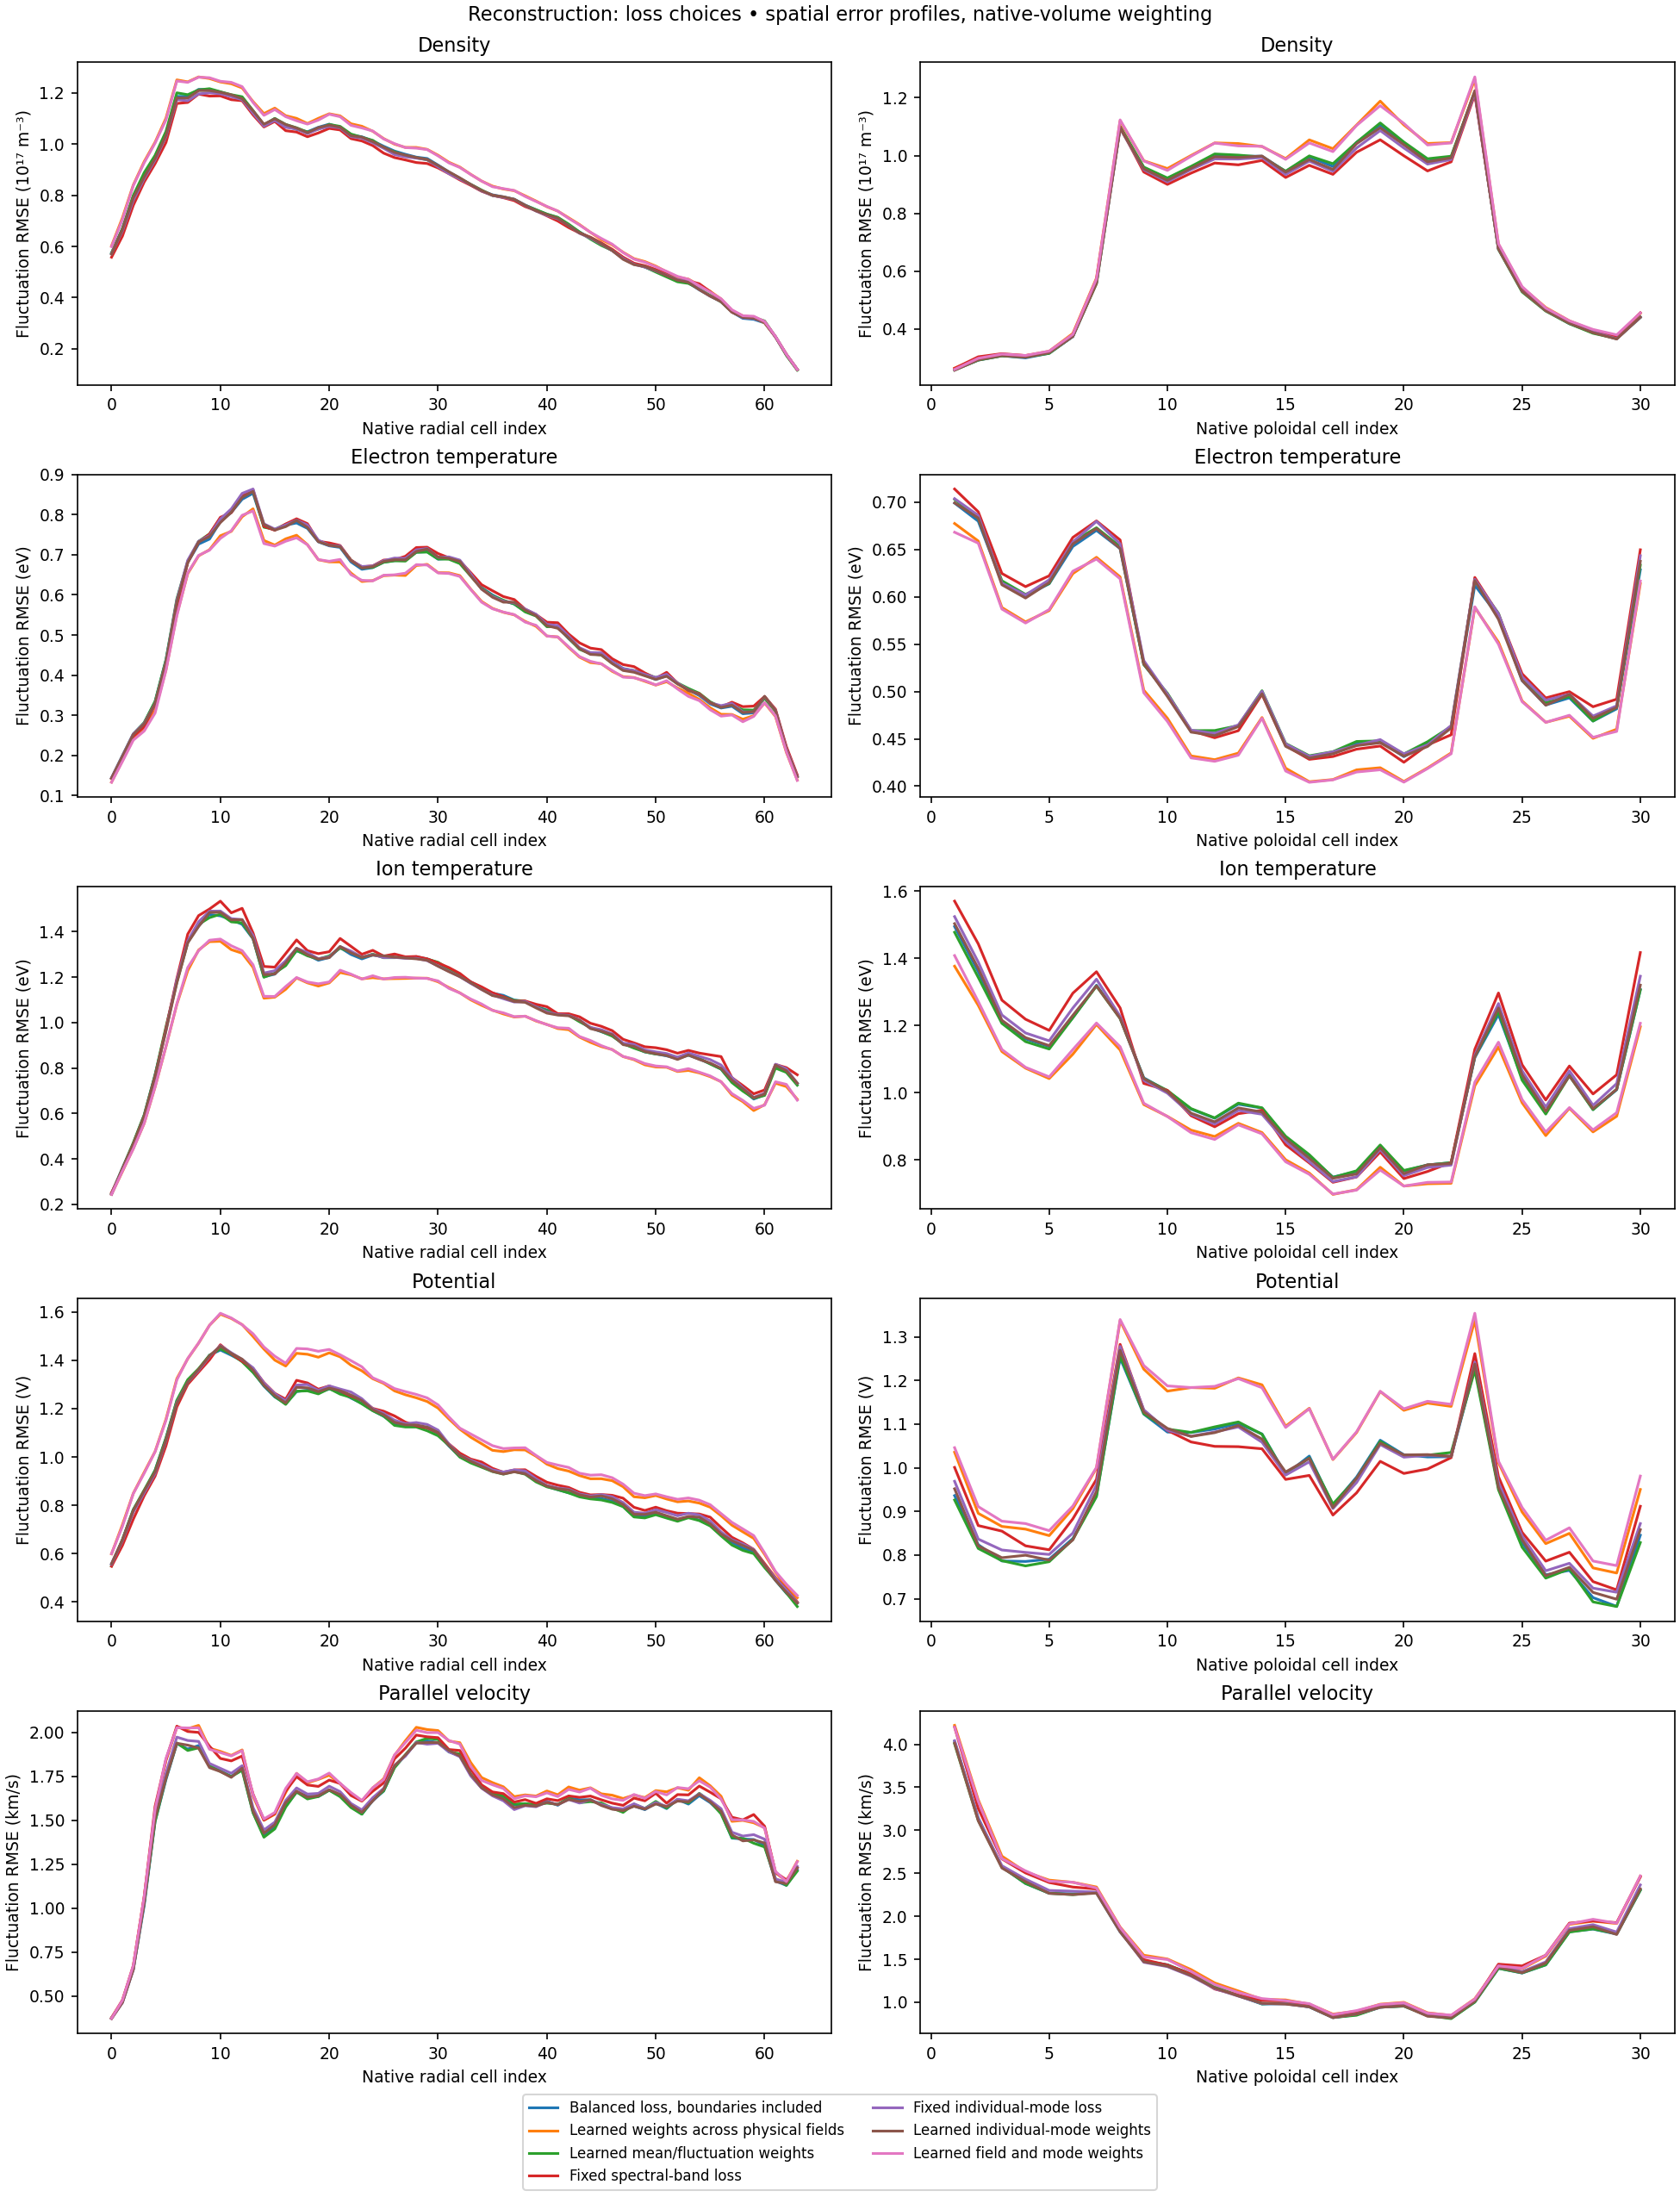
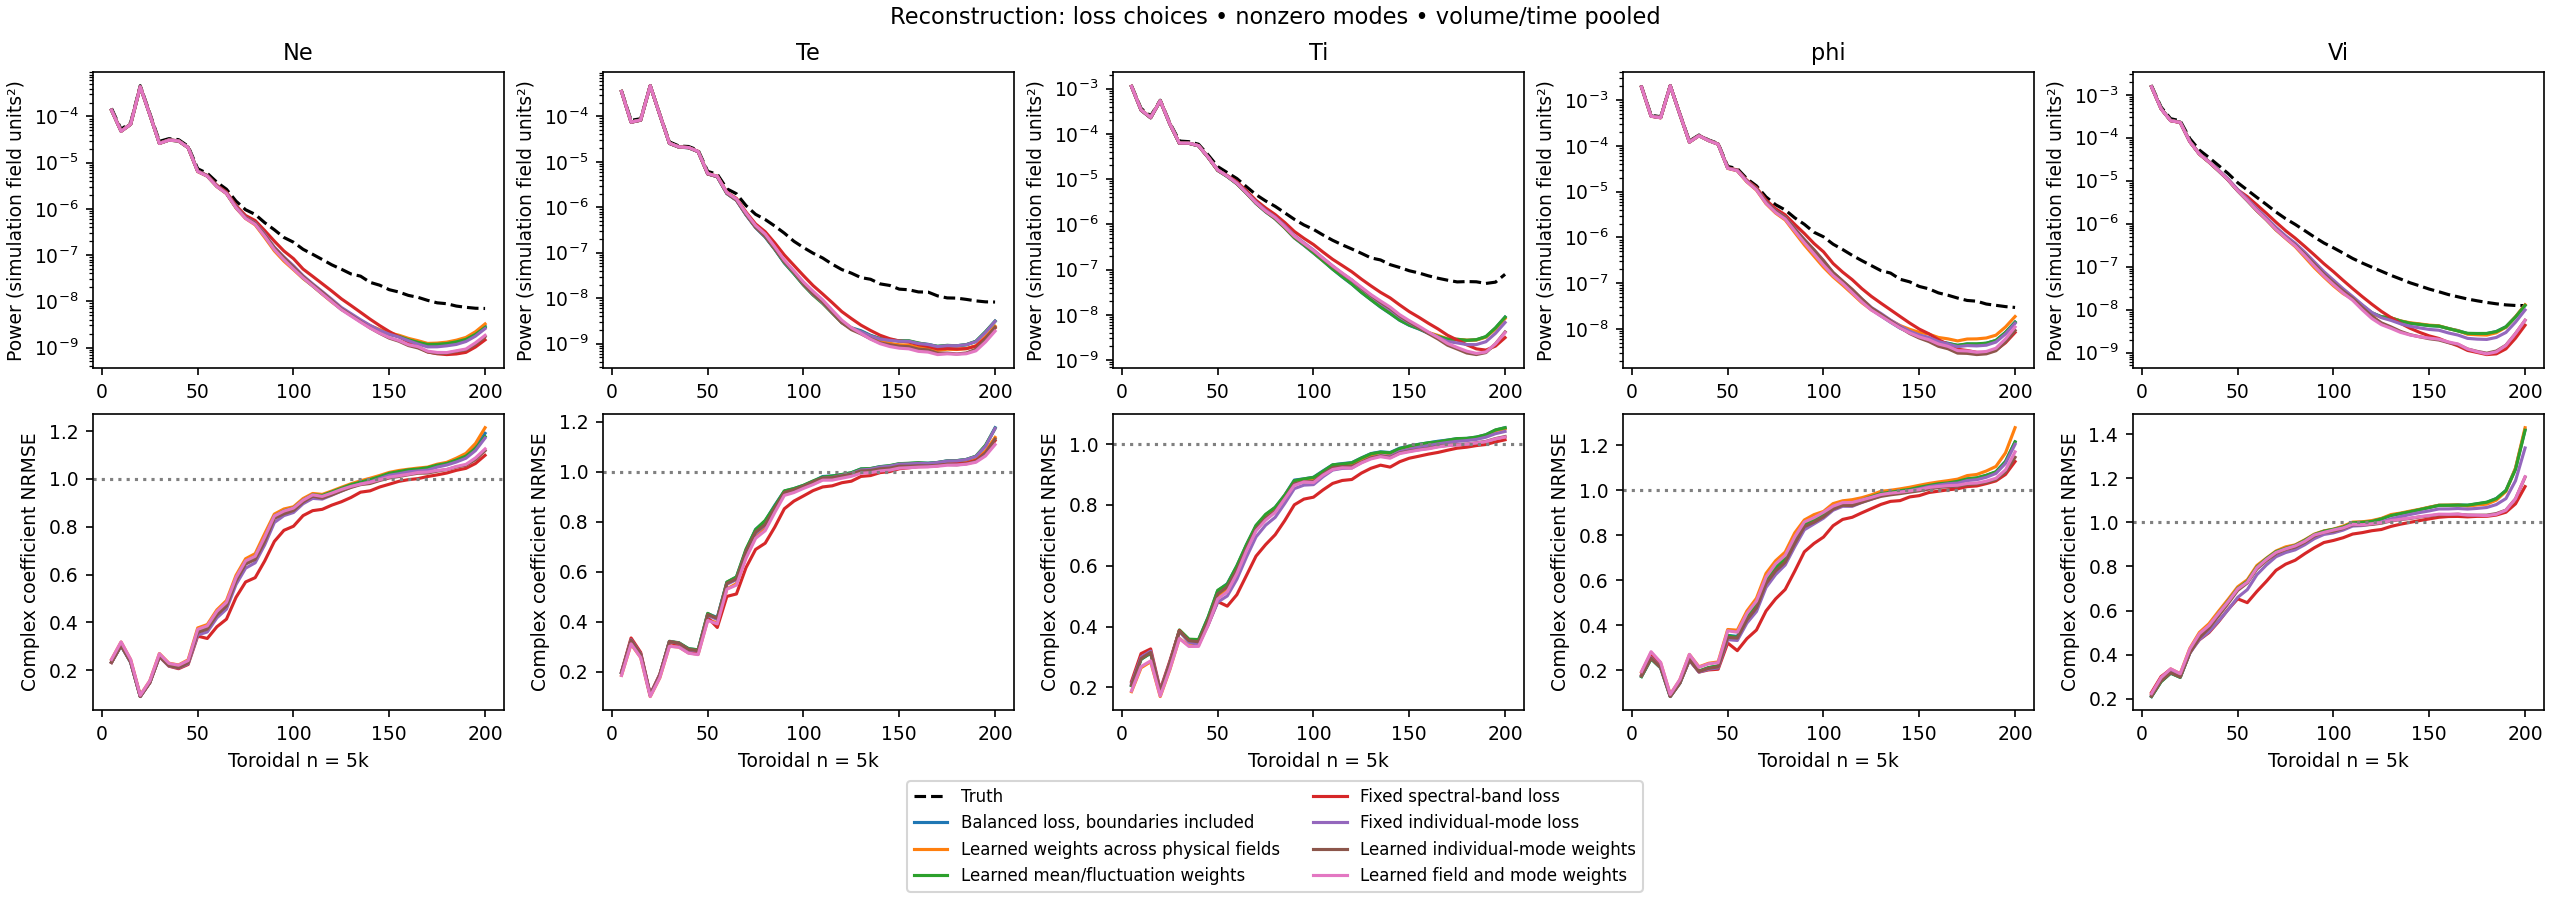
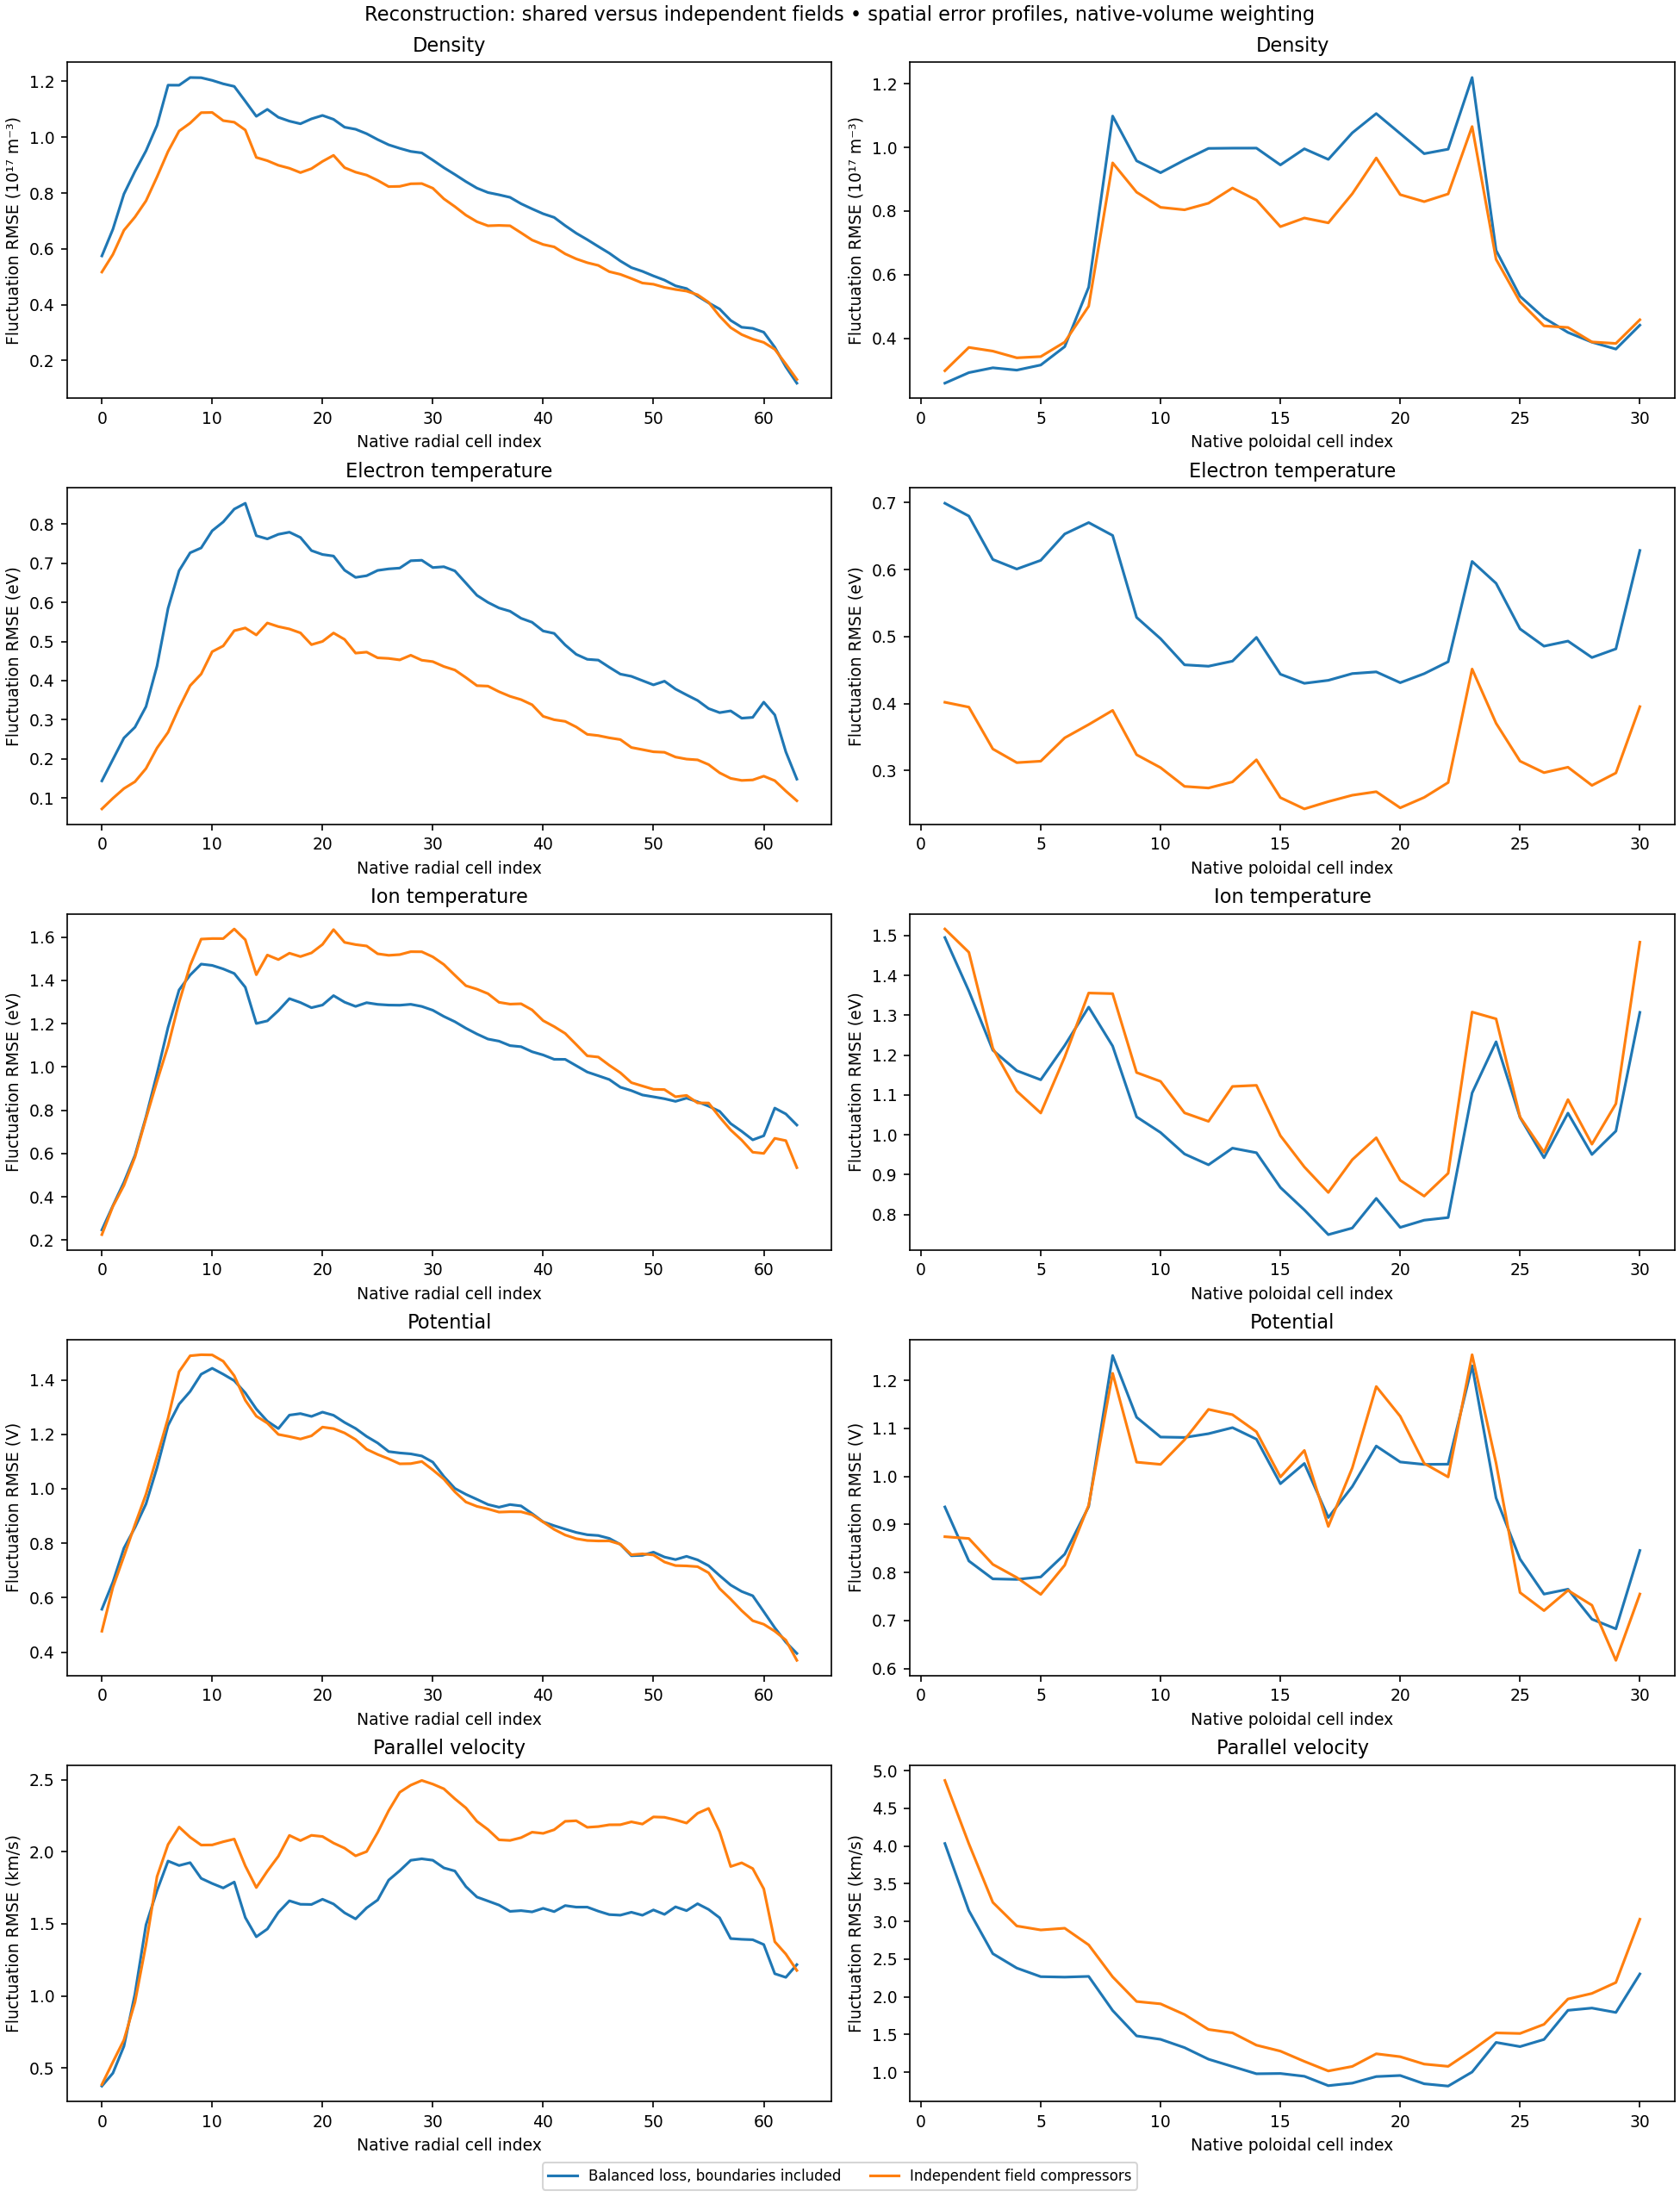
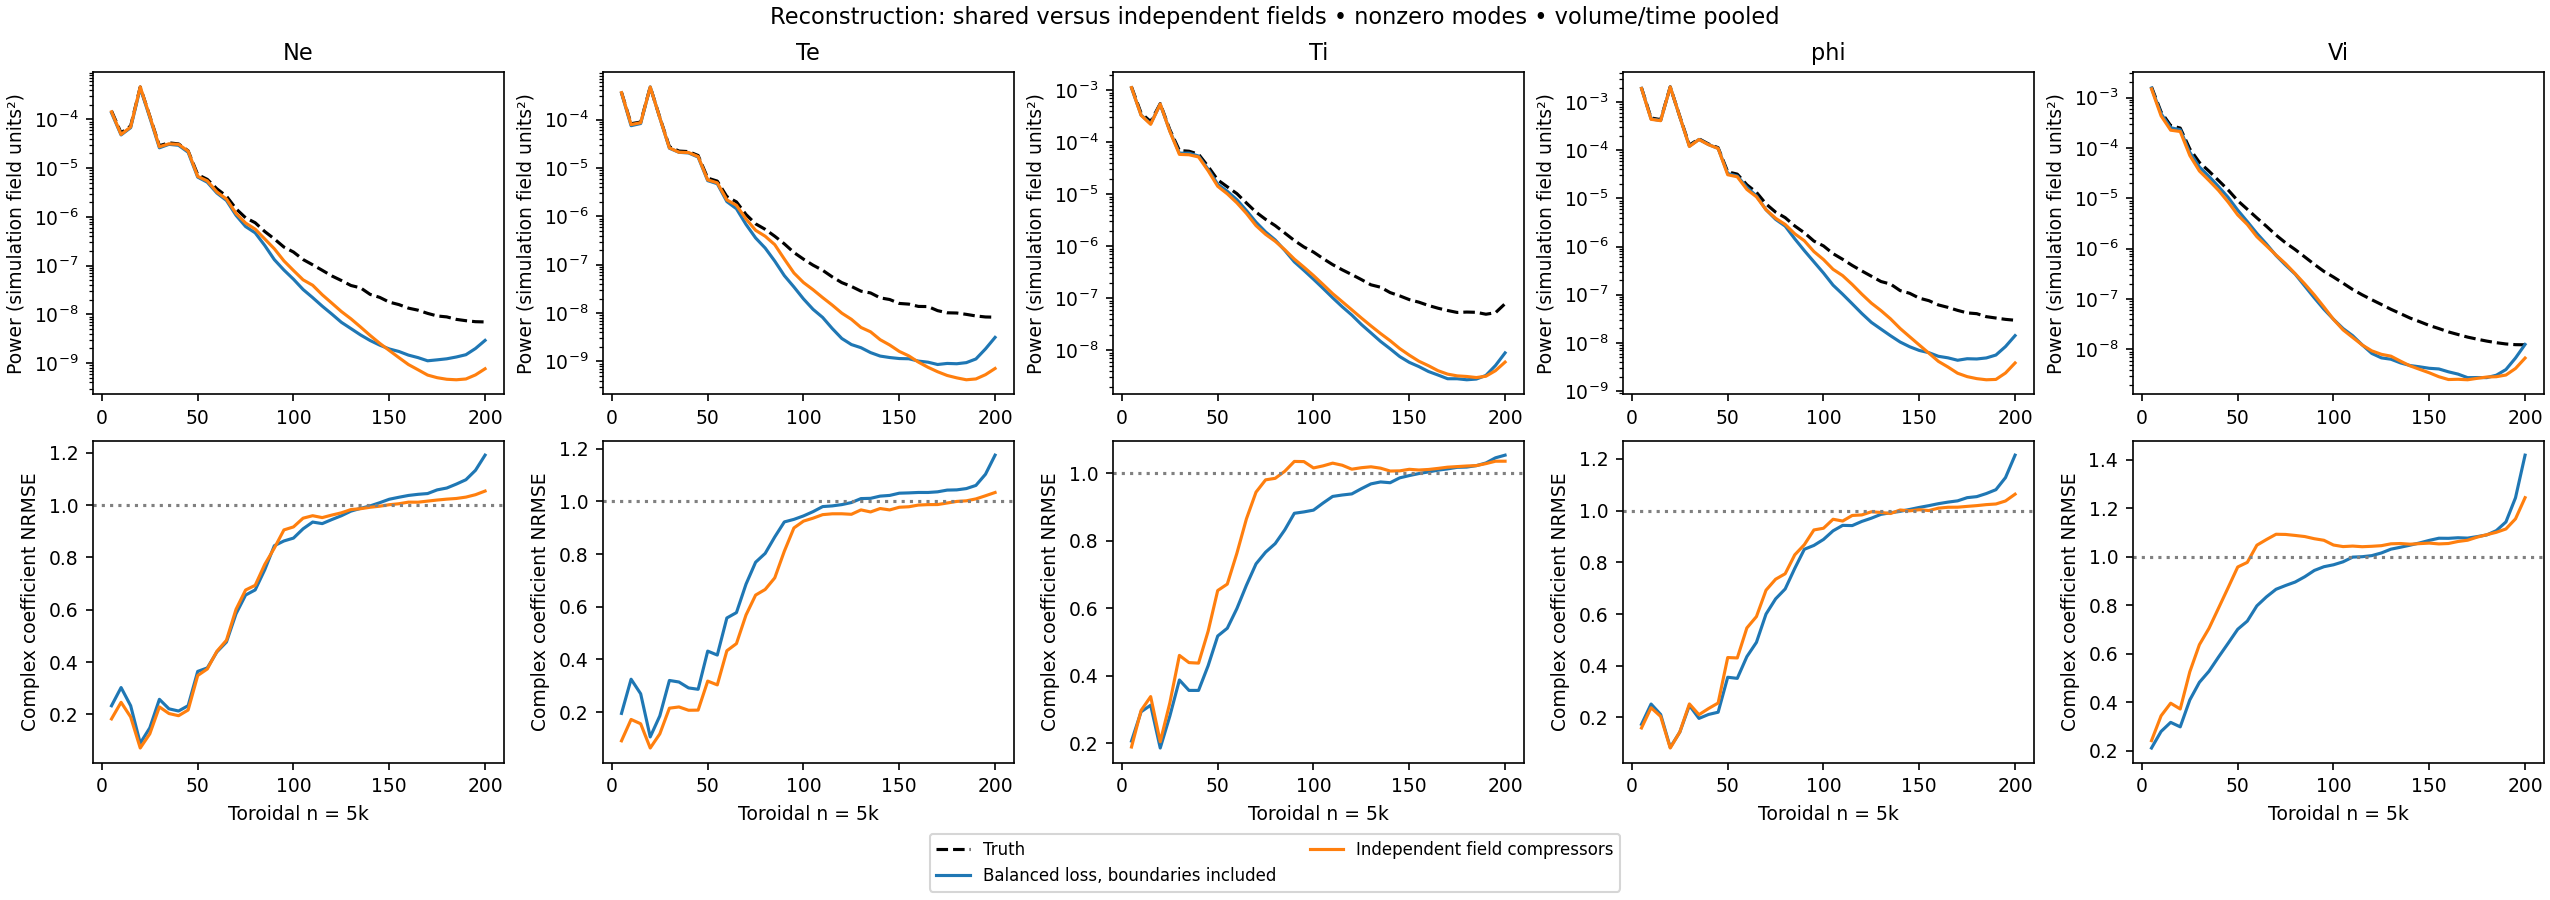
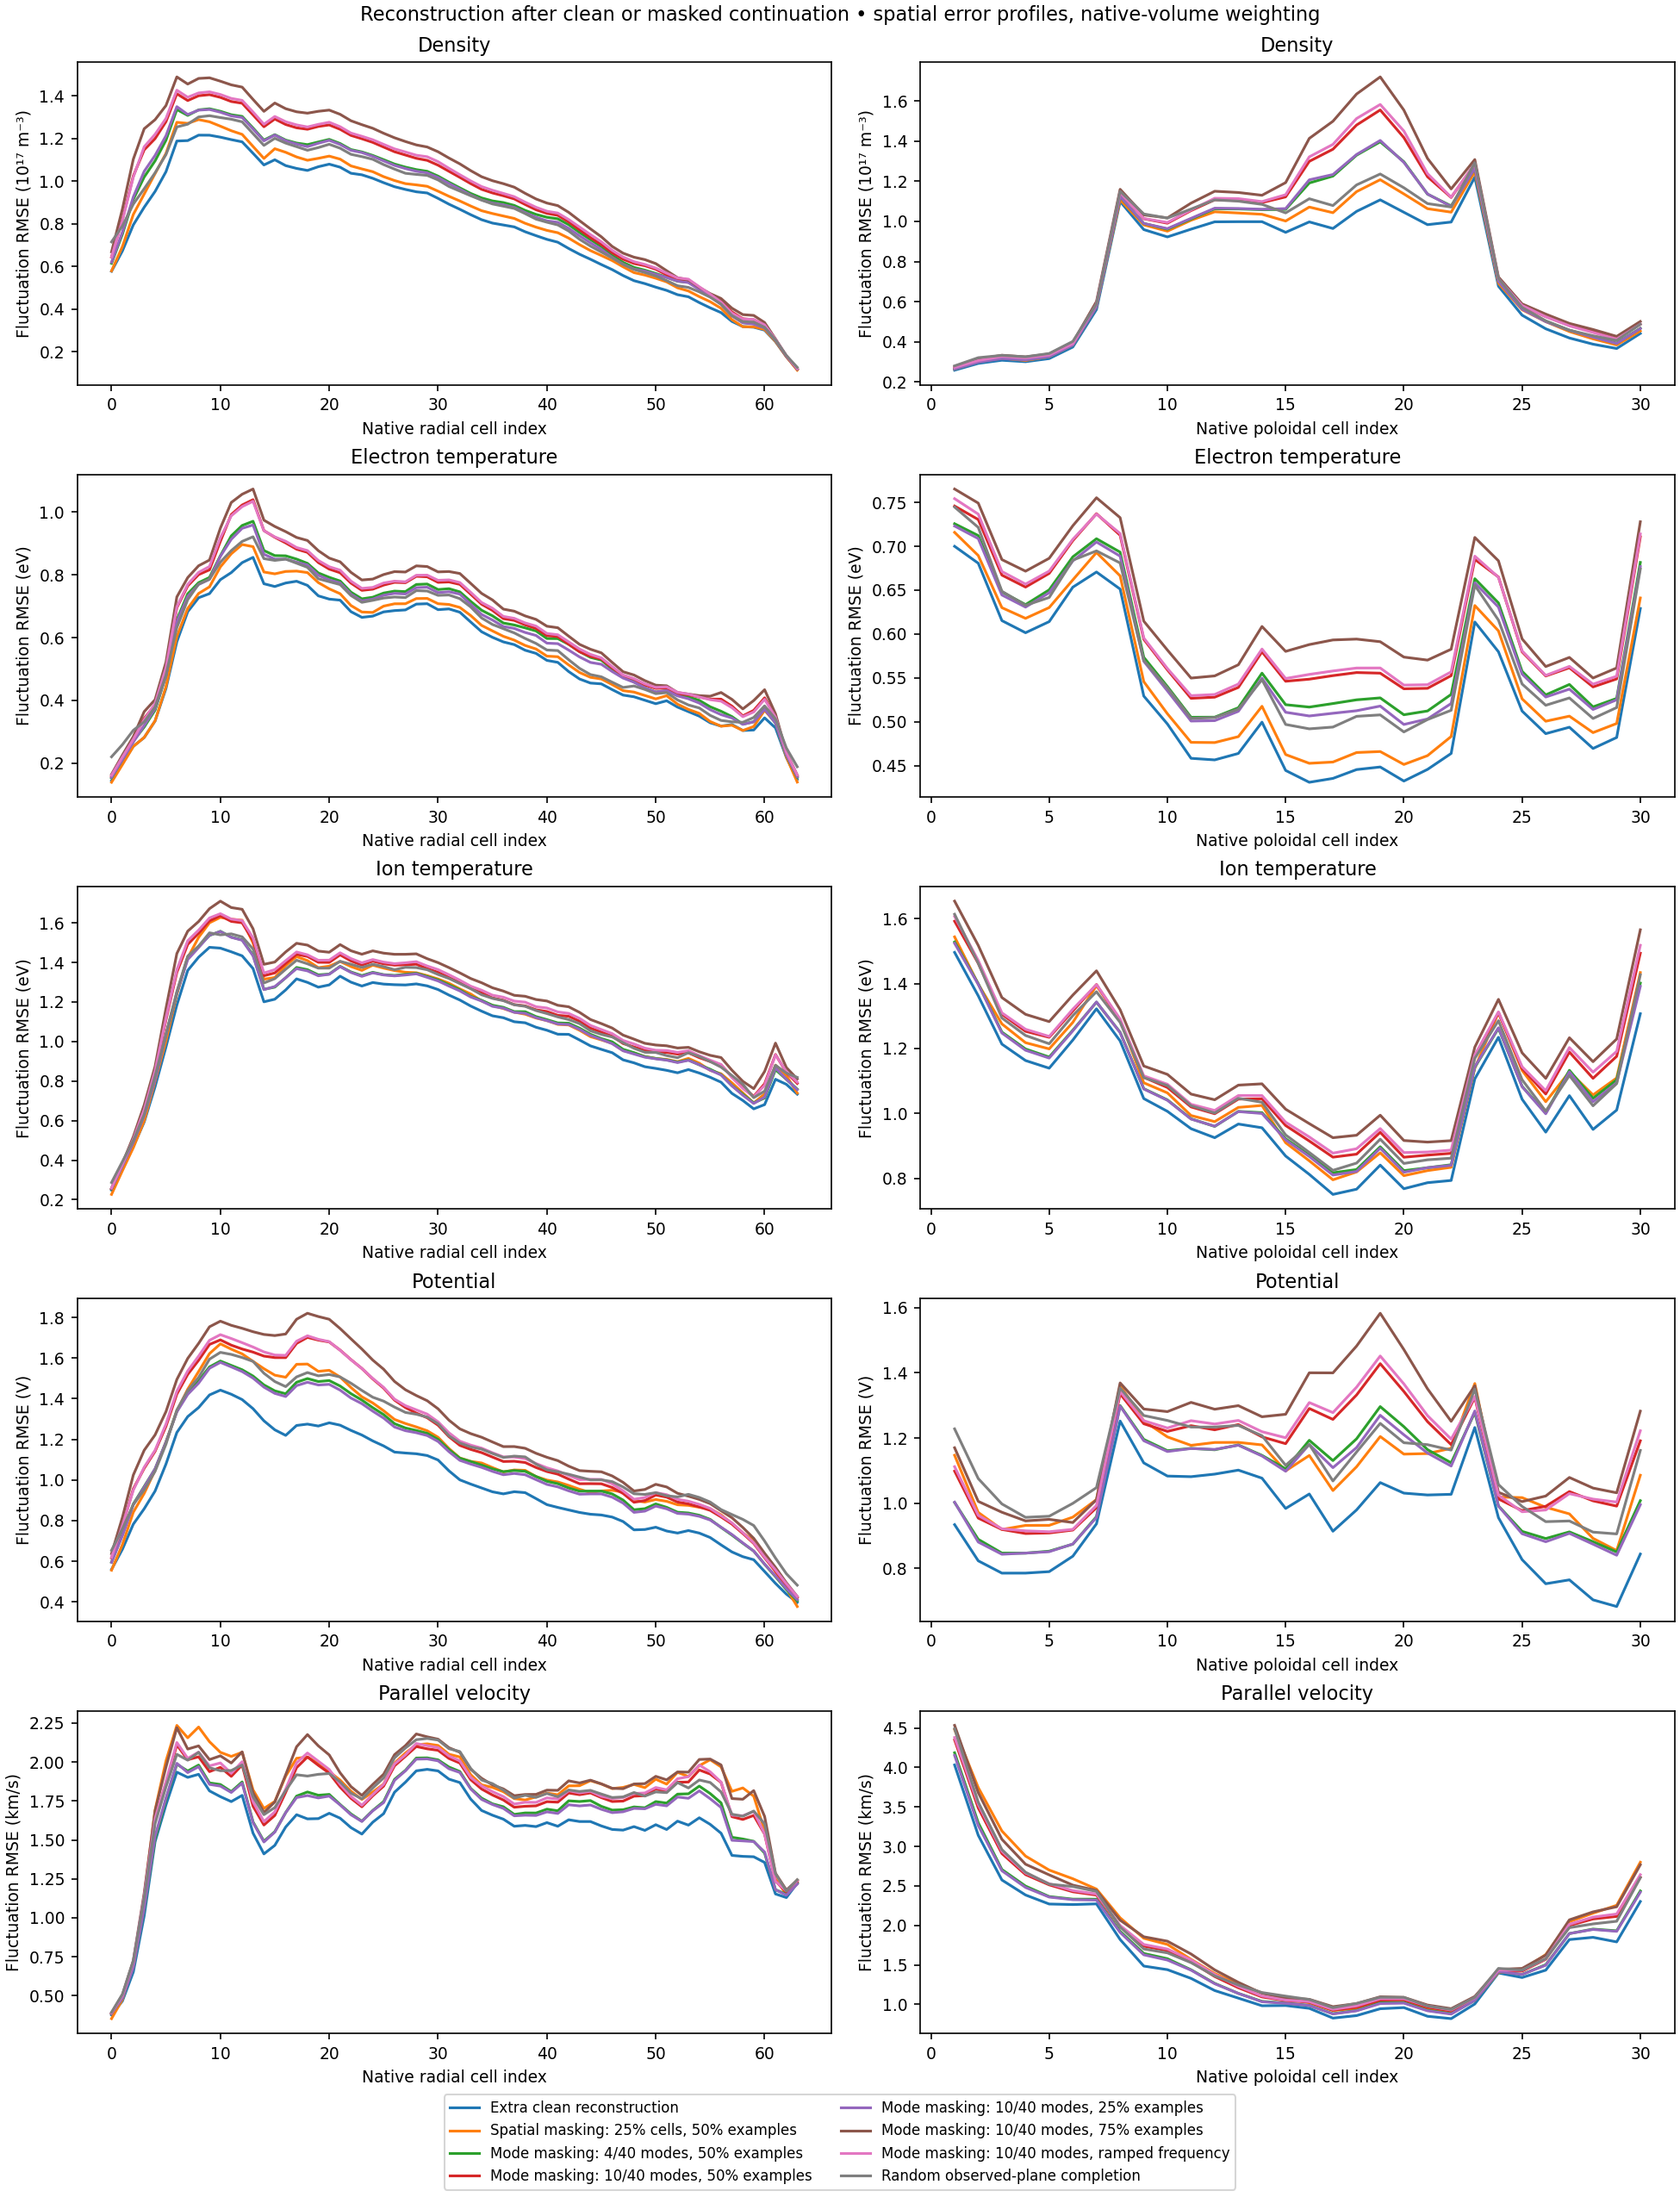
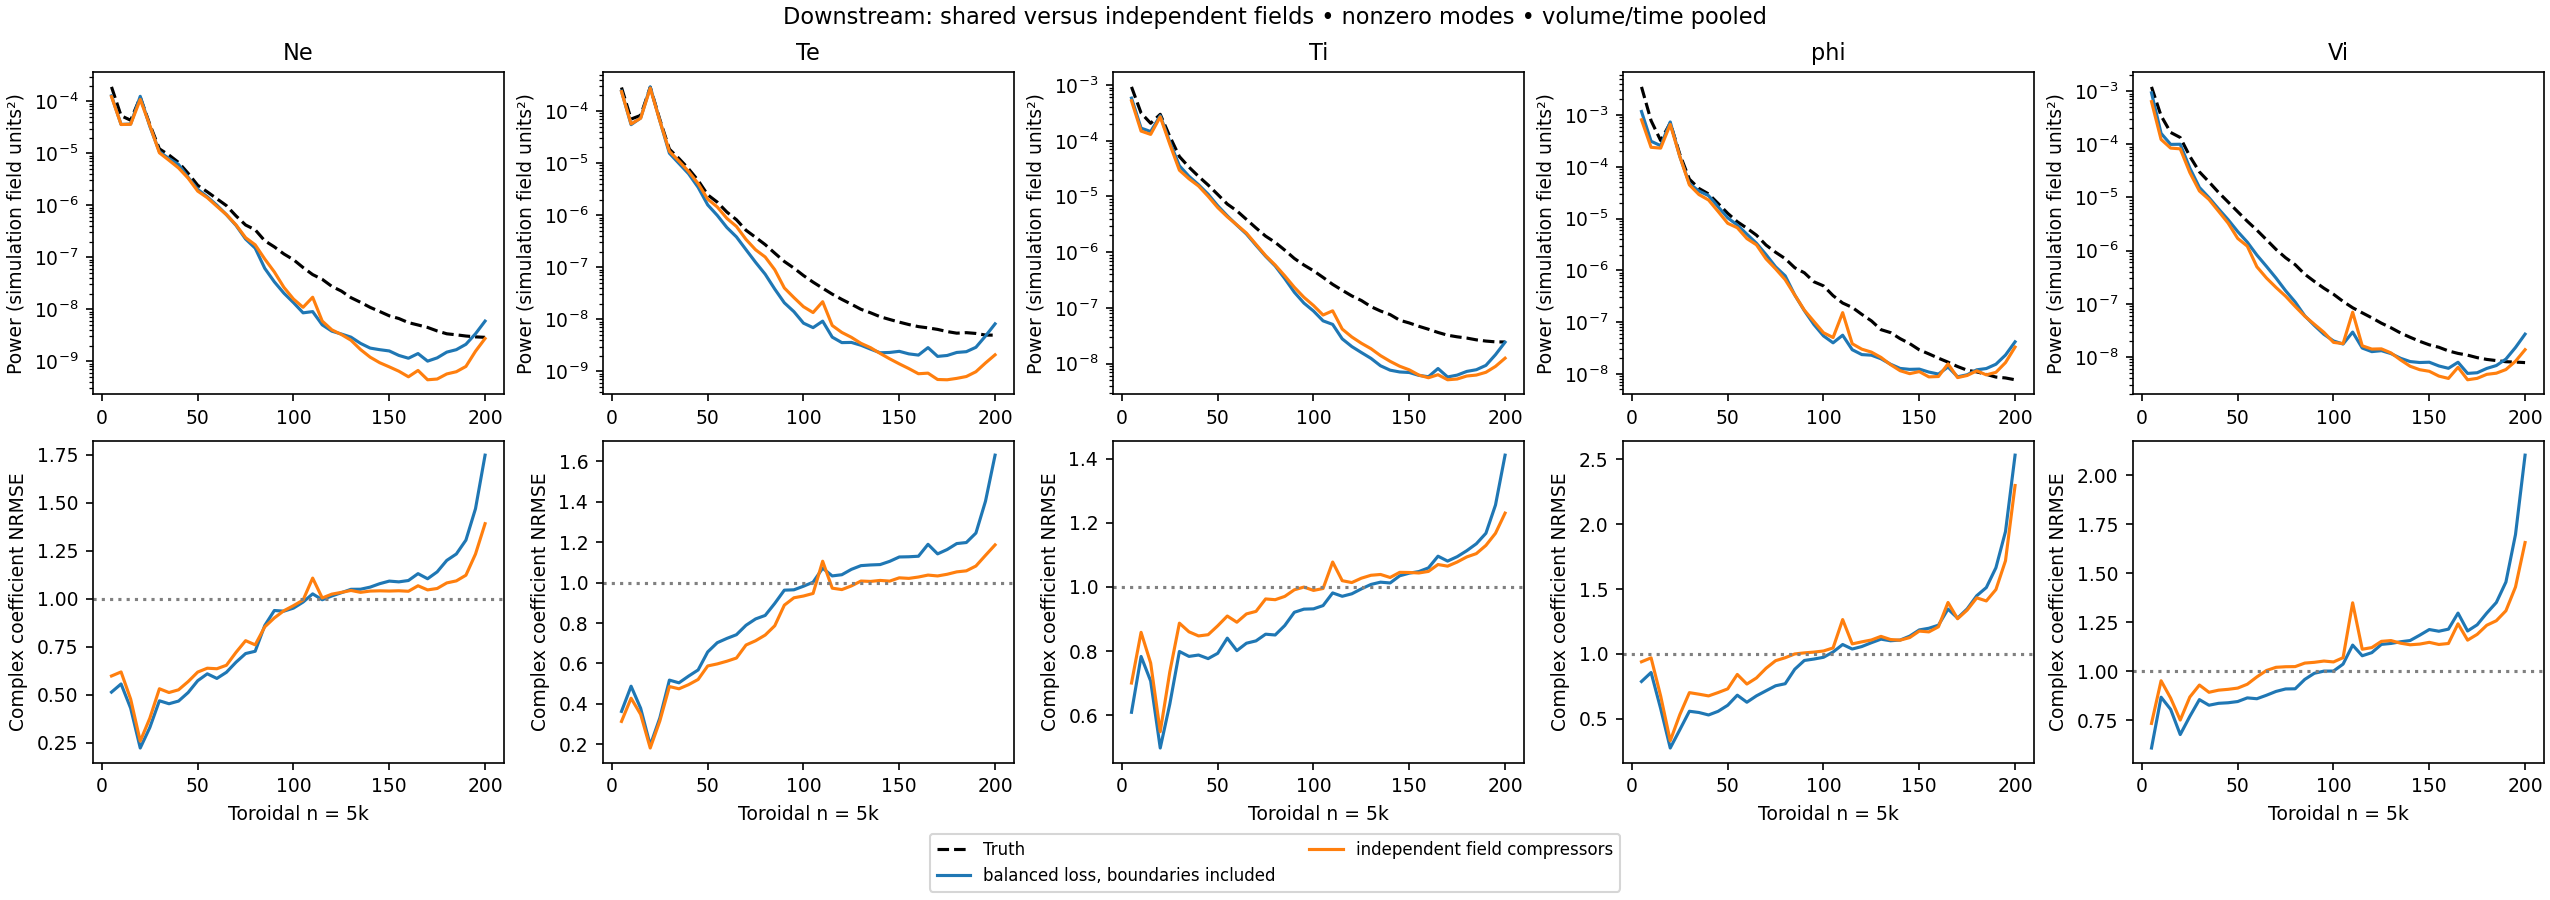
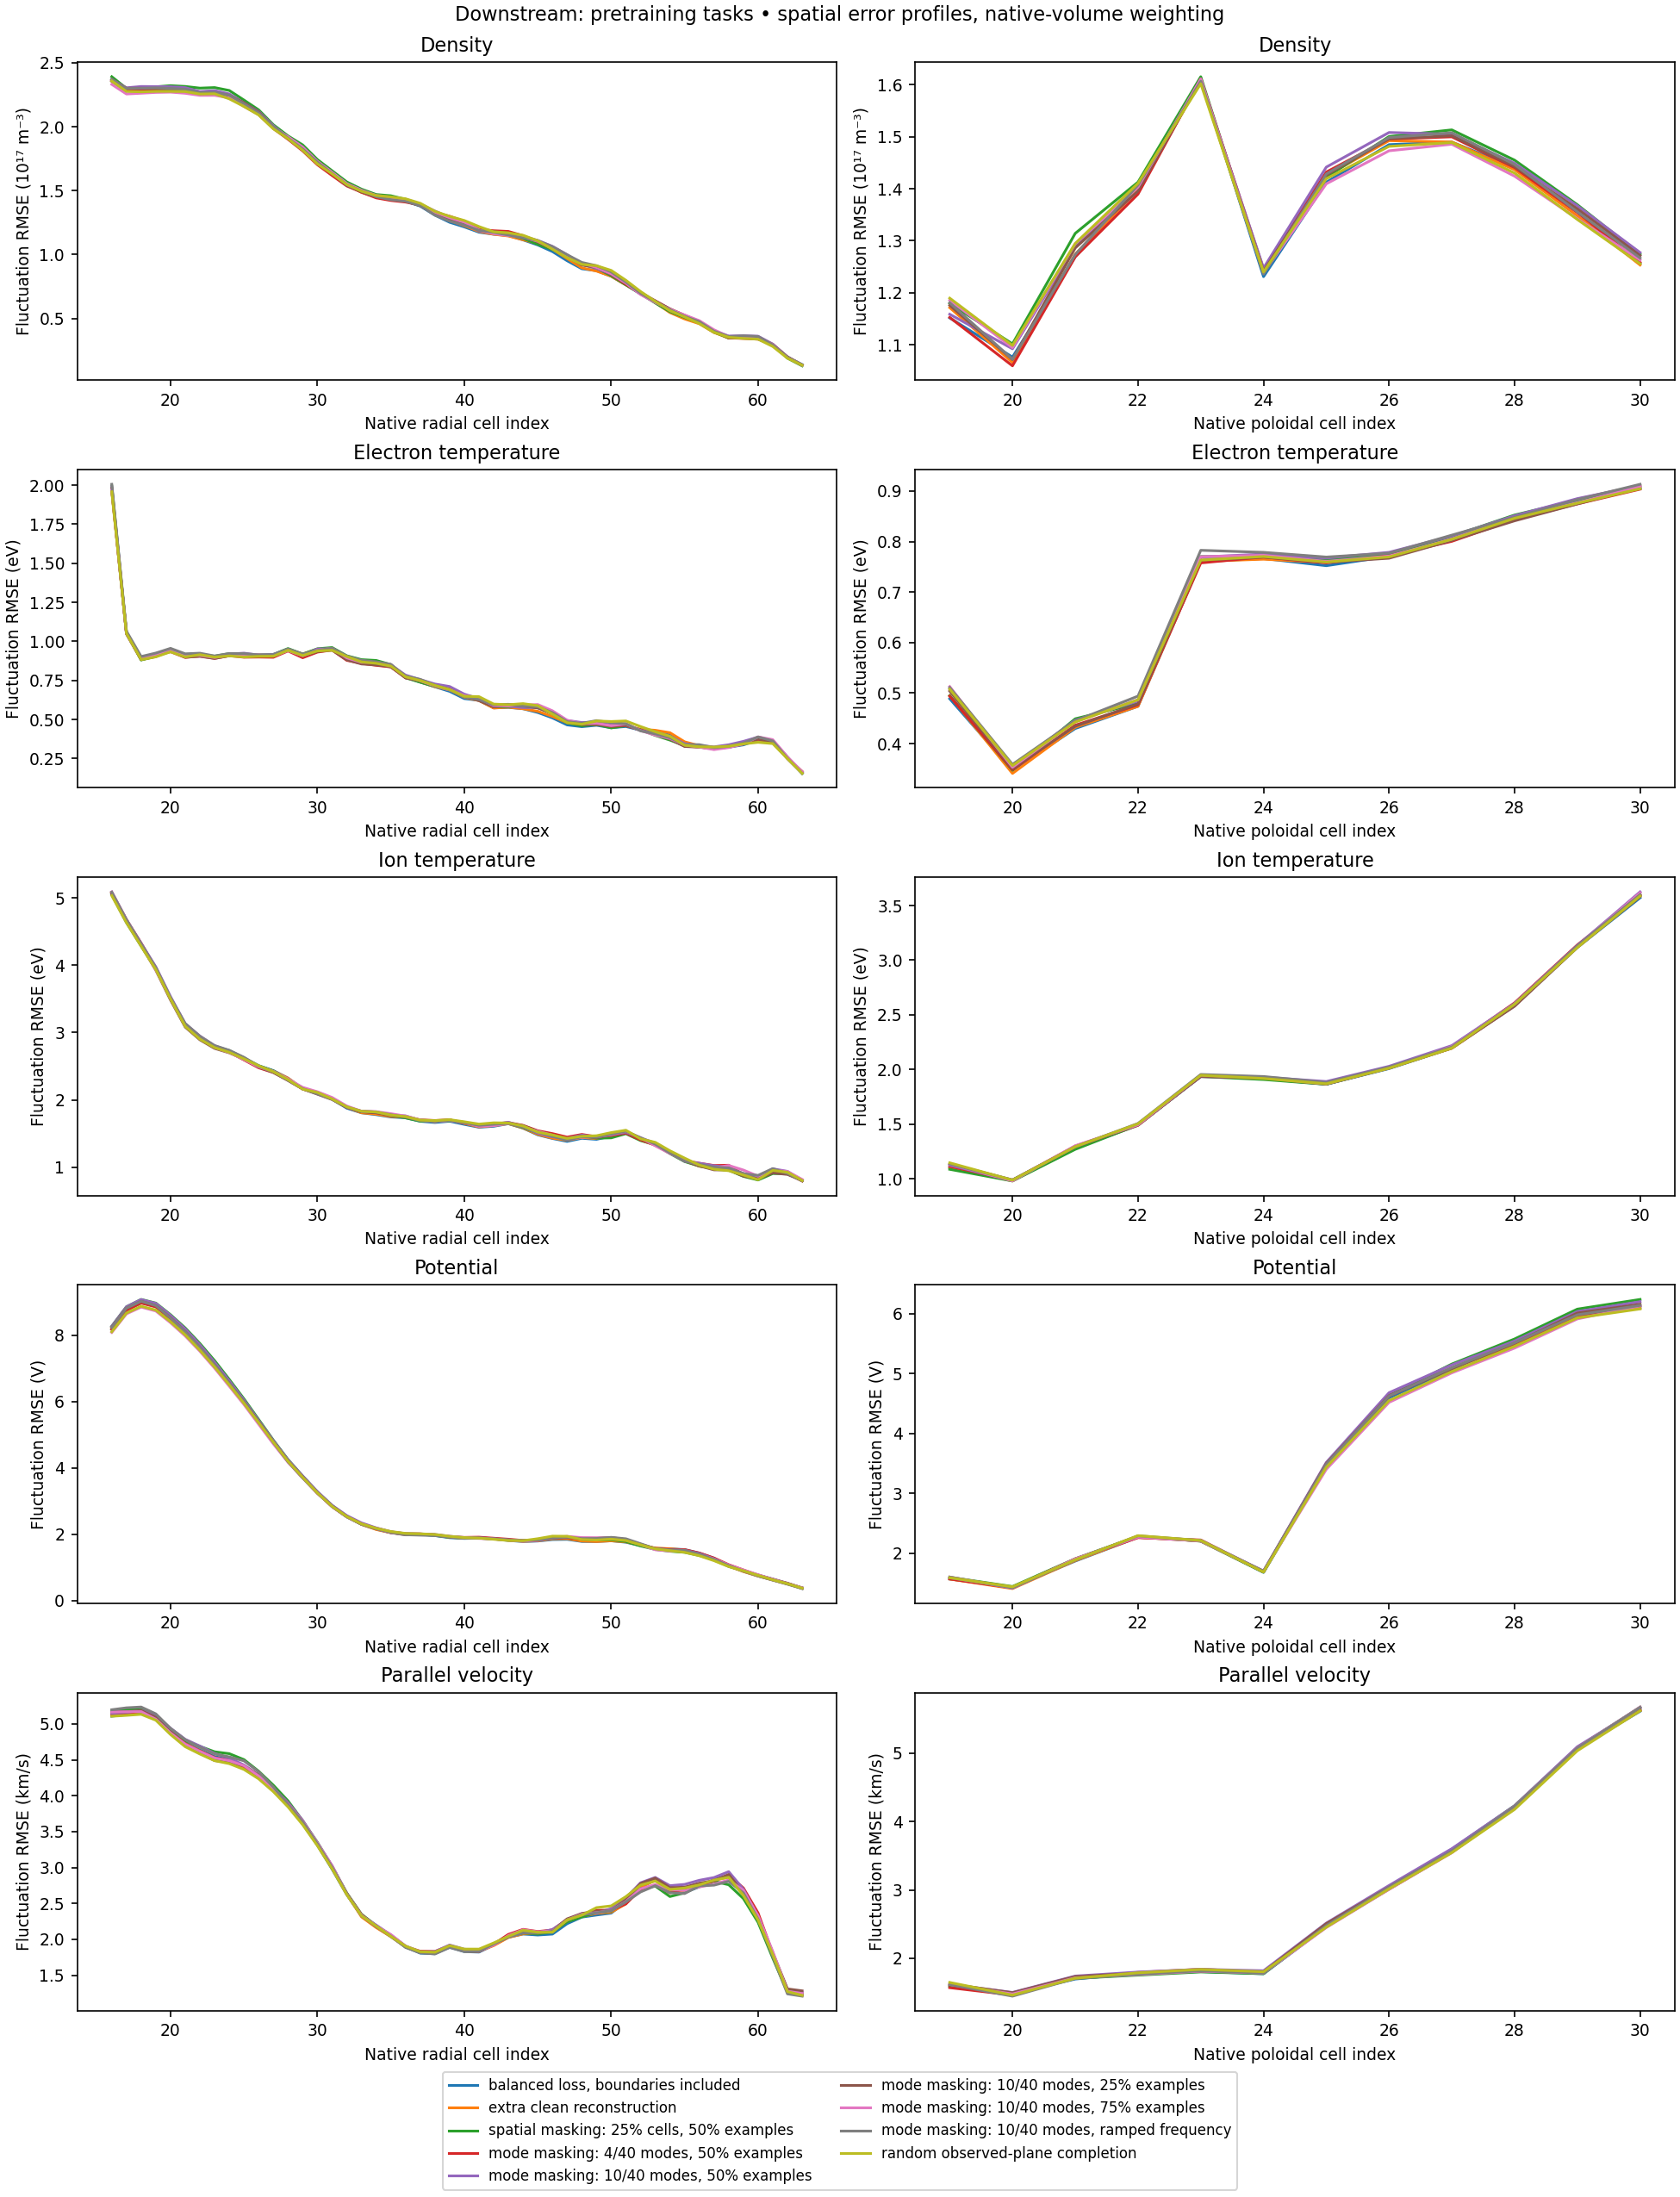
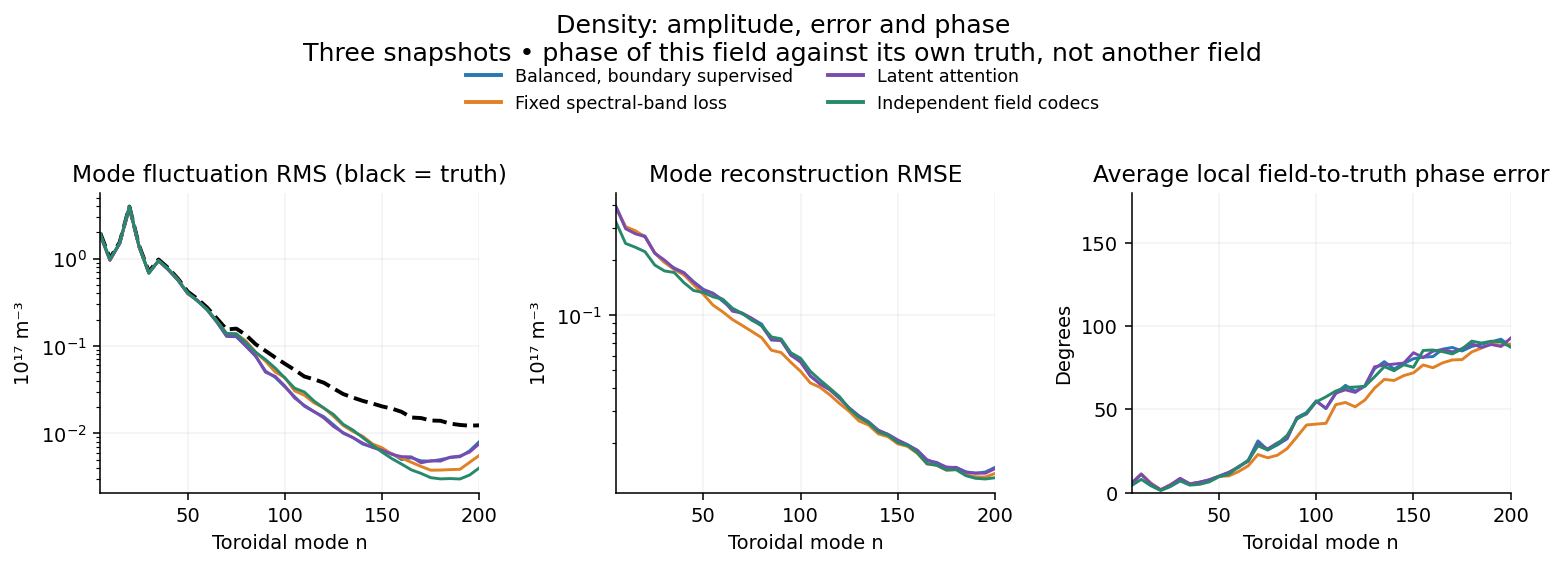
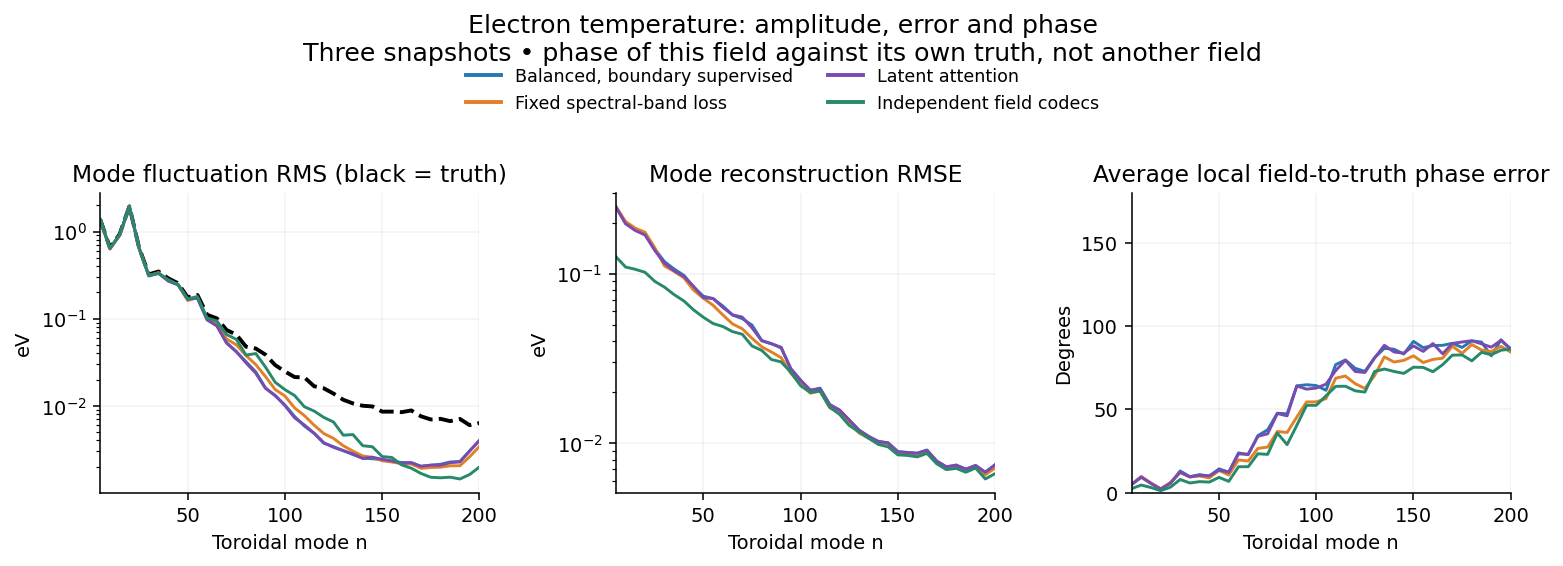
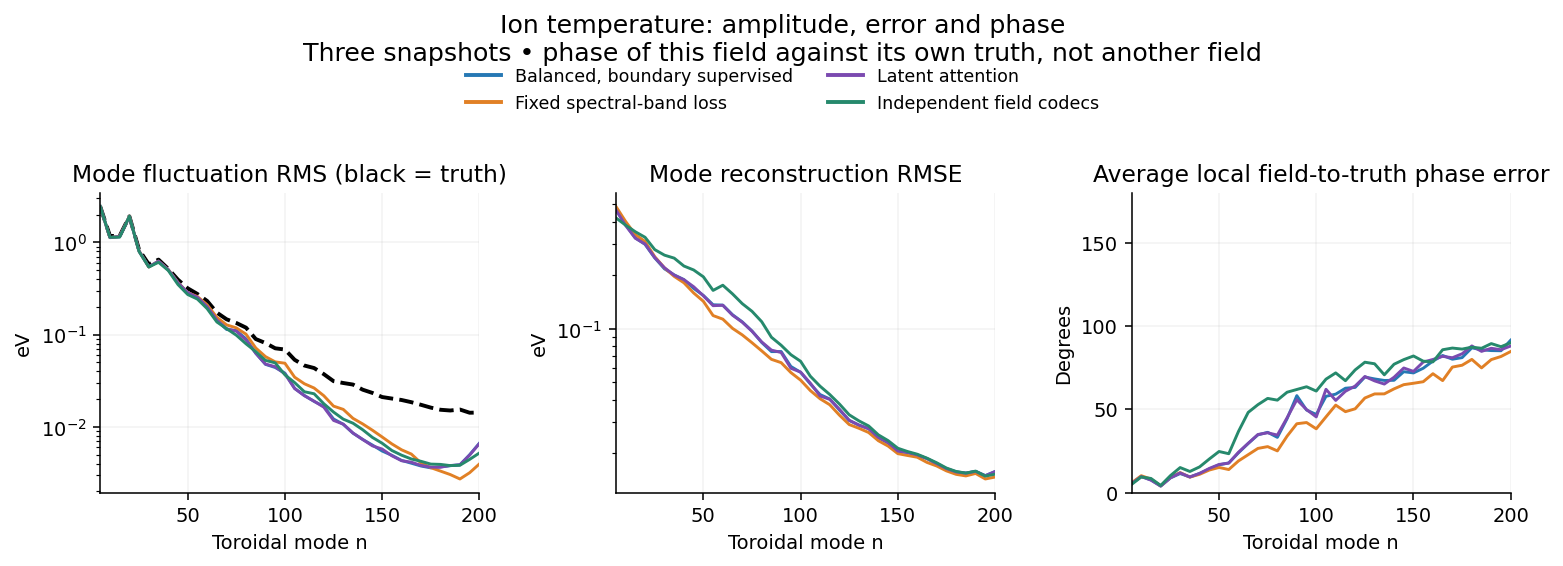
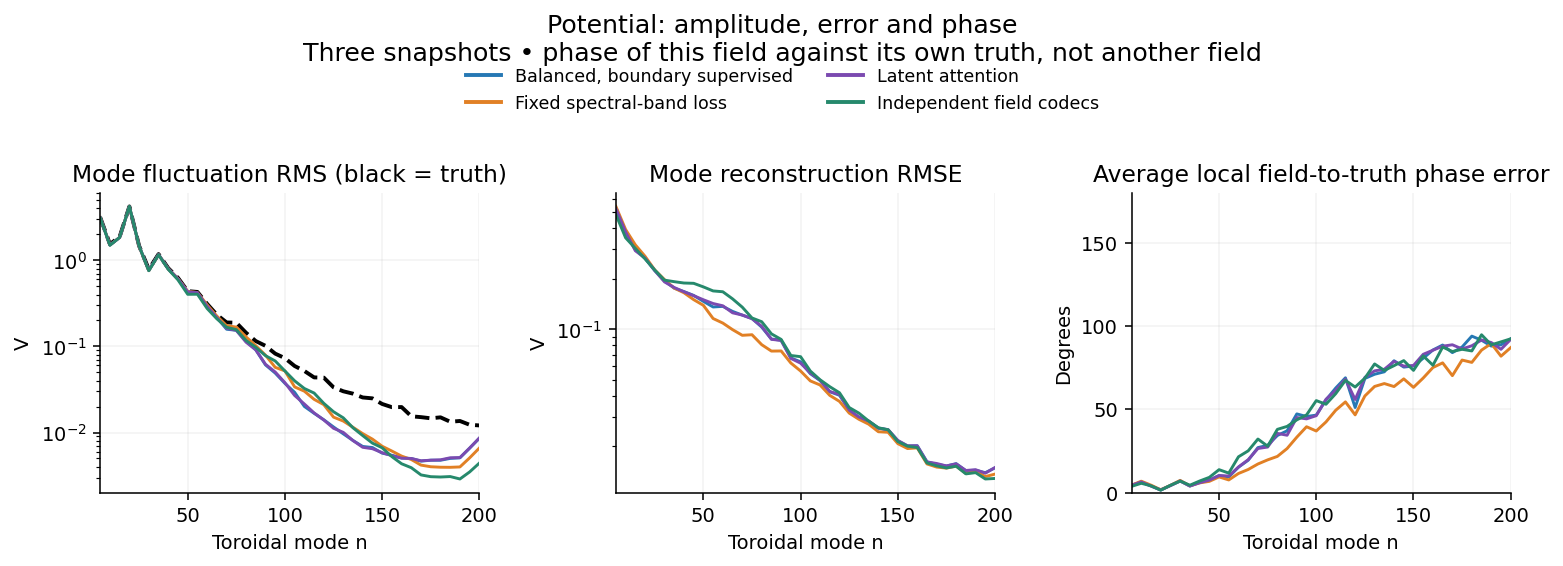
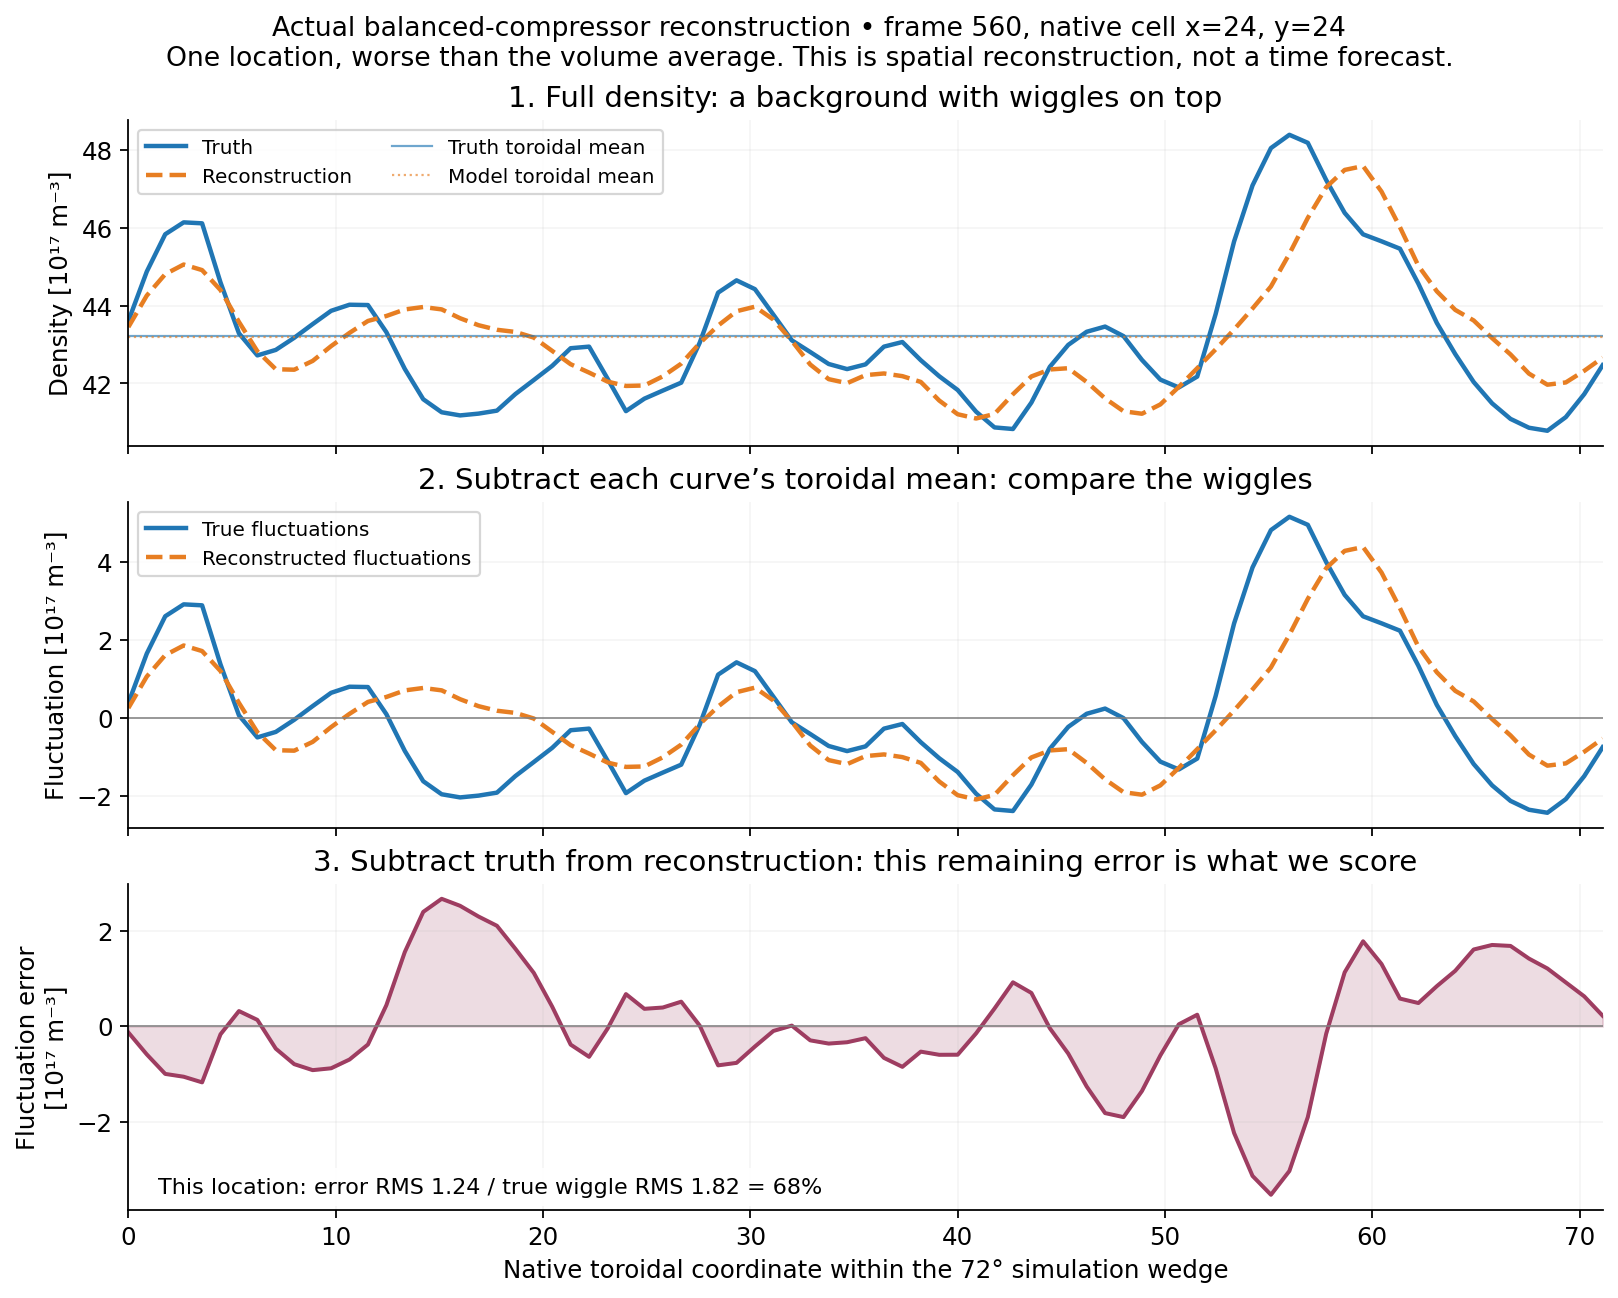
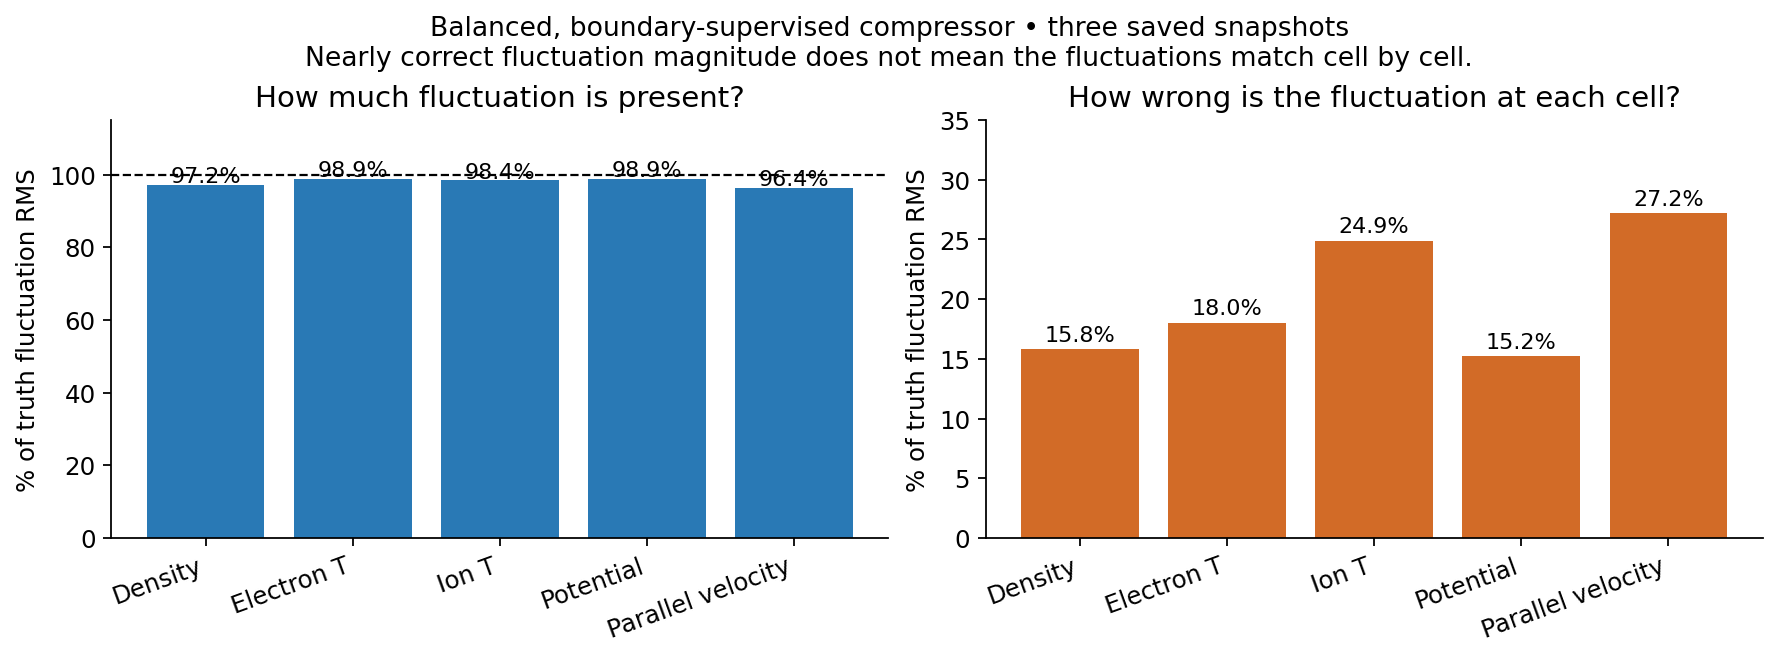
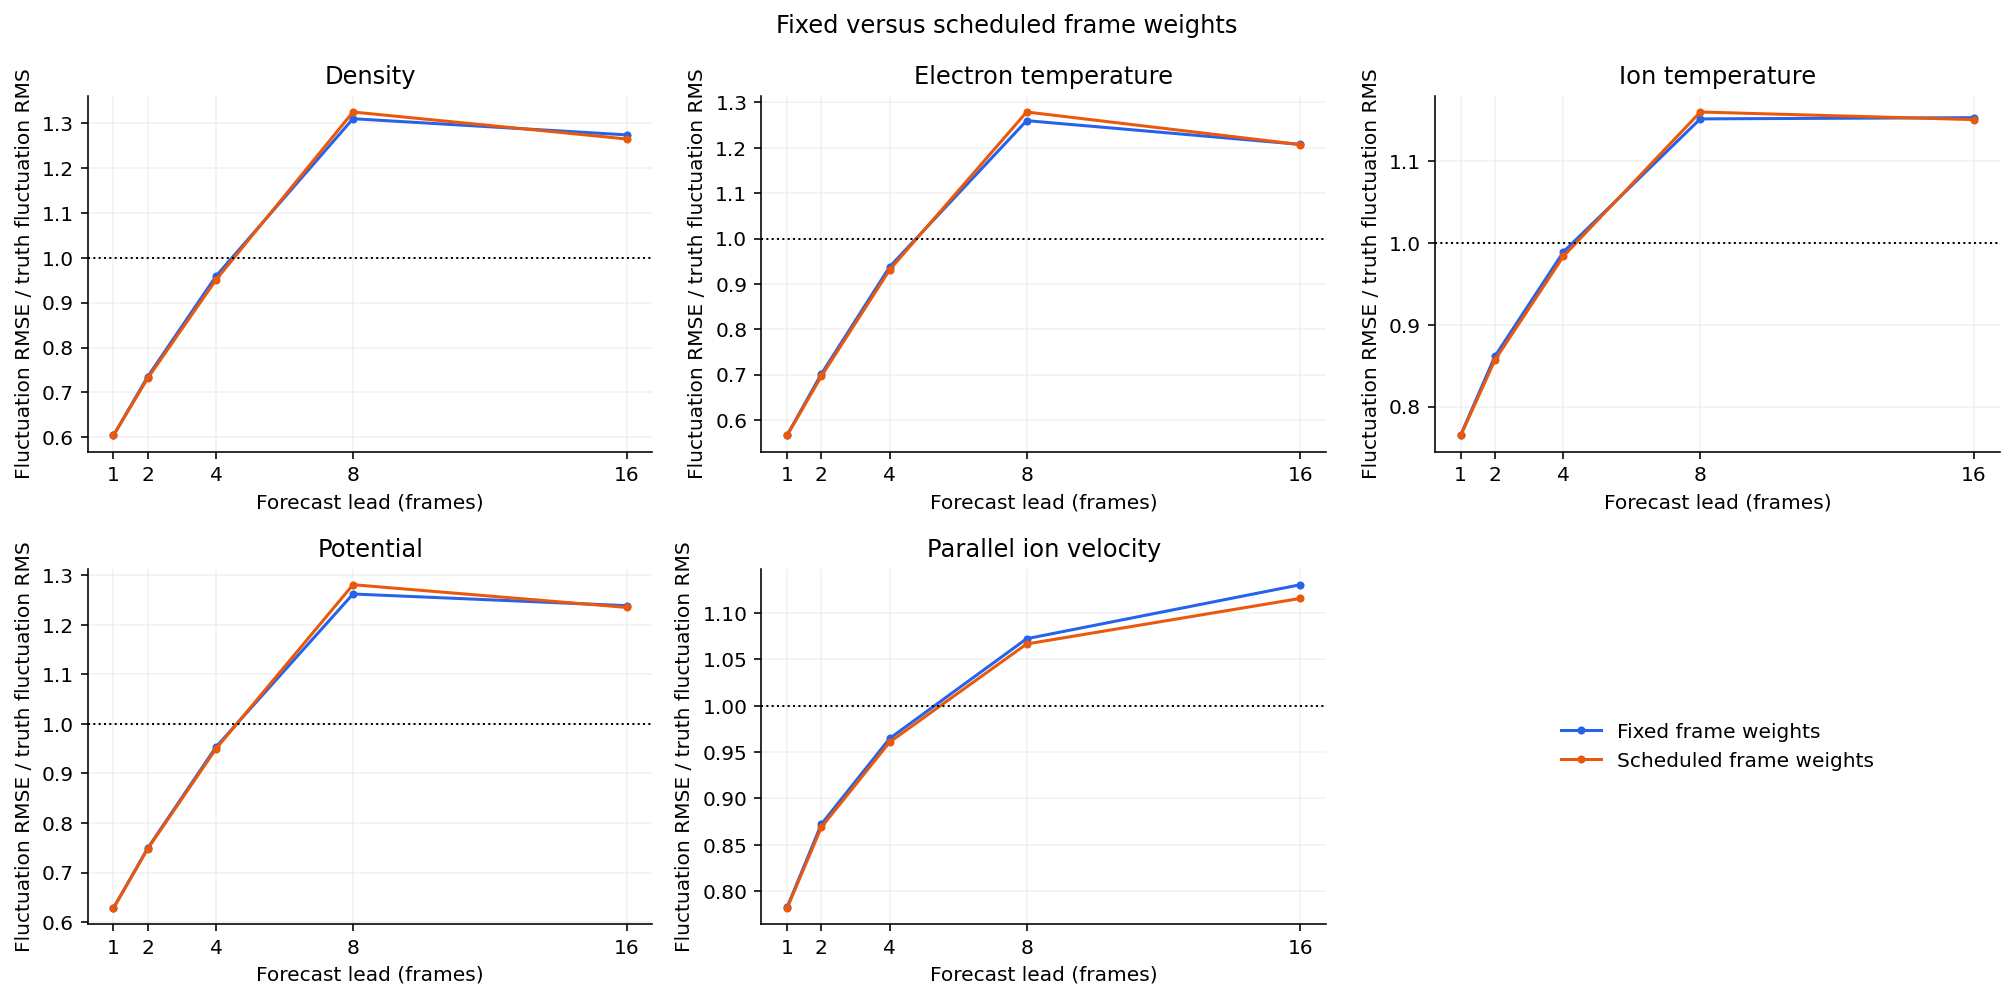
Mean/fluctuation weighting improved the reference compressor; spectra alone hid local errors.
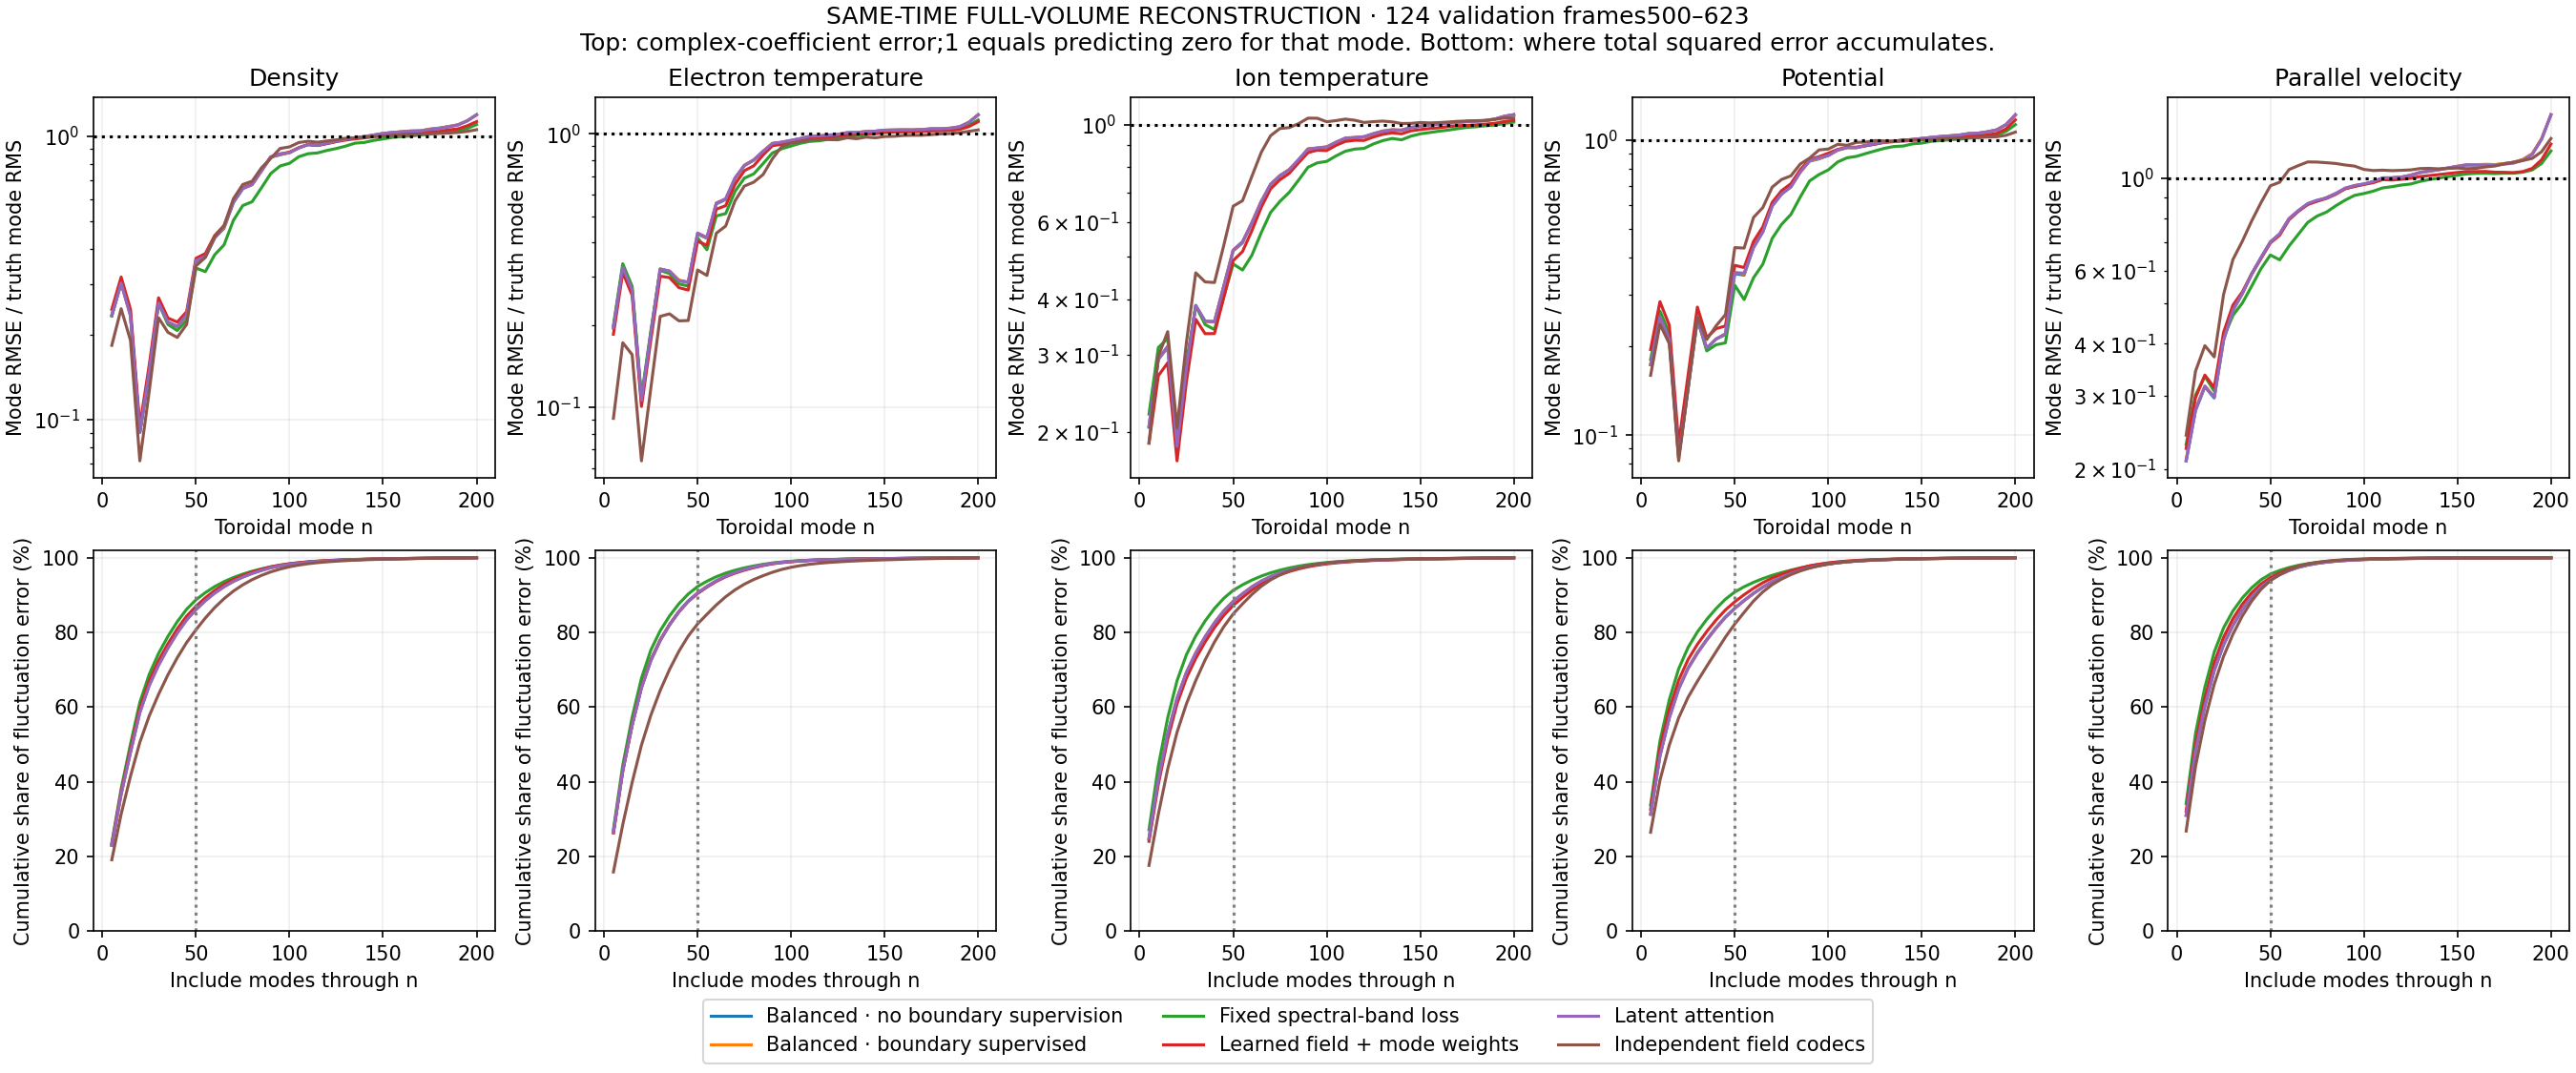
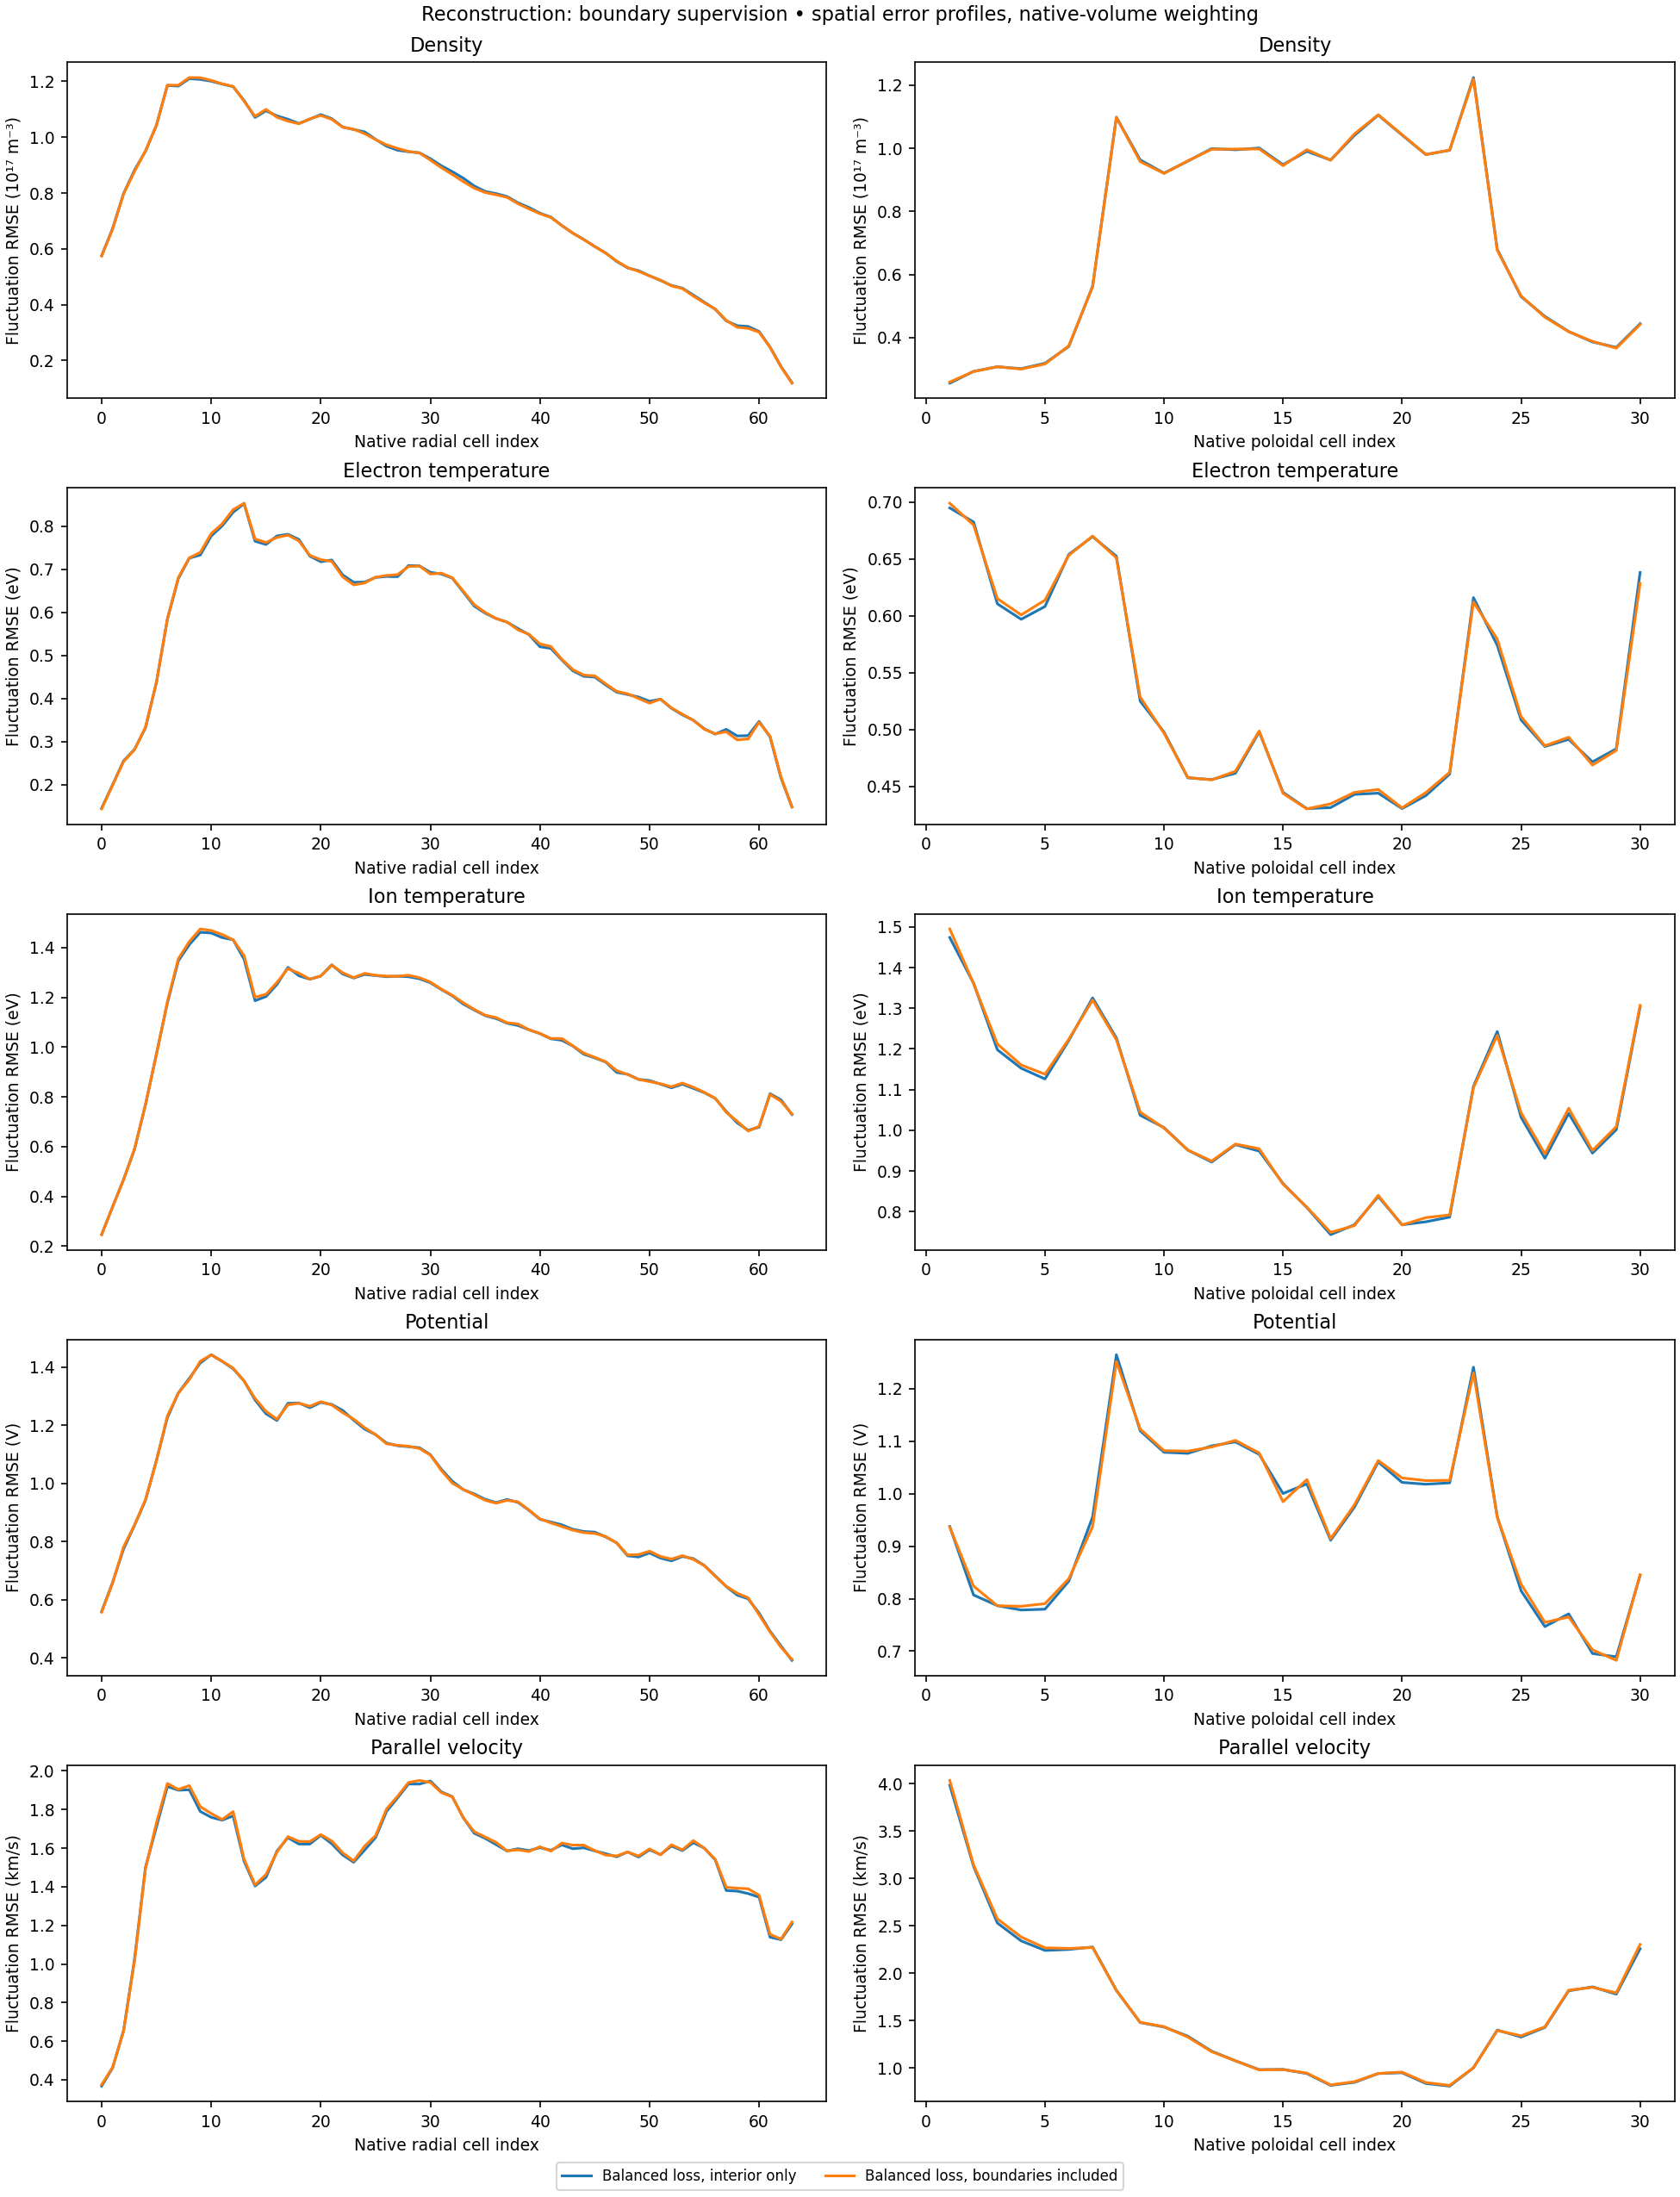
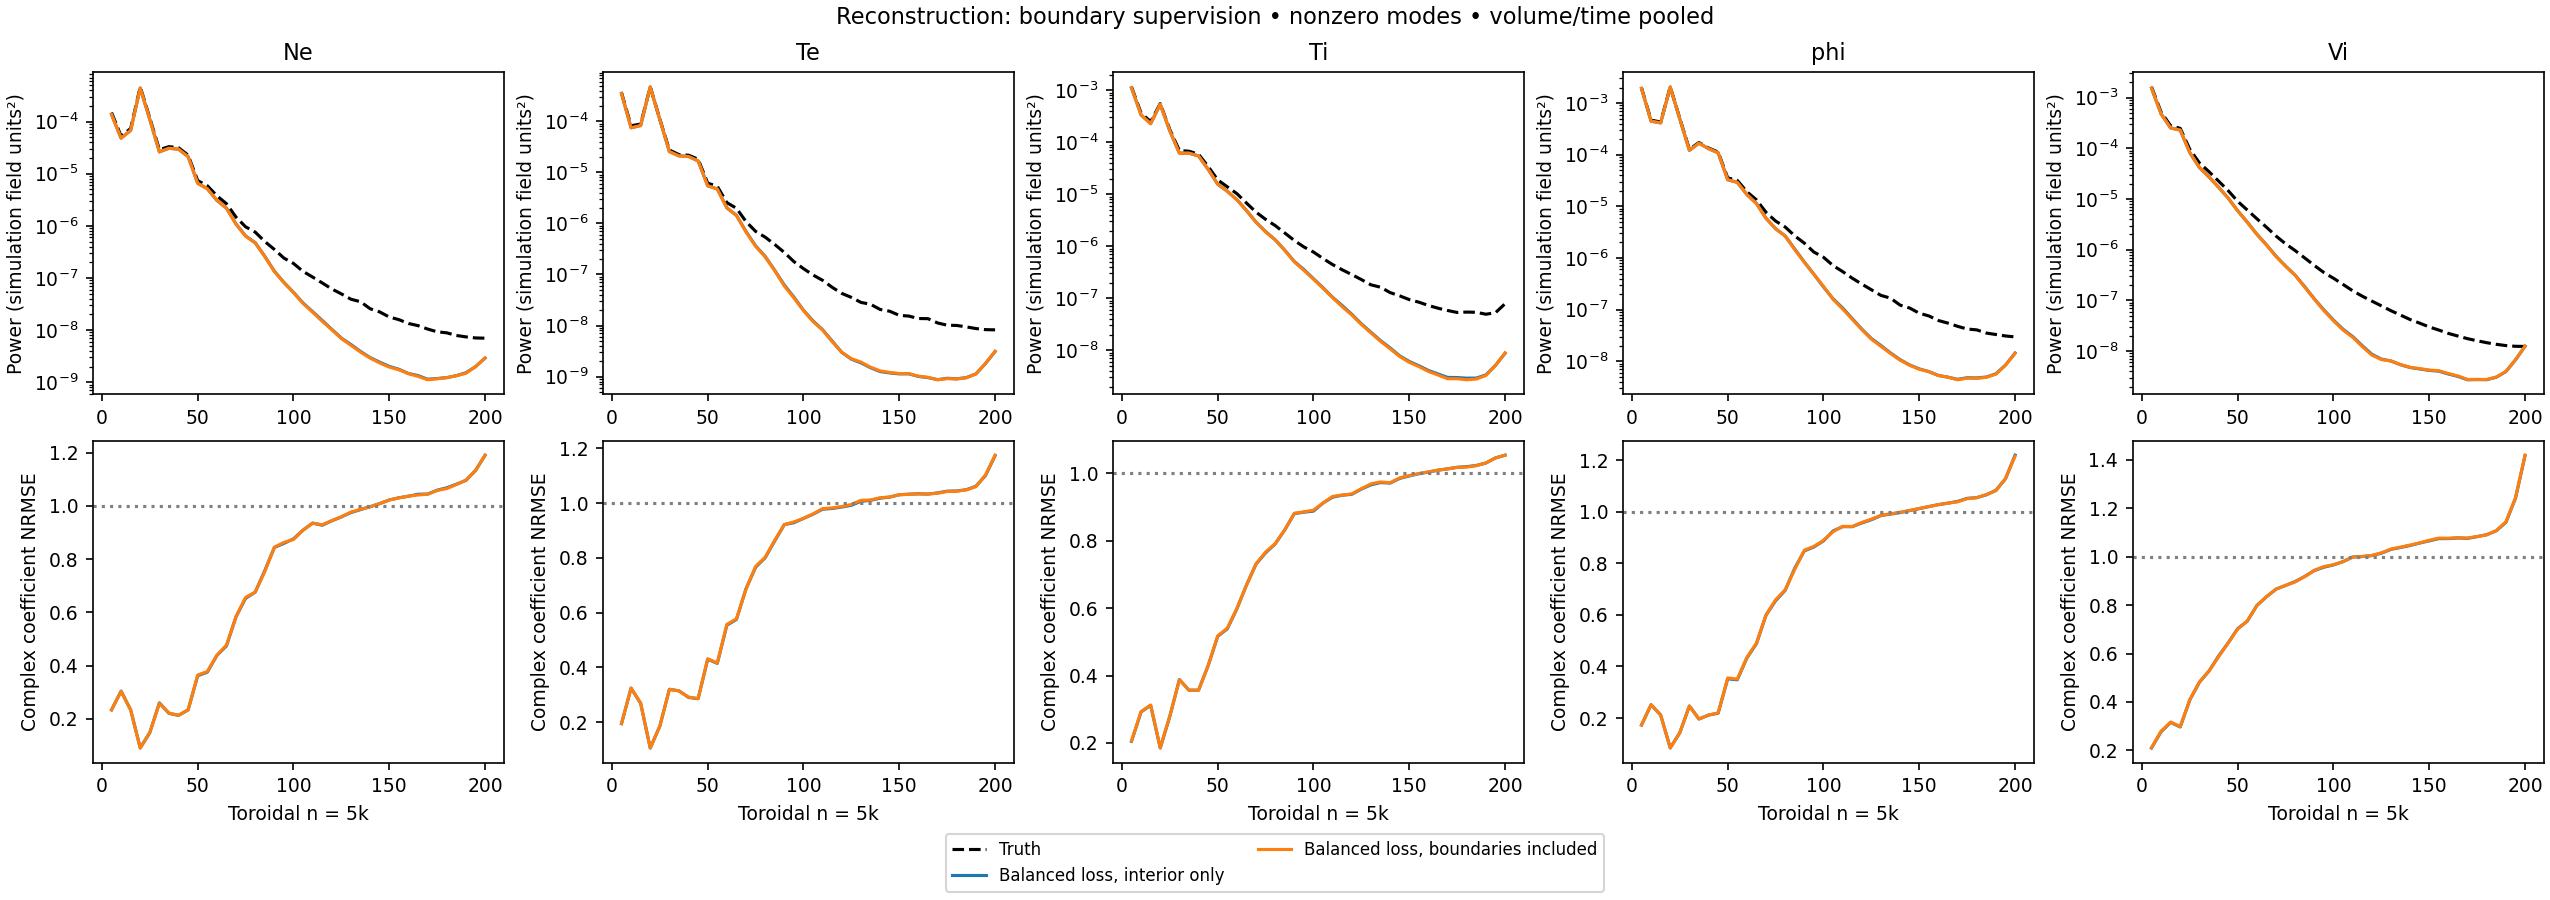
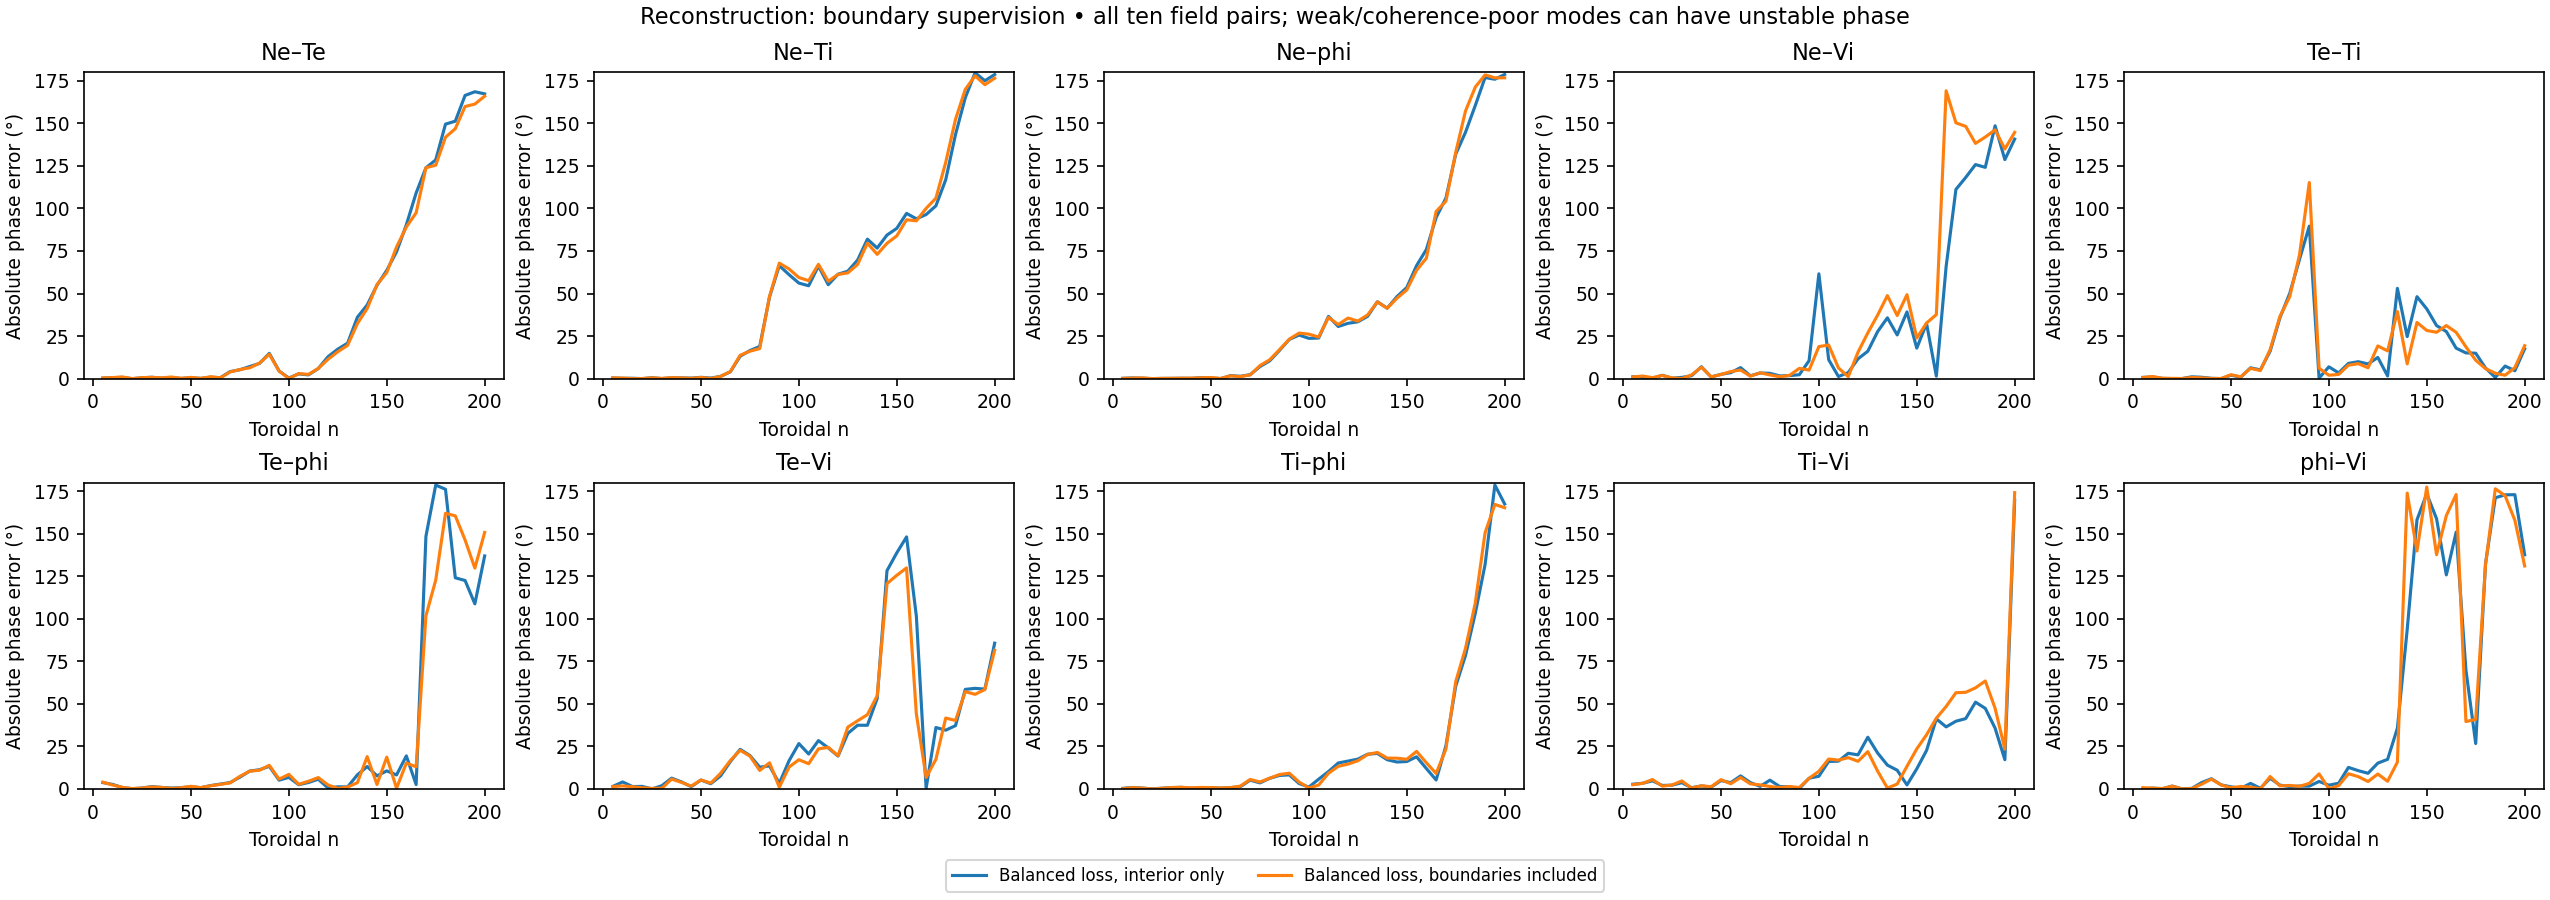
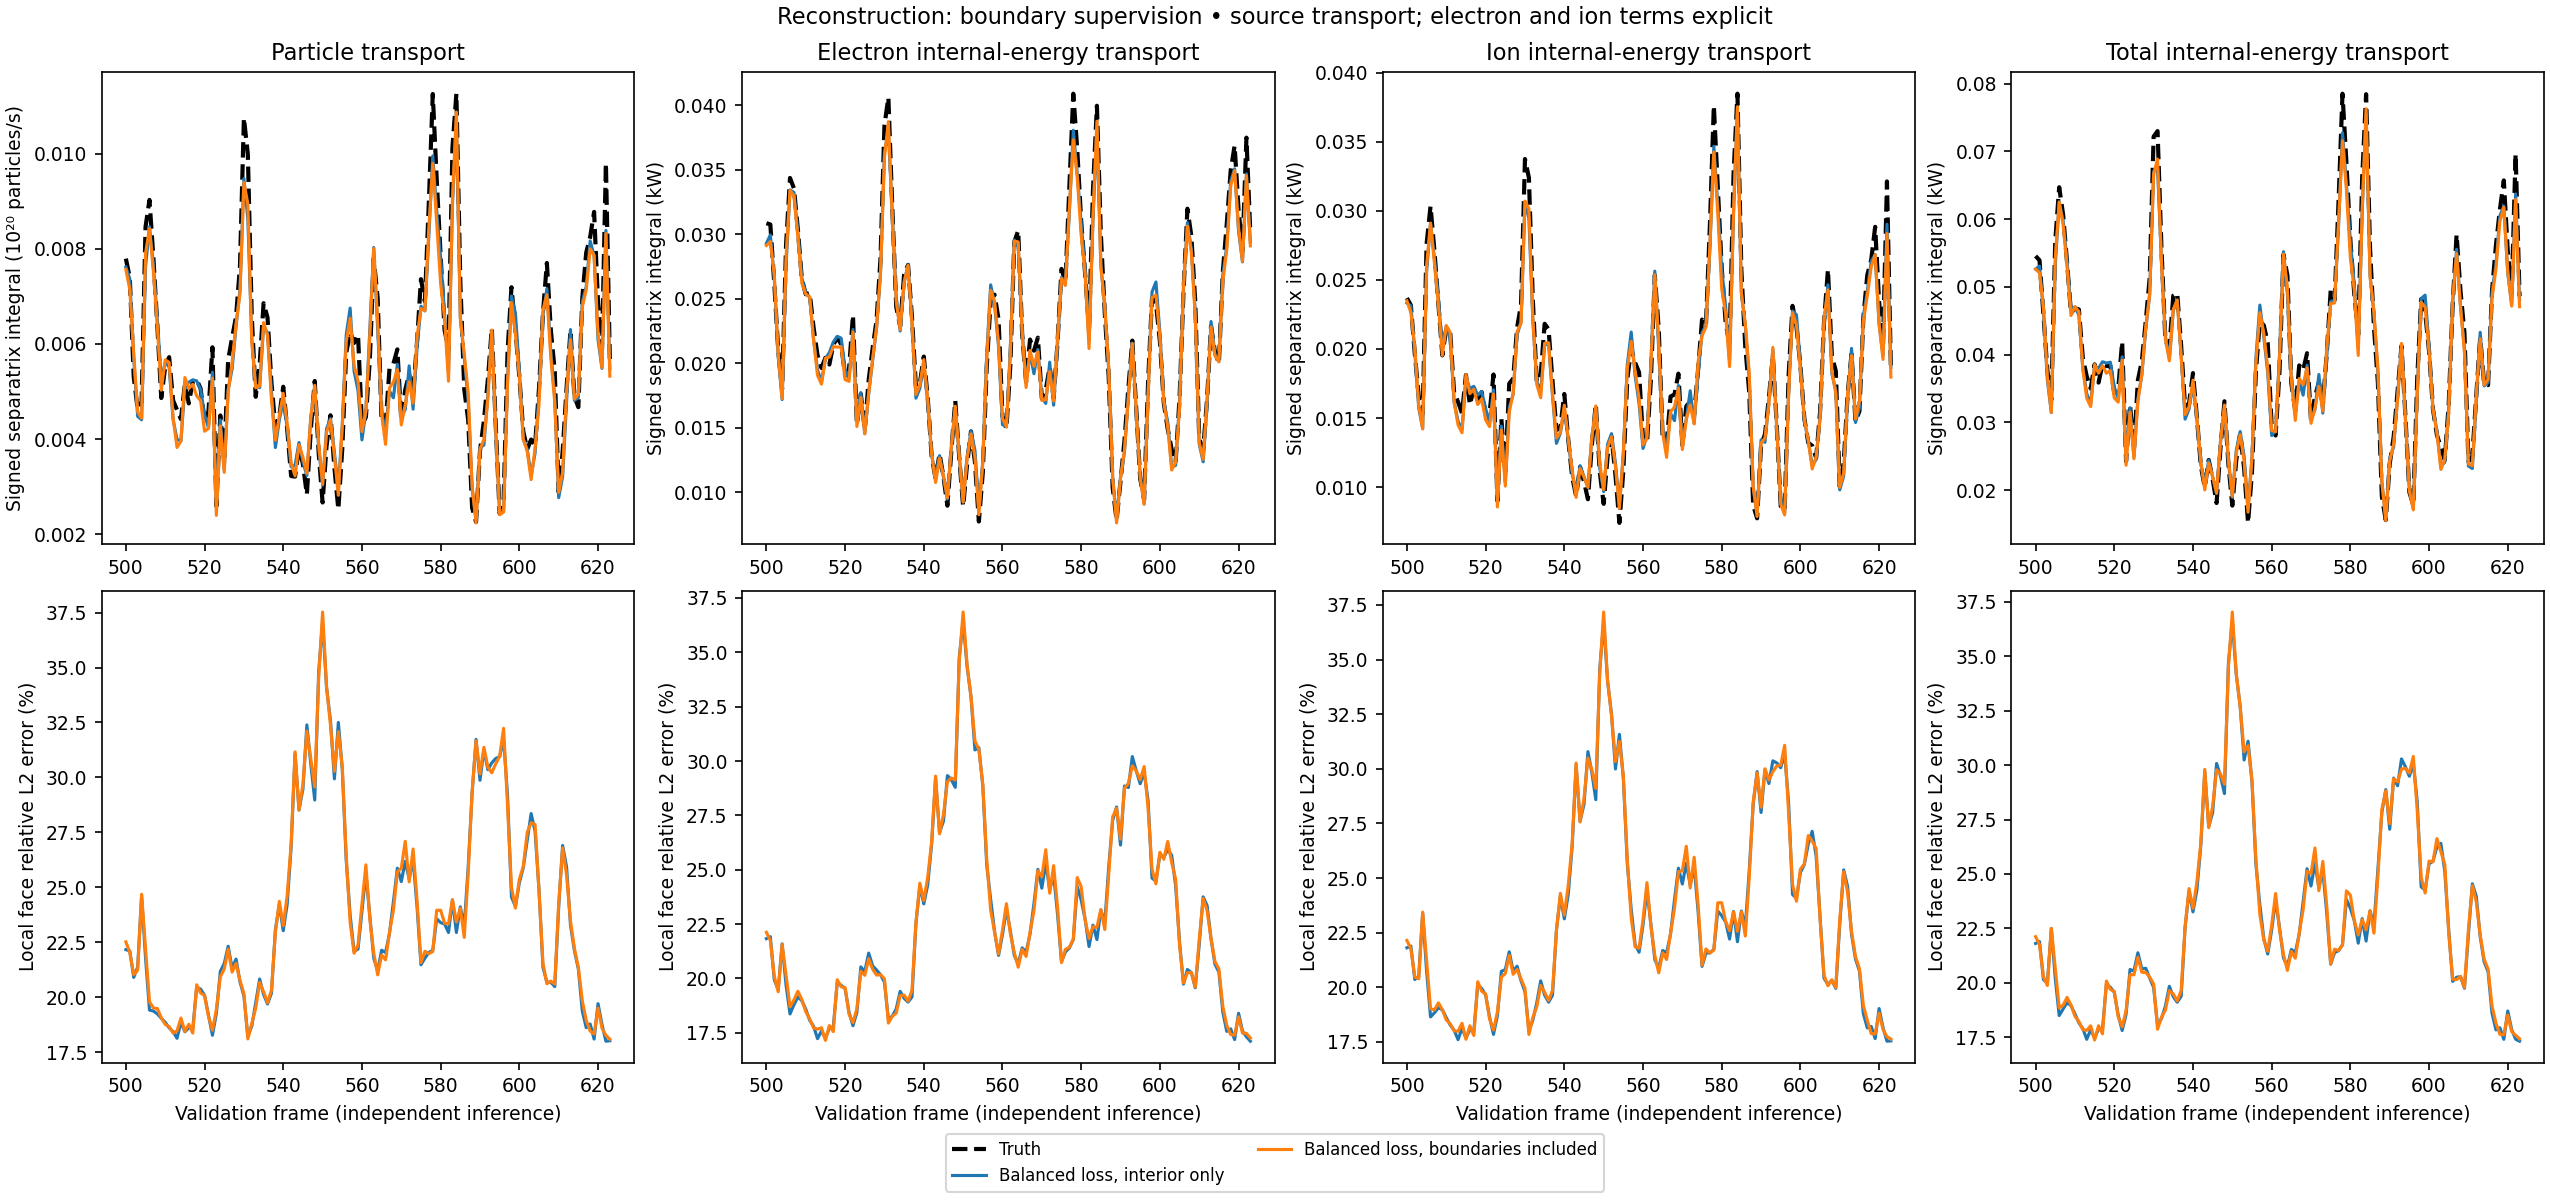
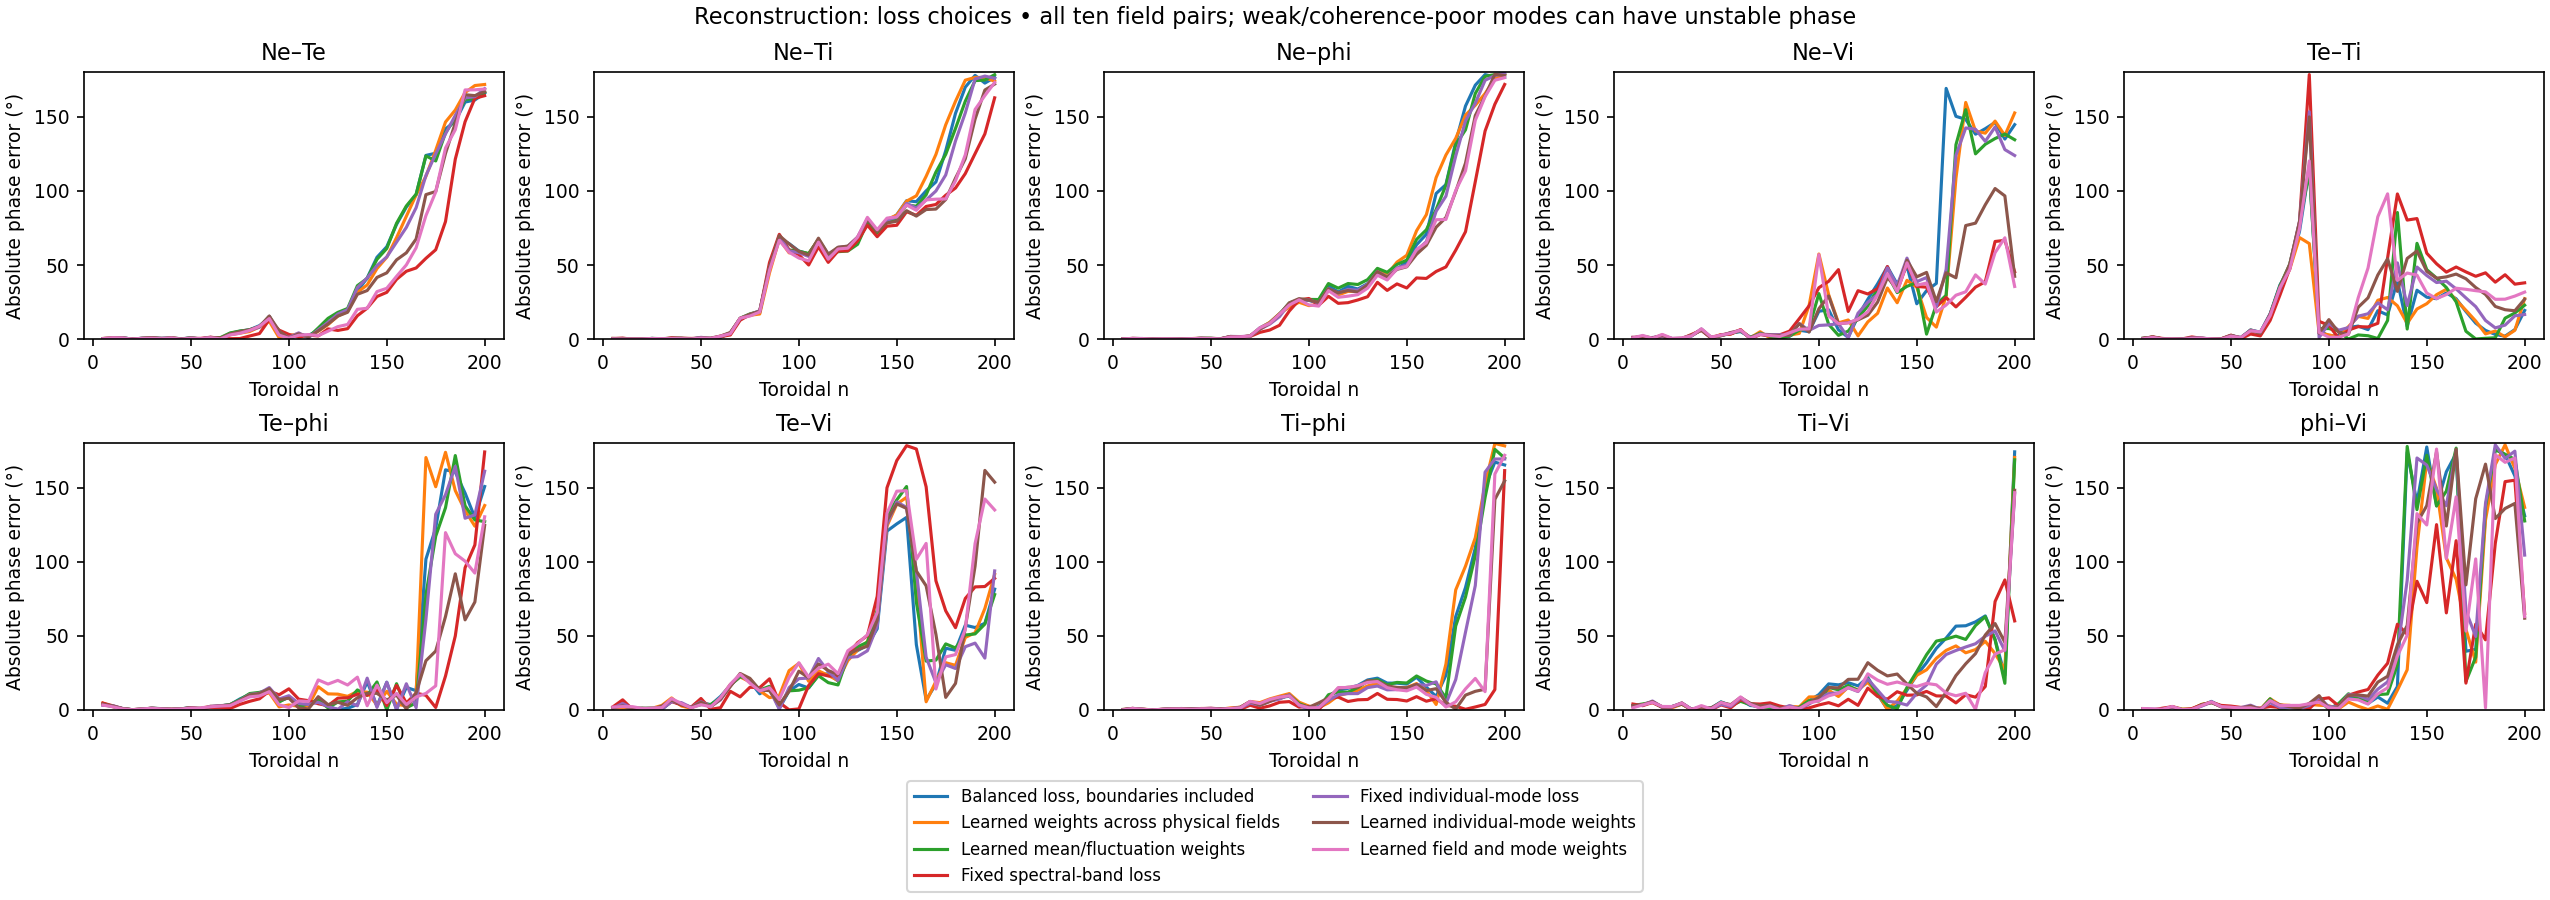
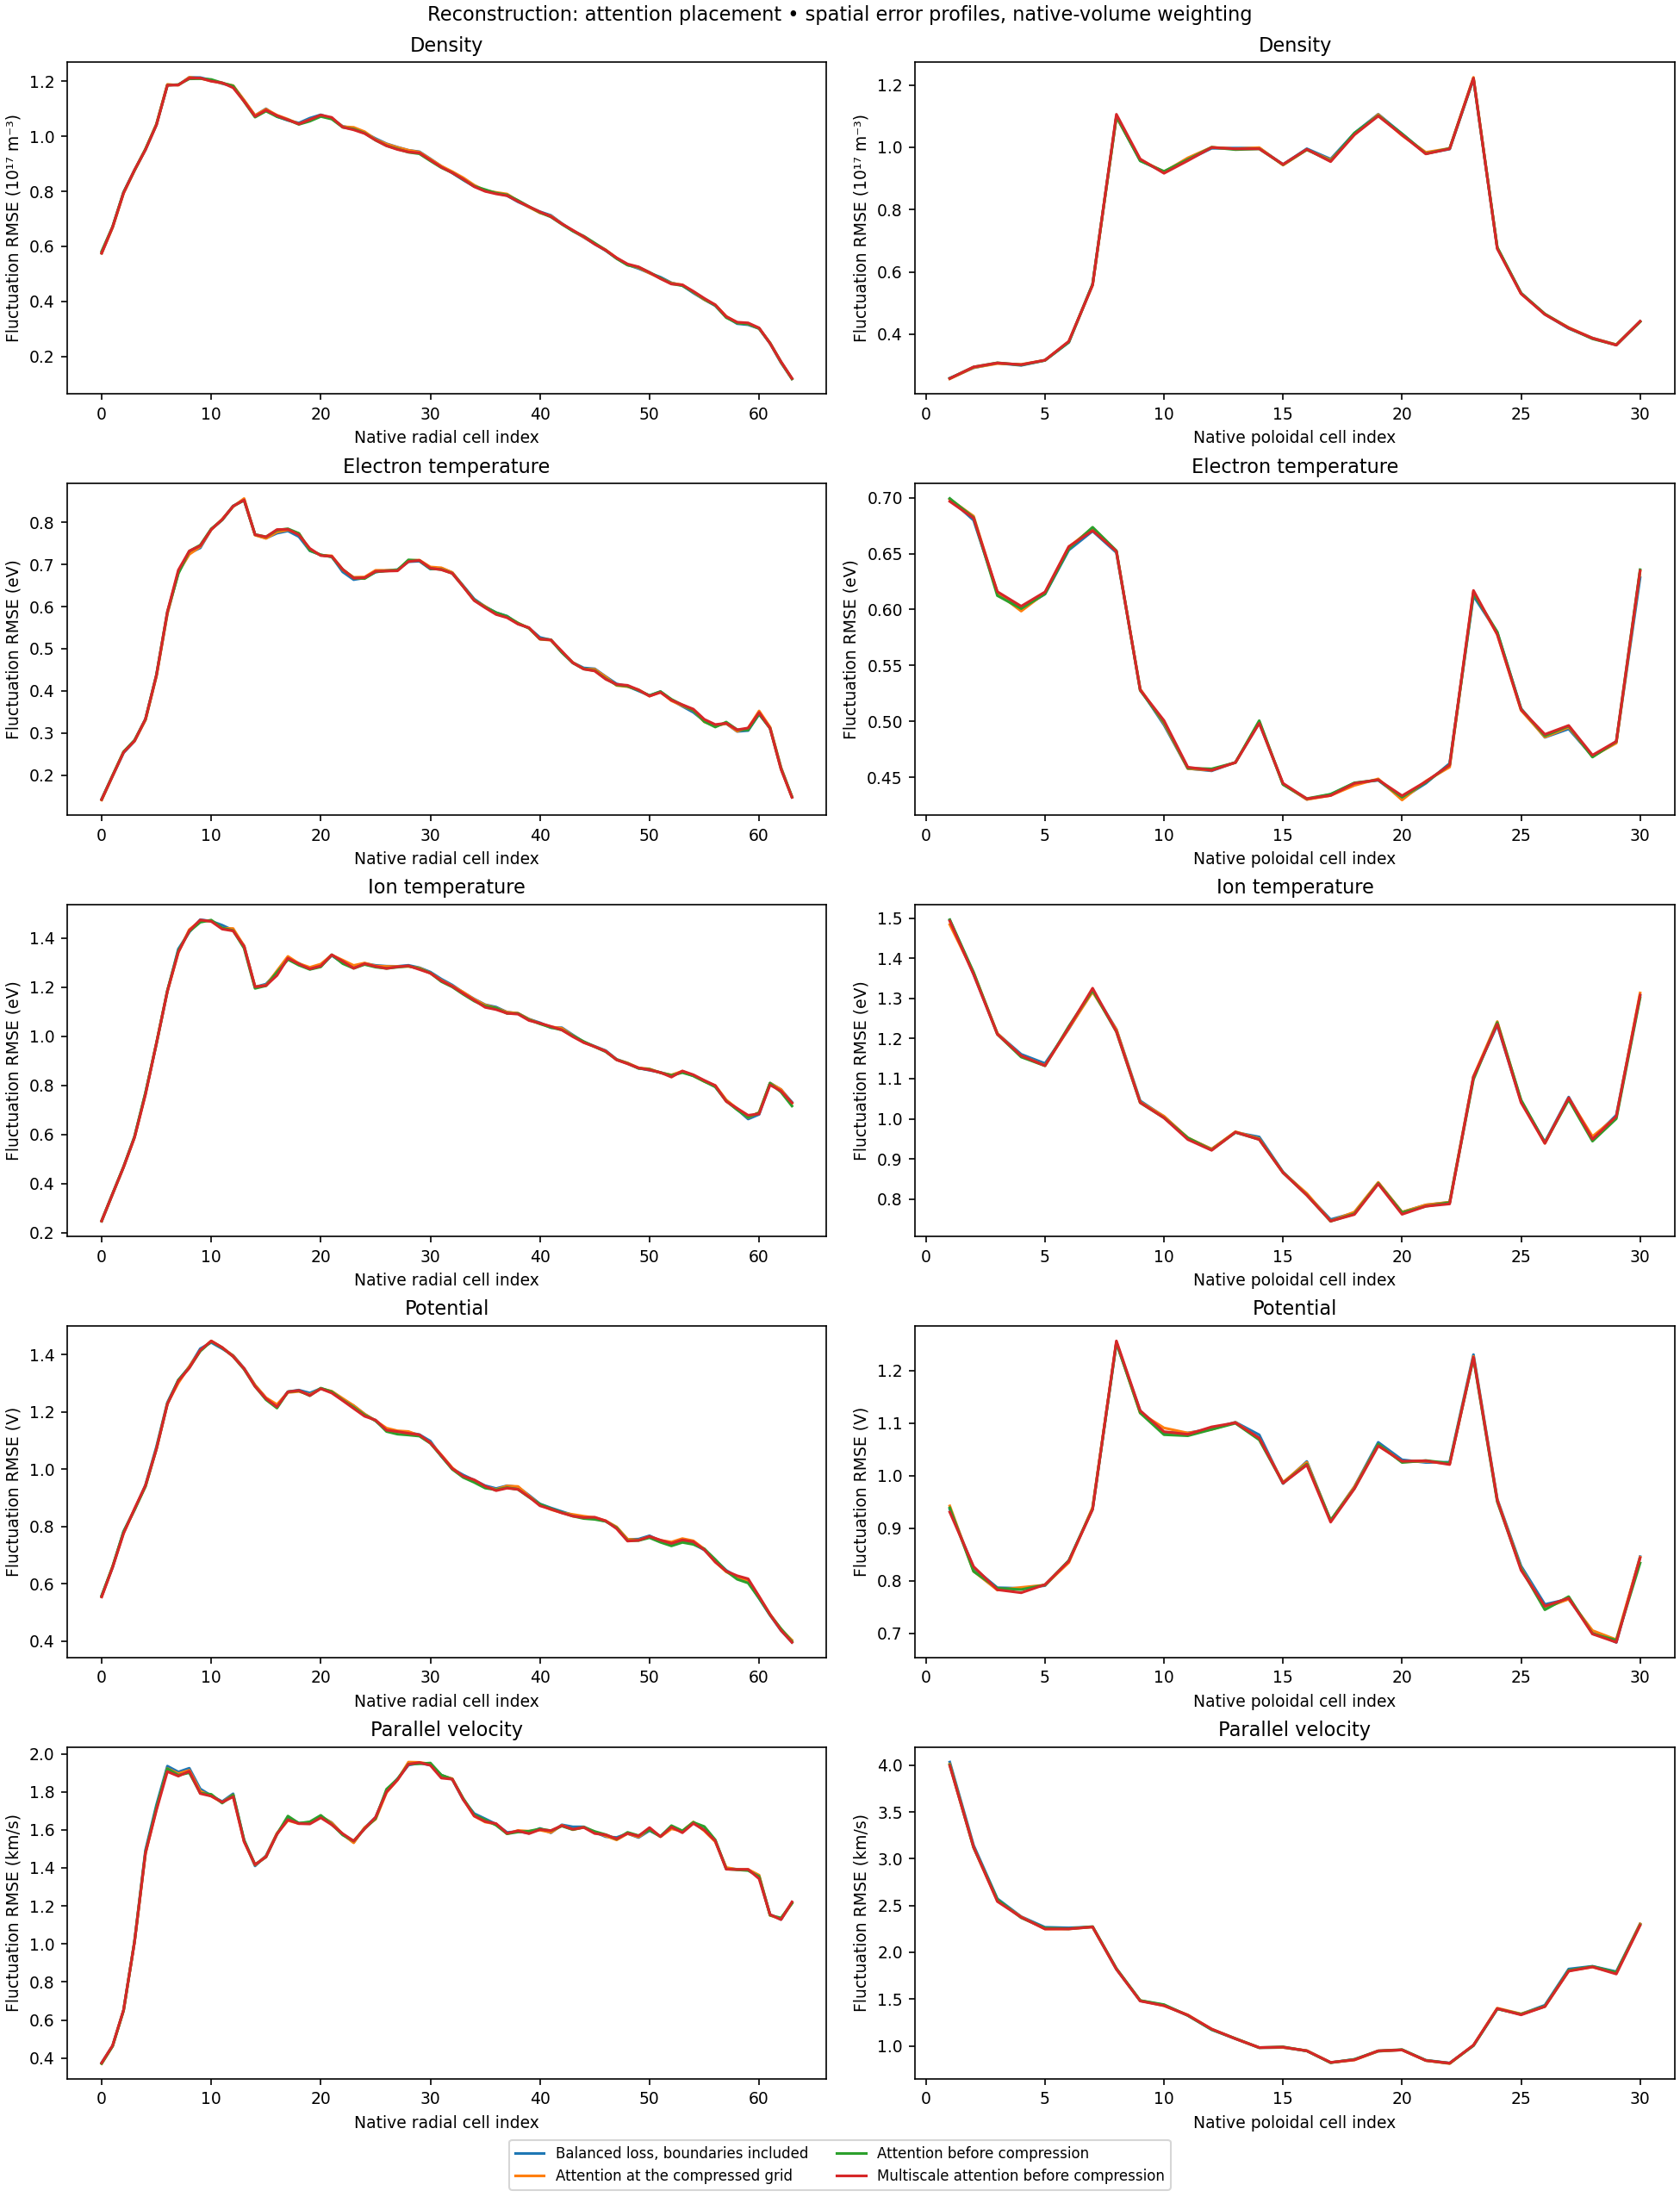
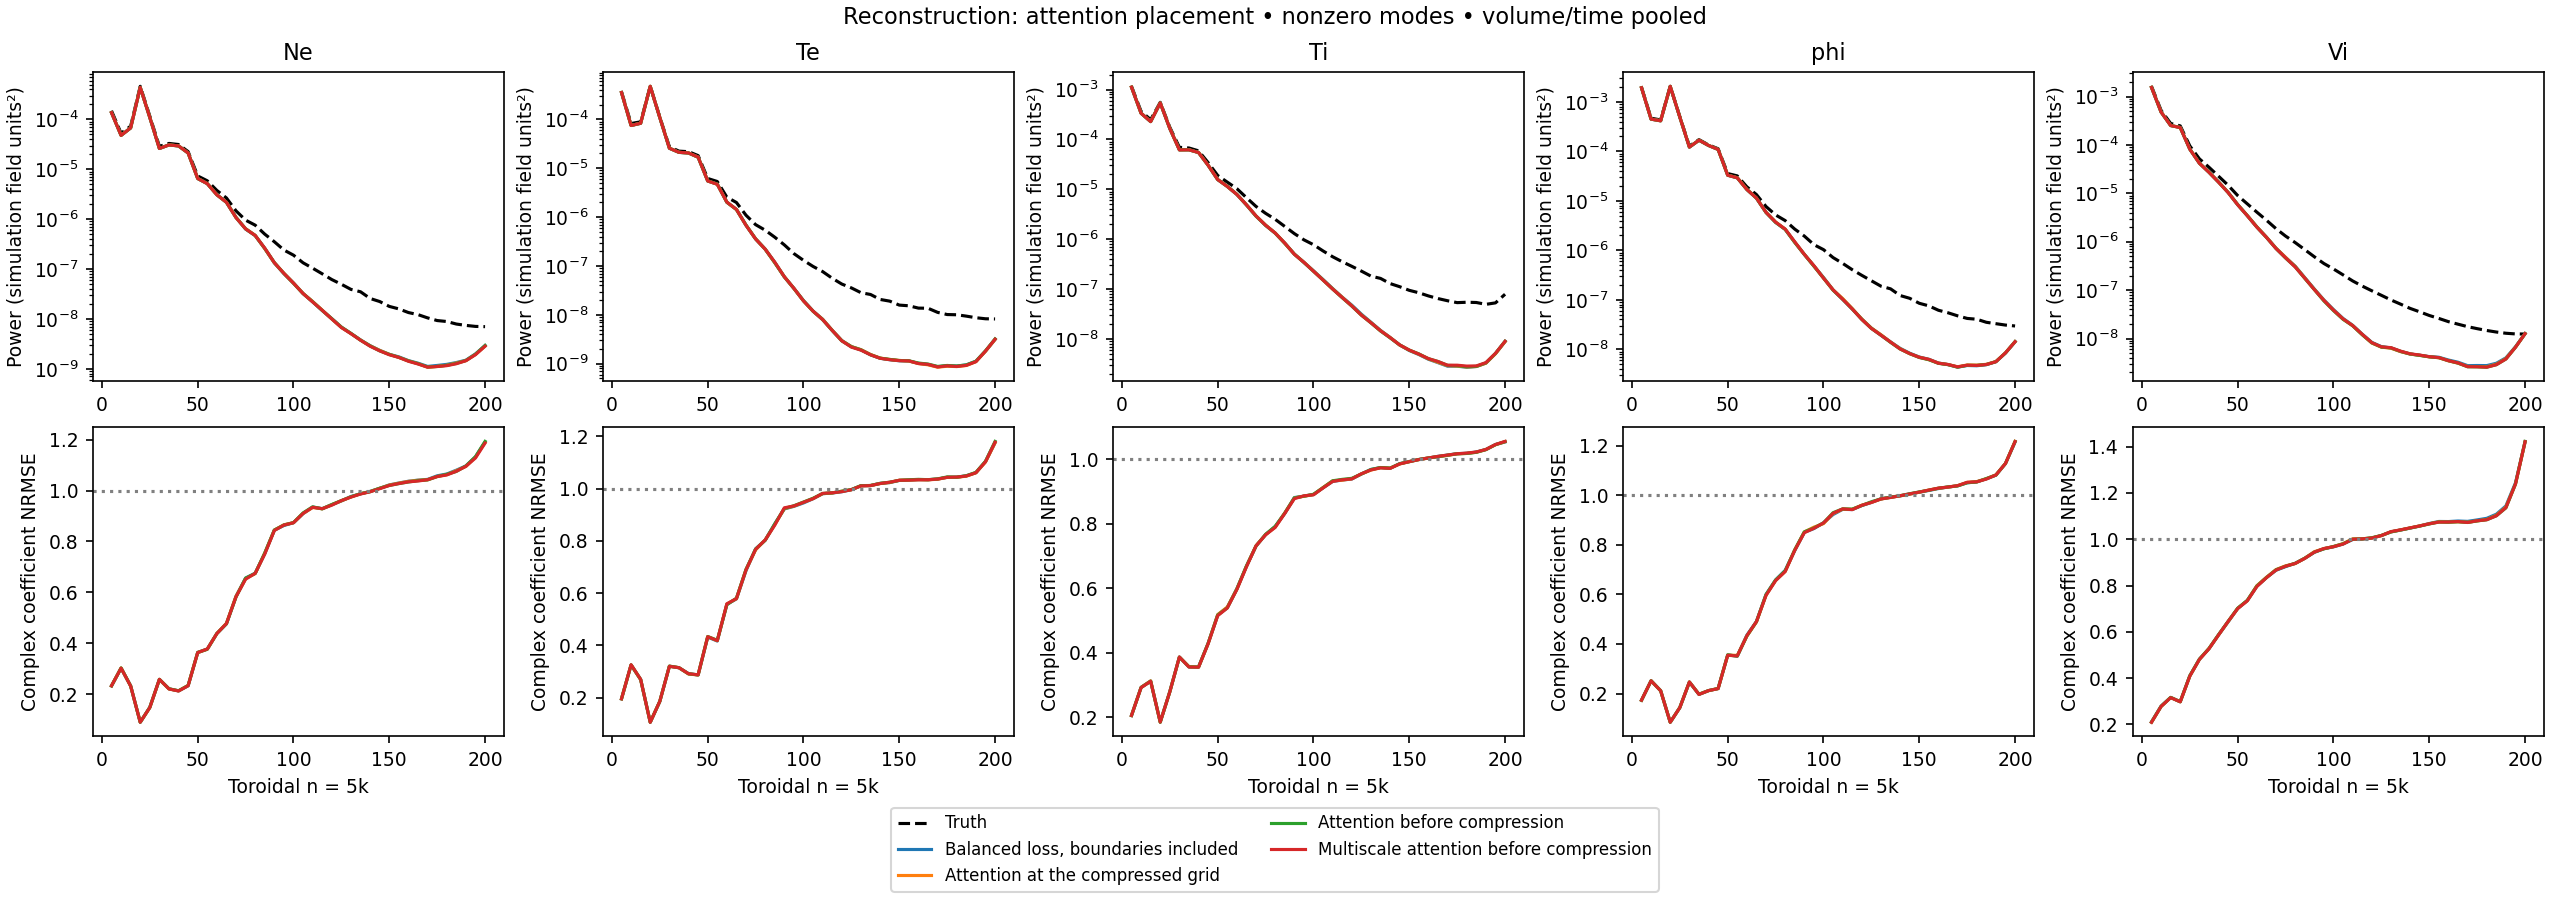
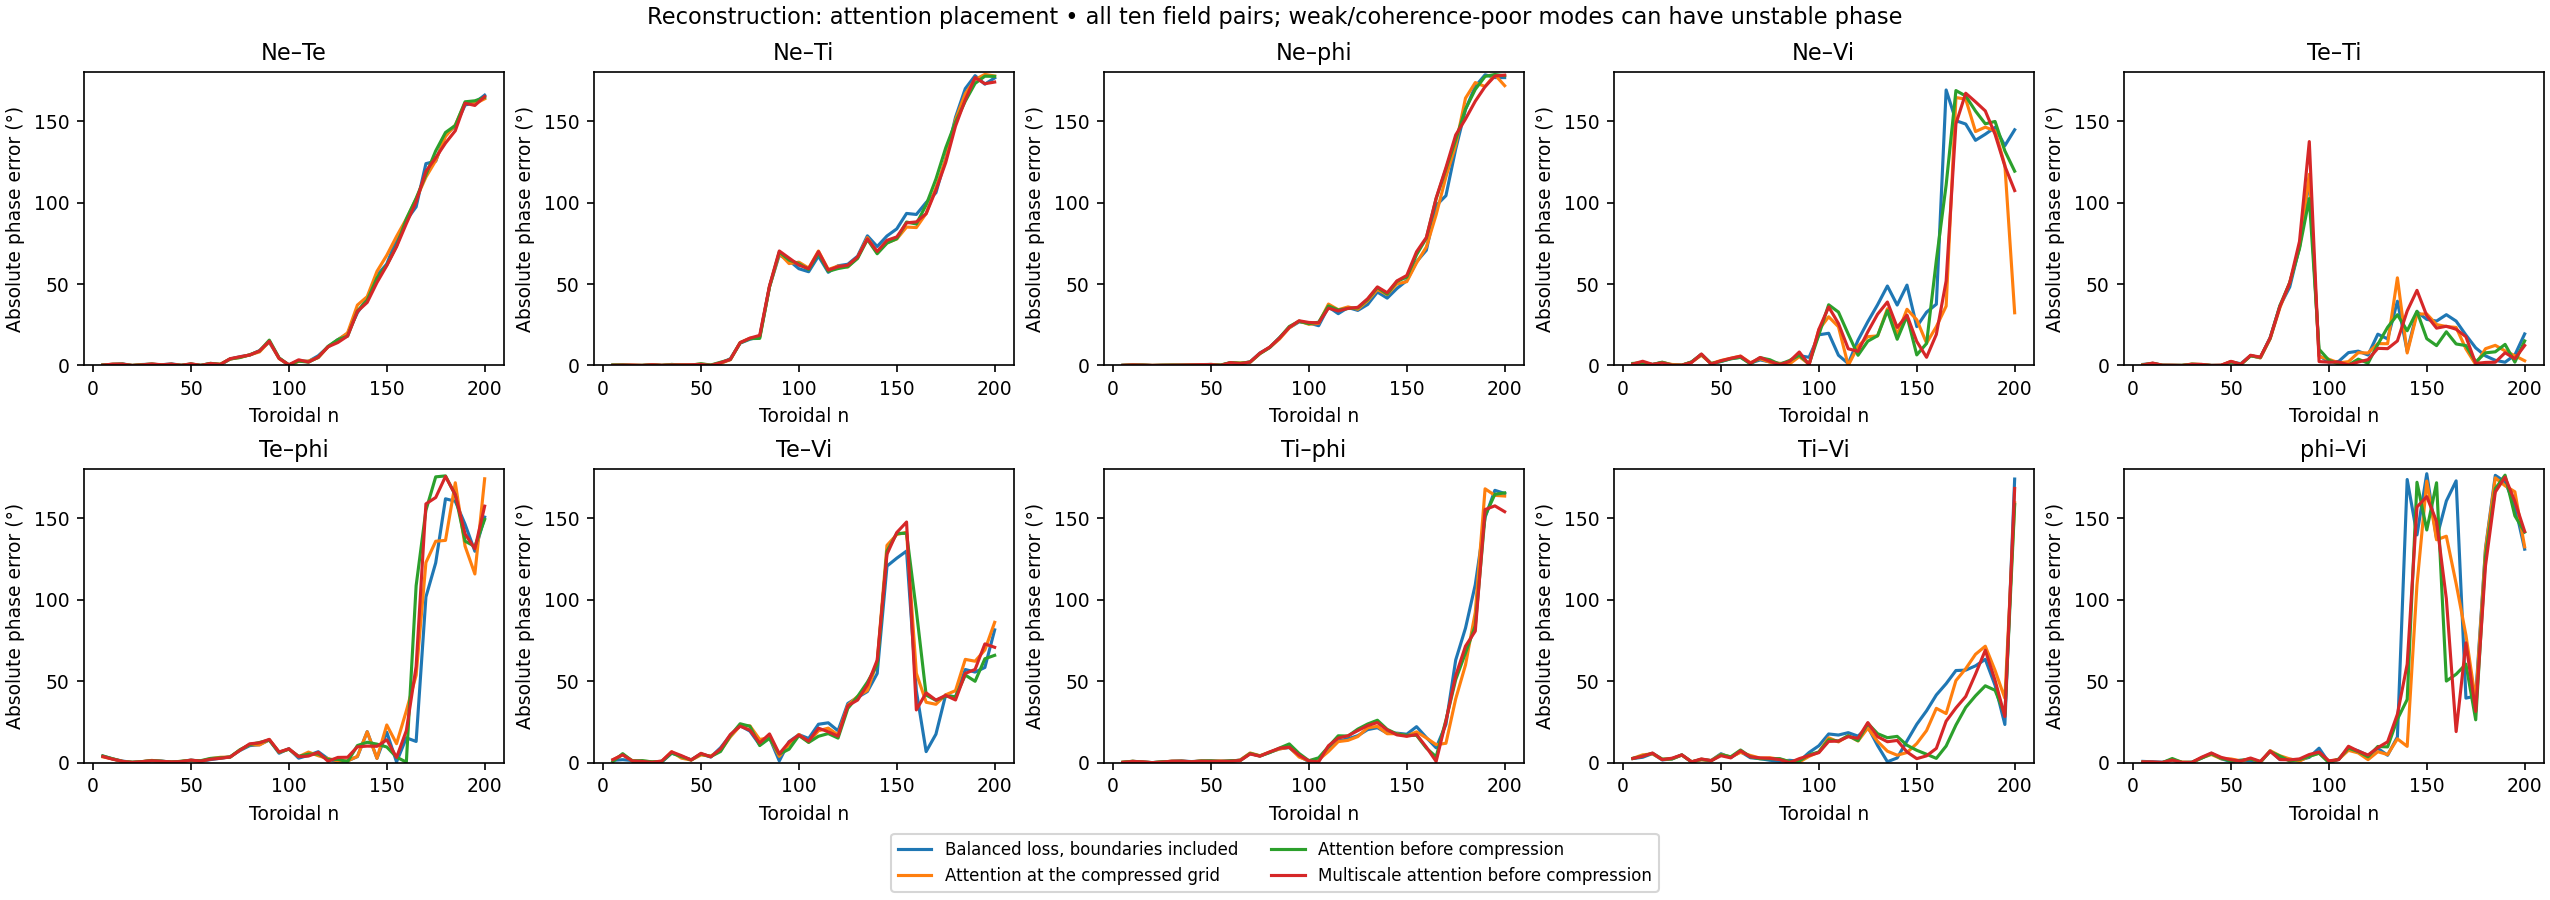
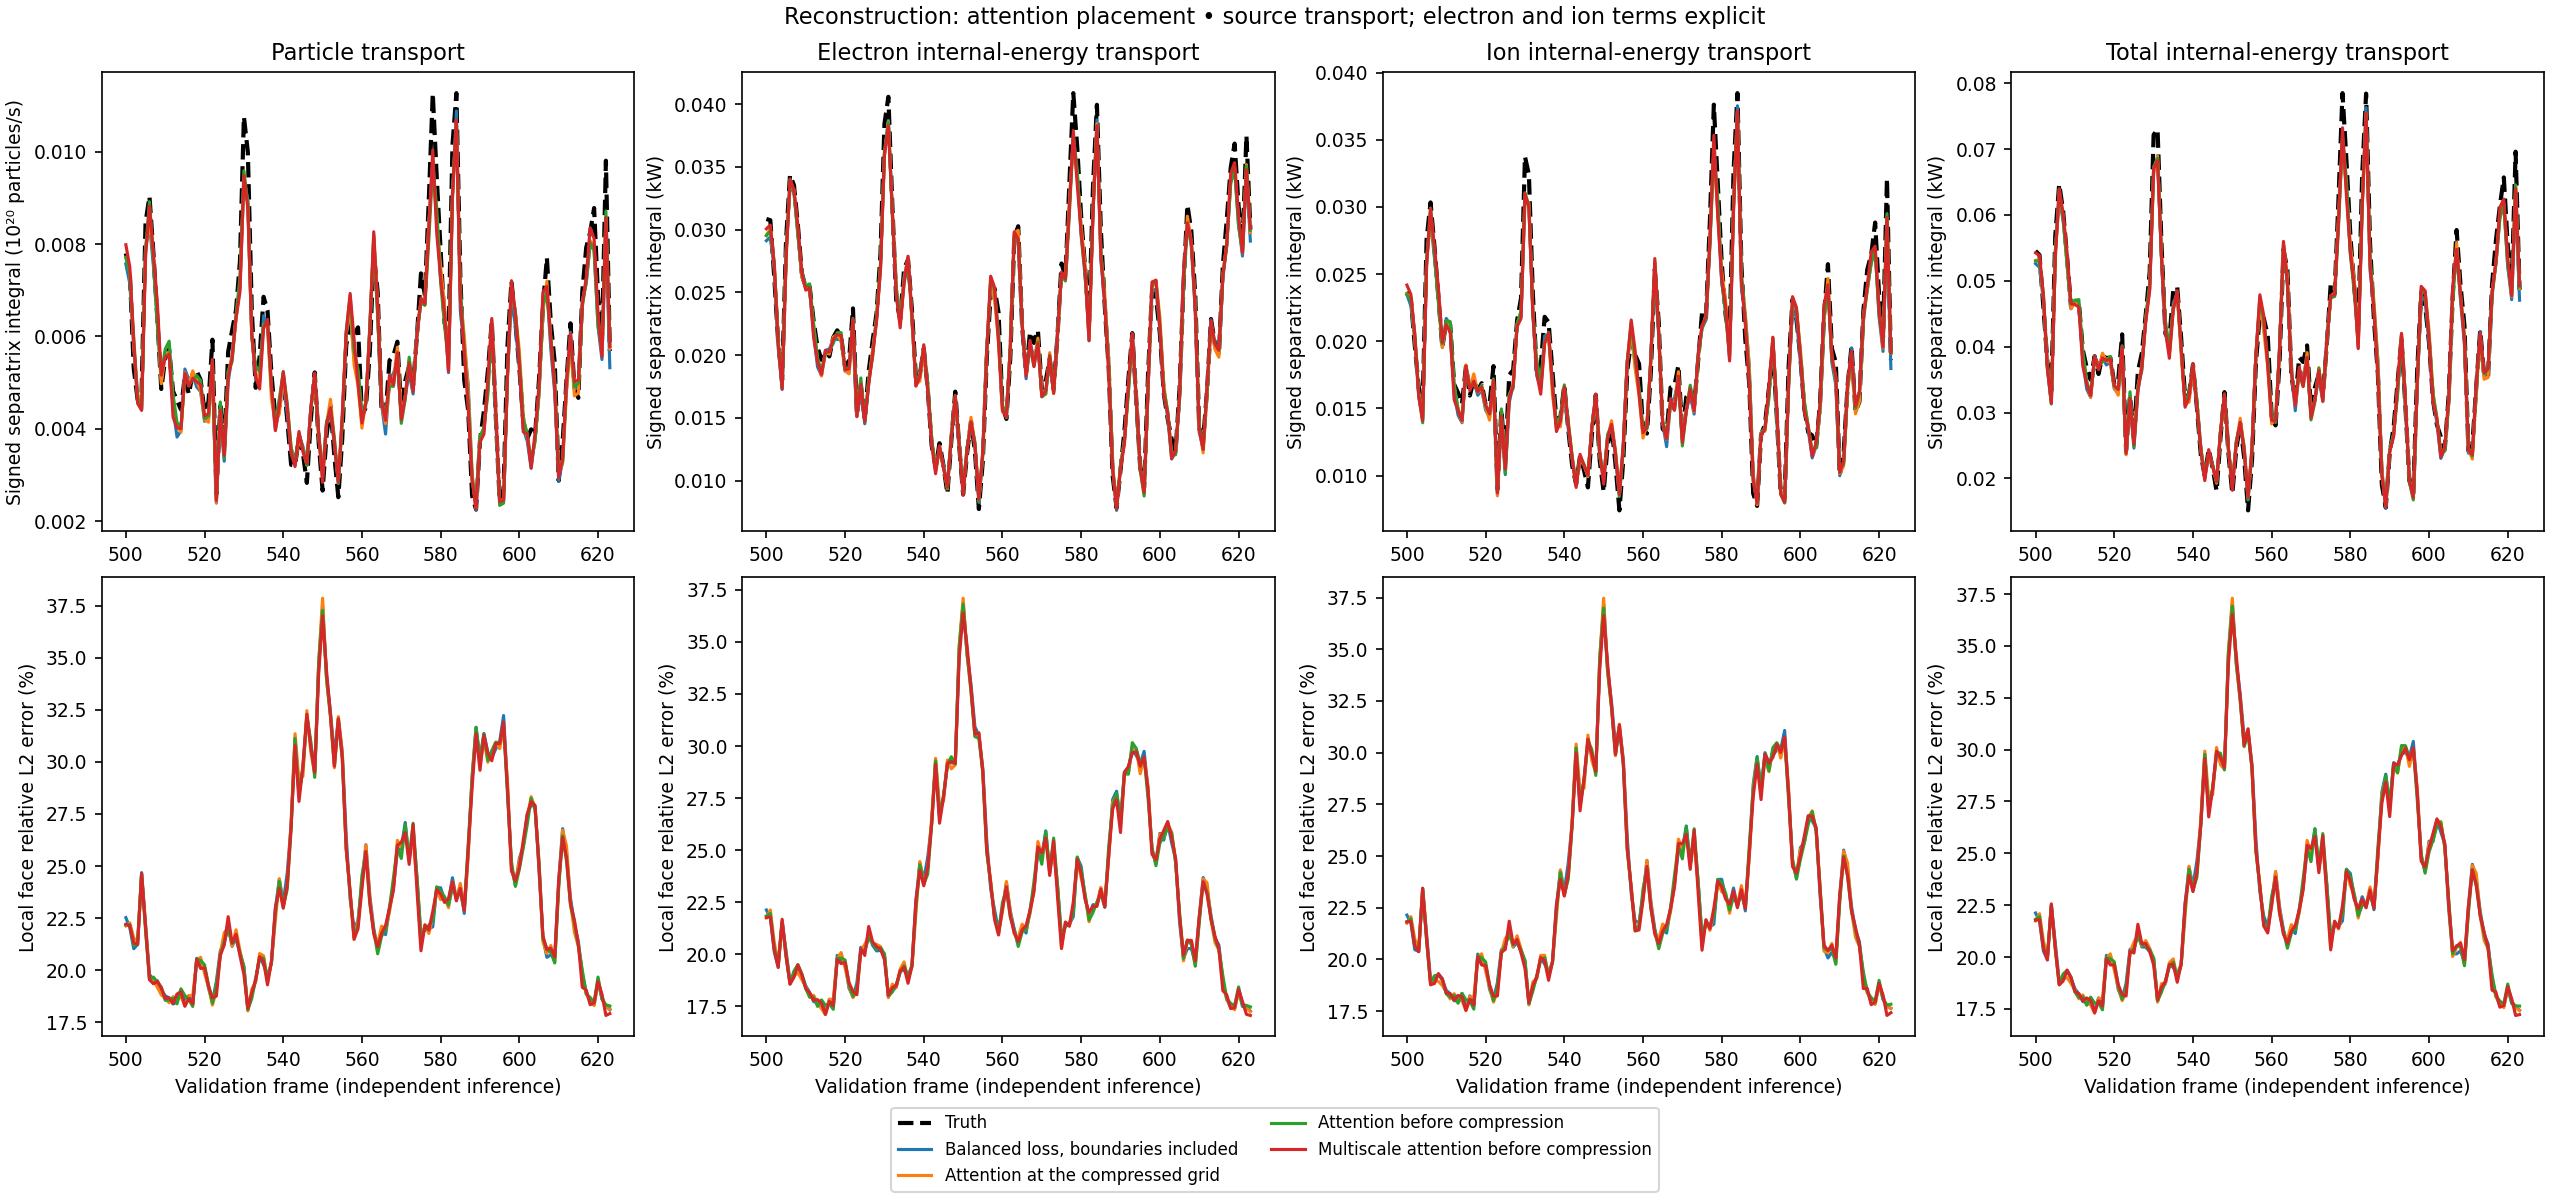
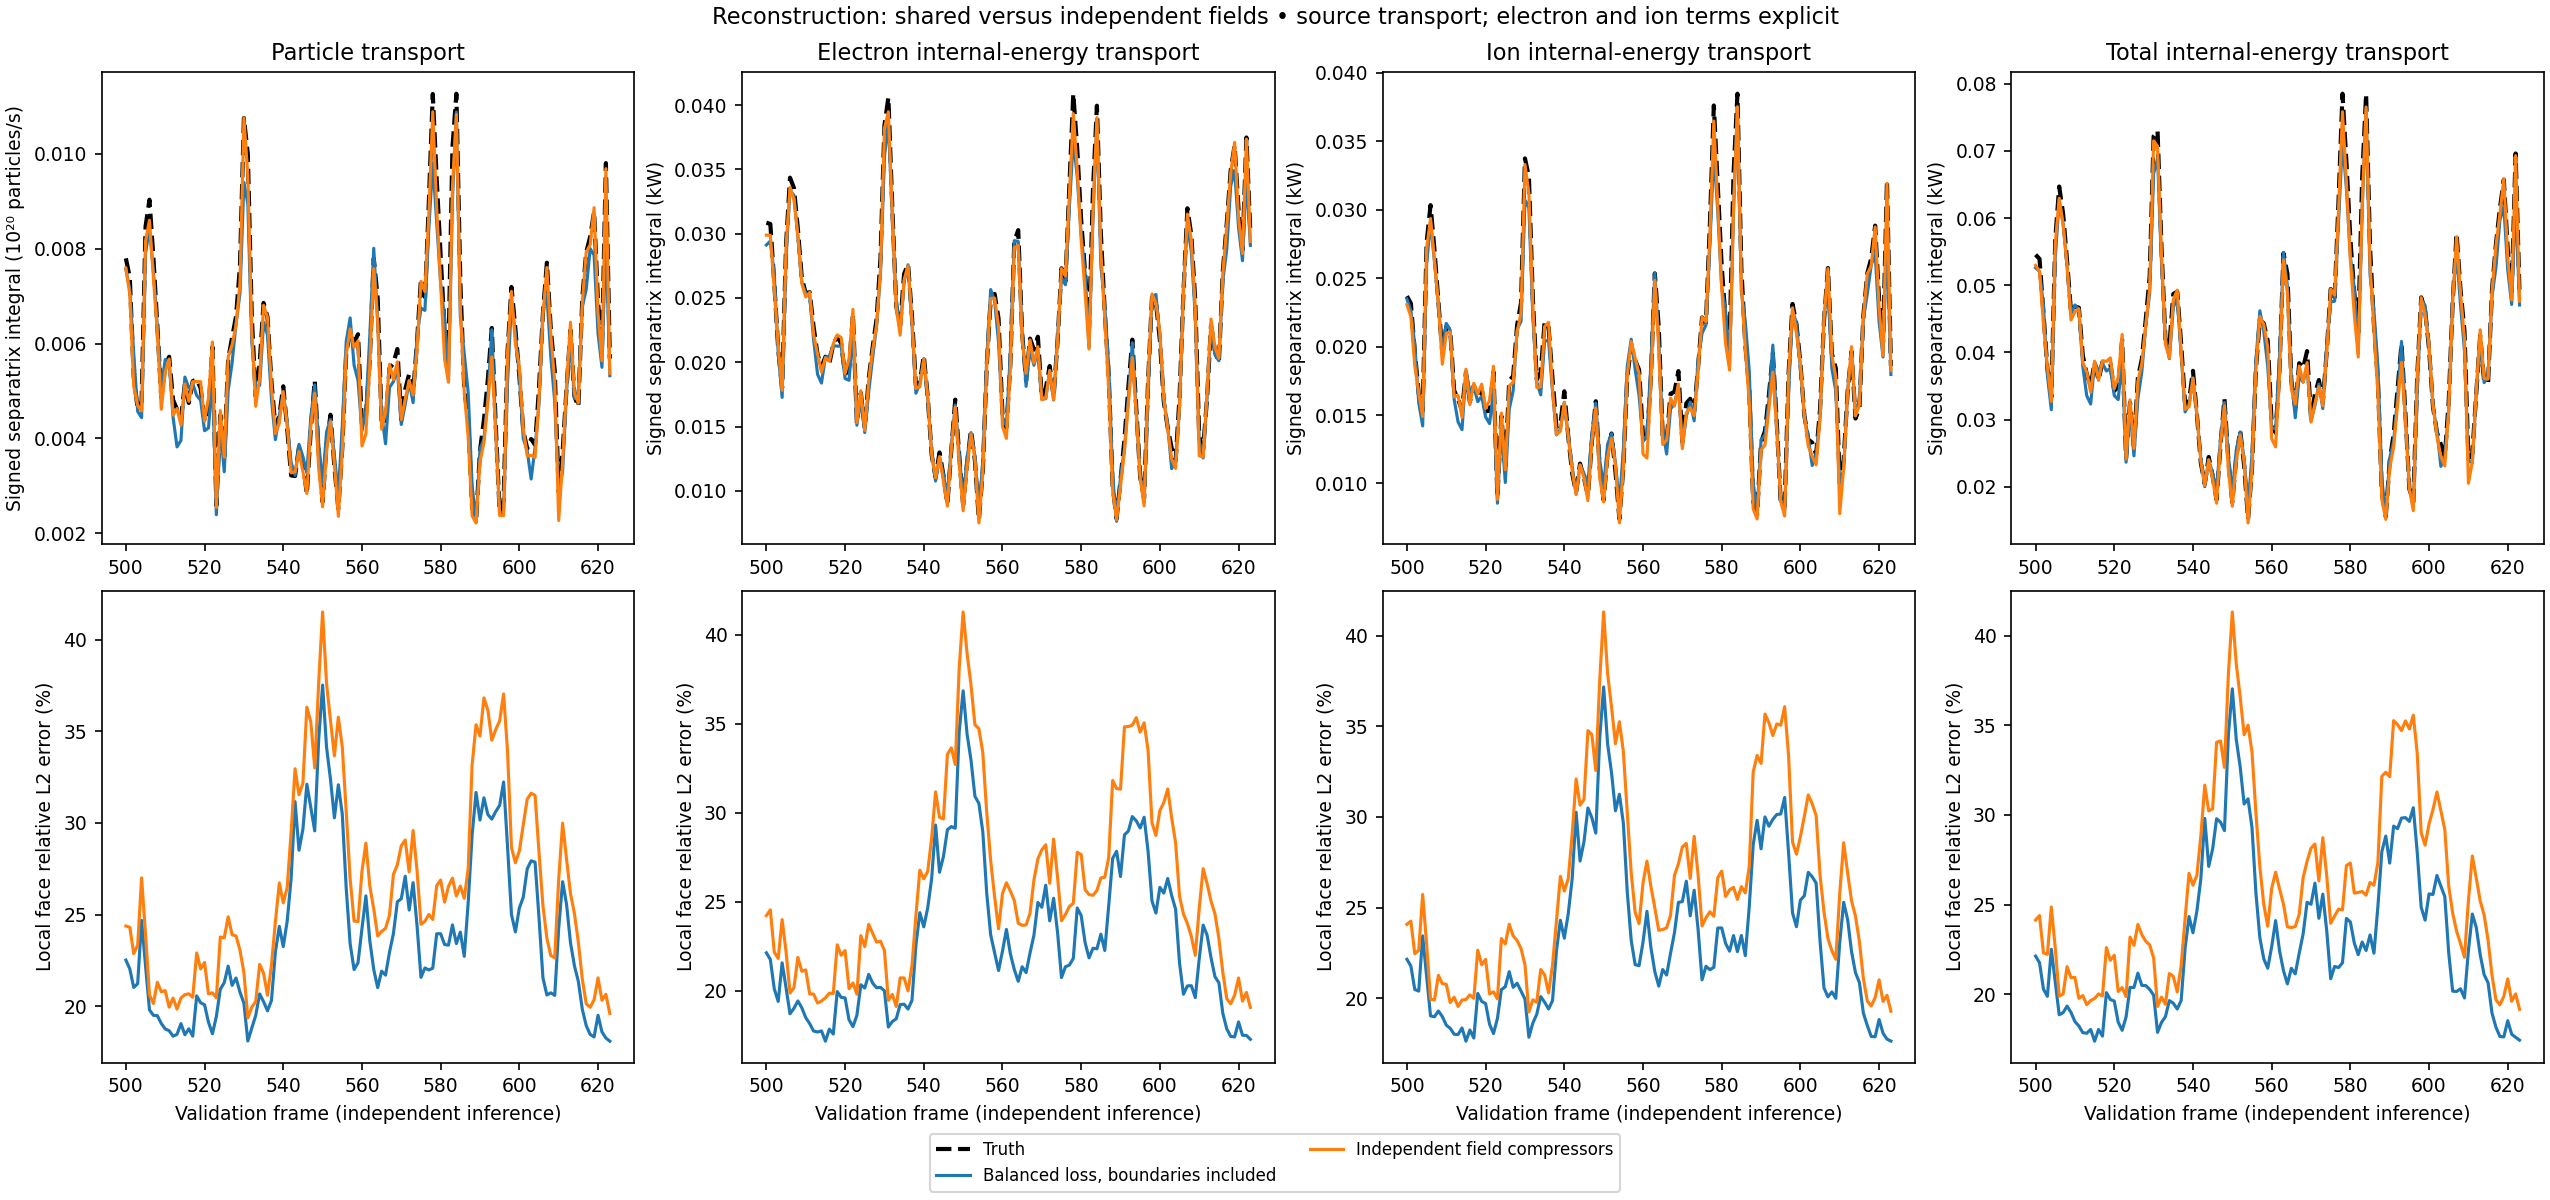
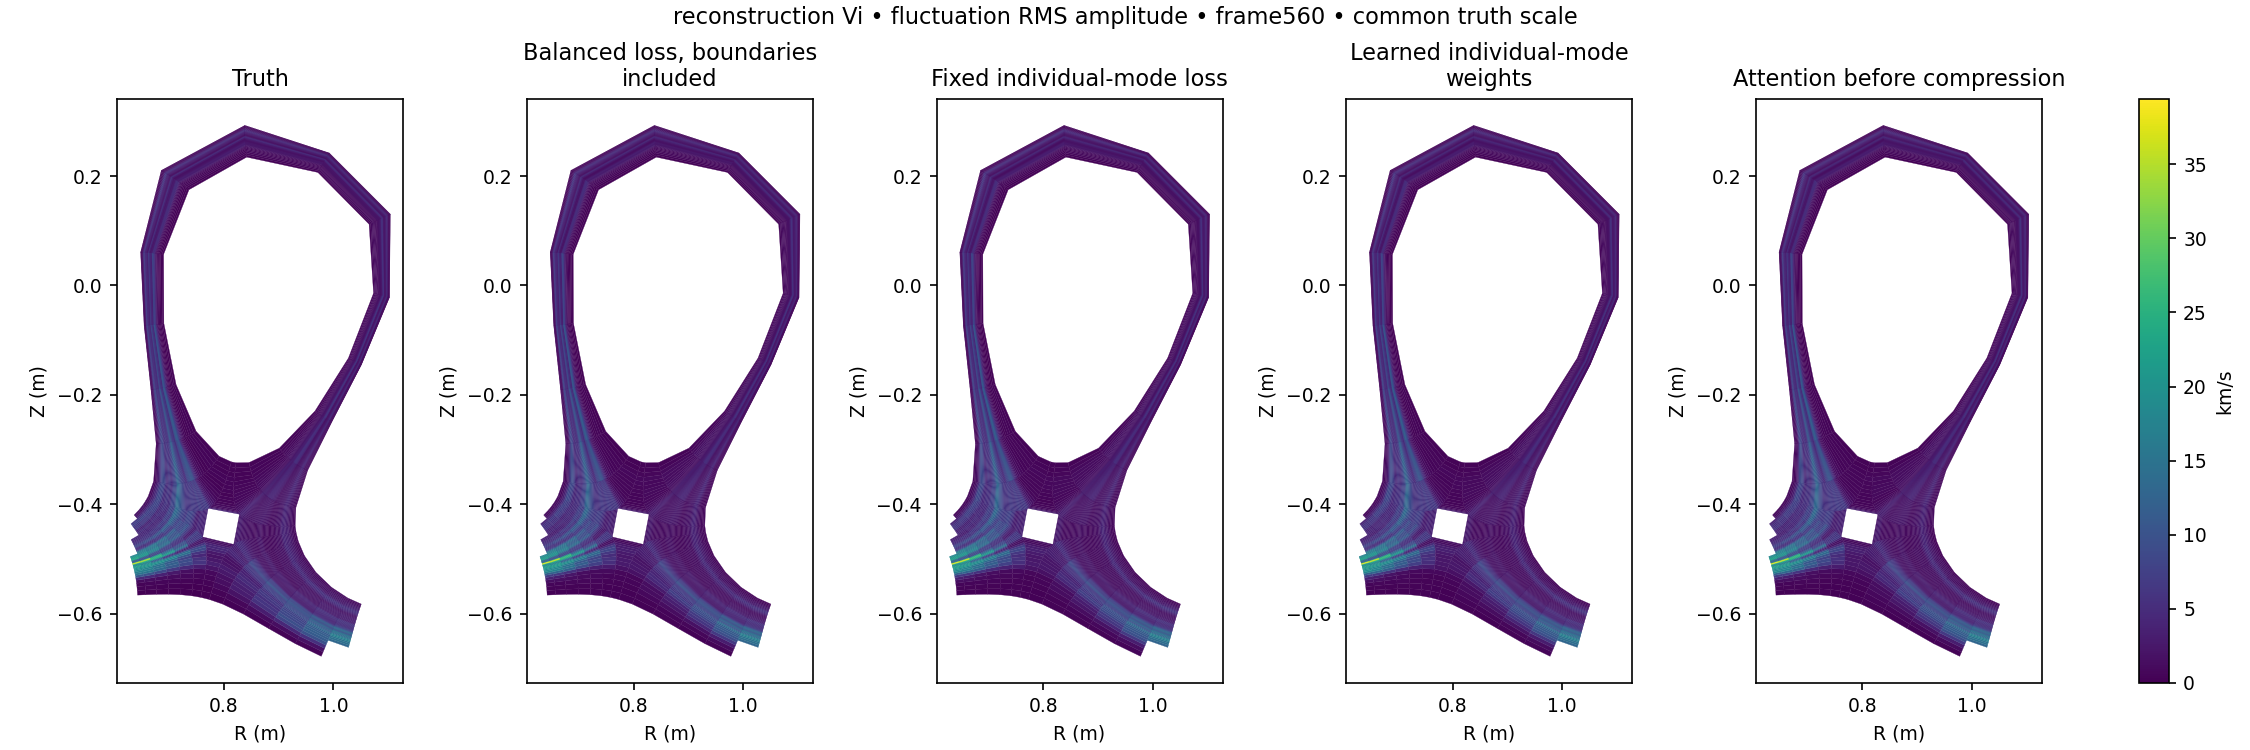
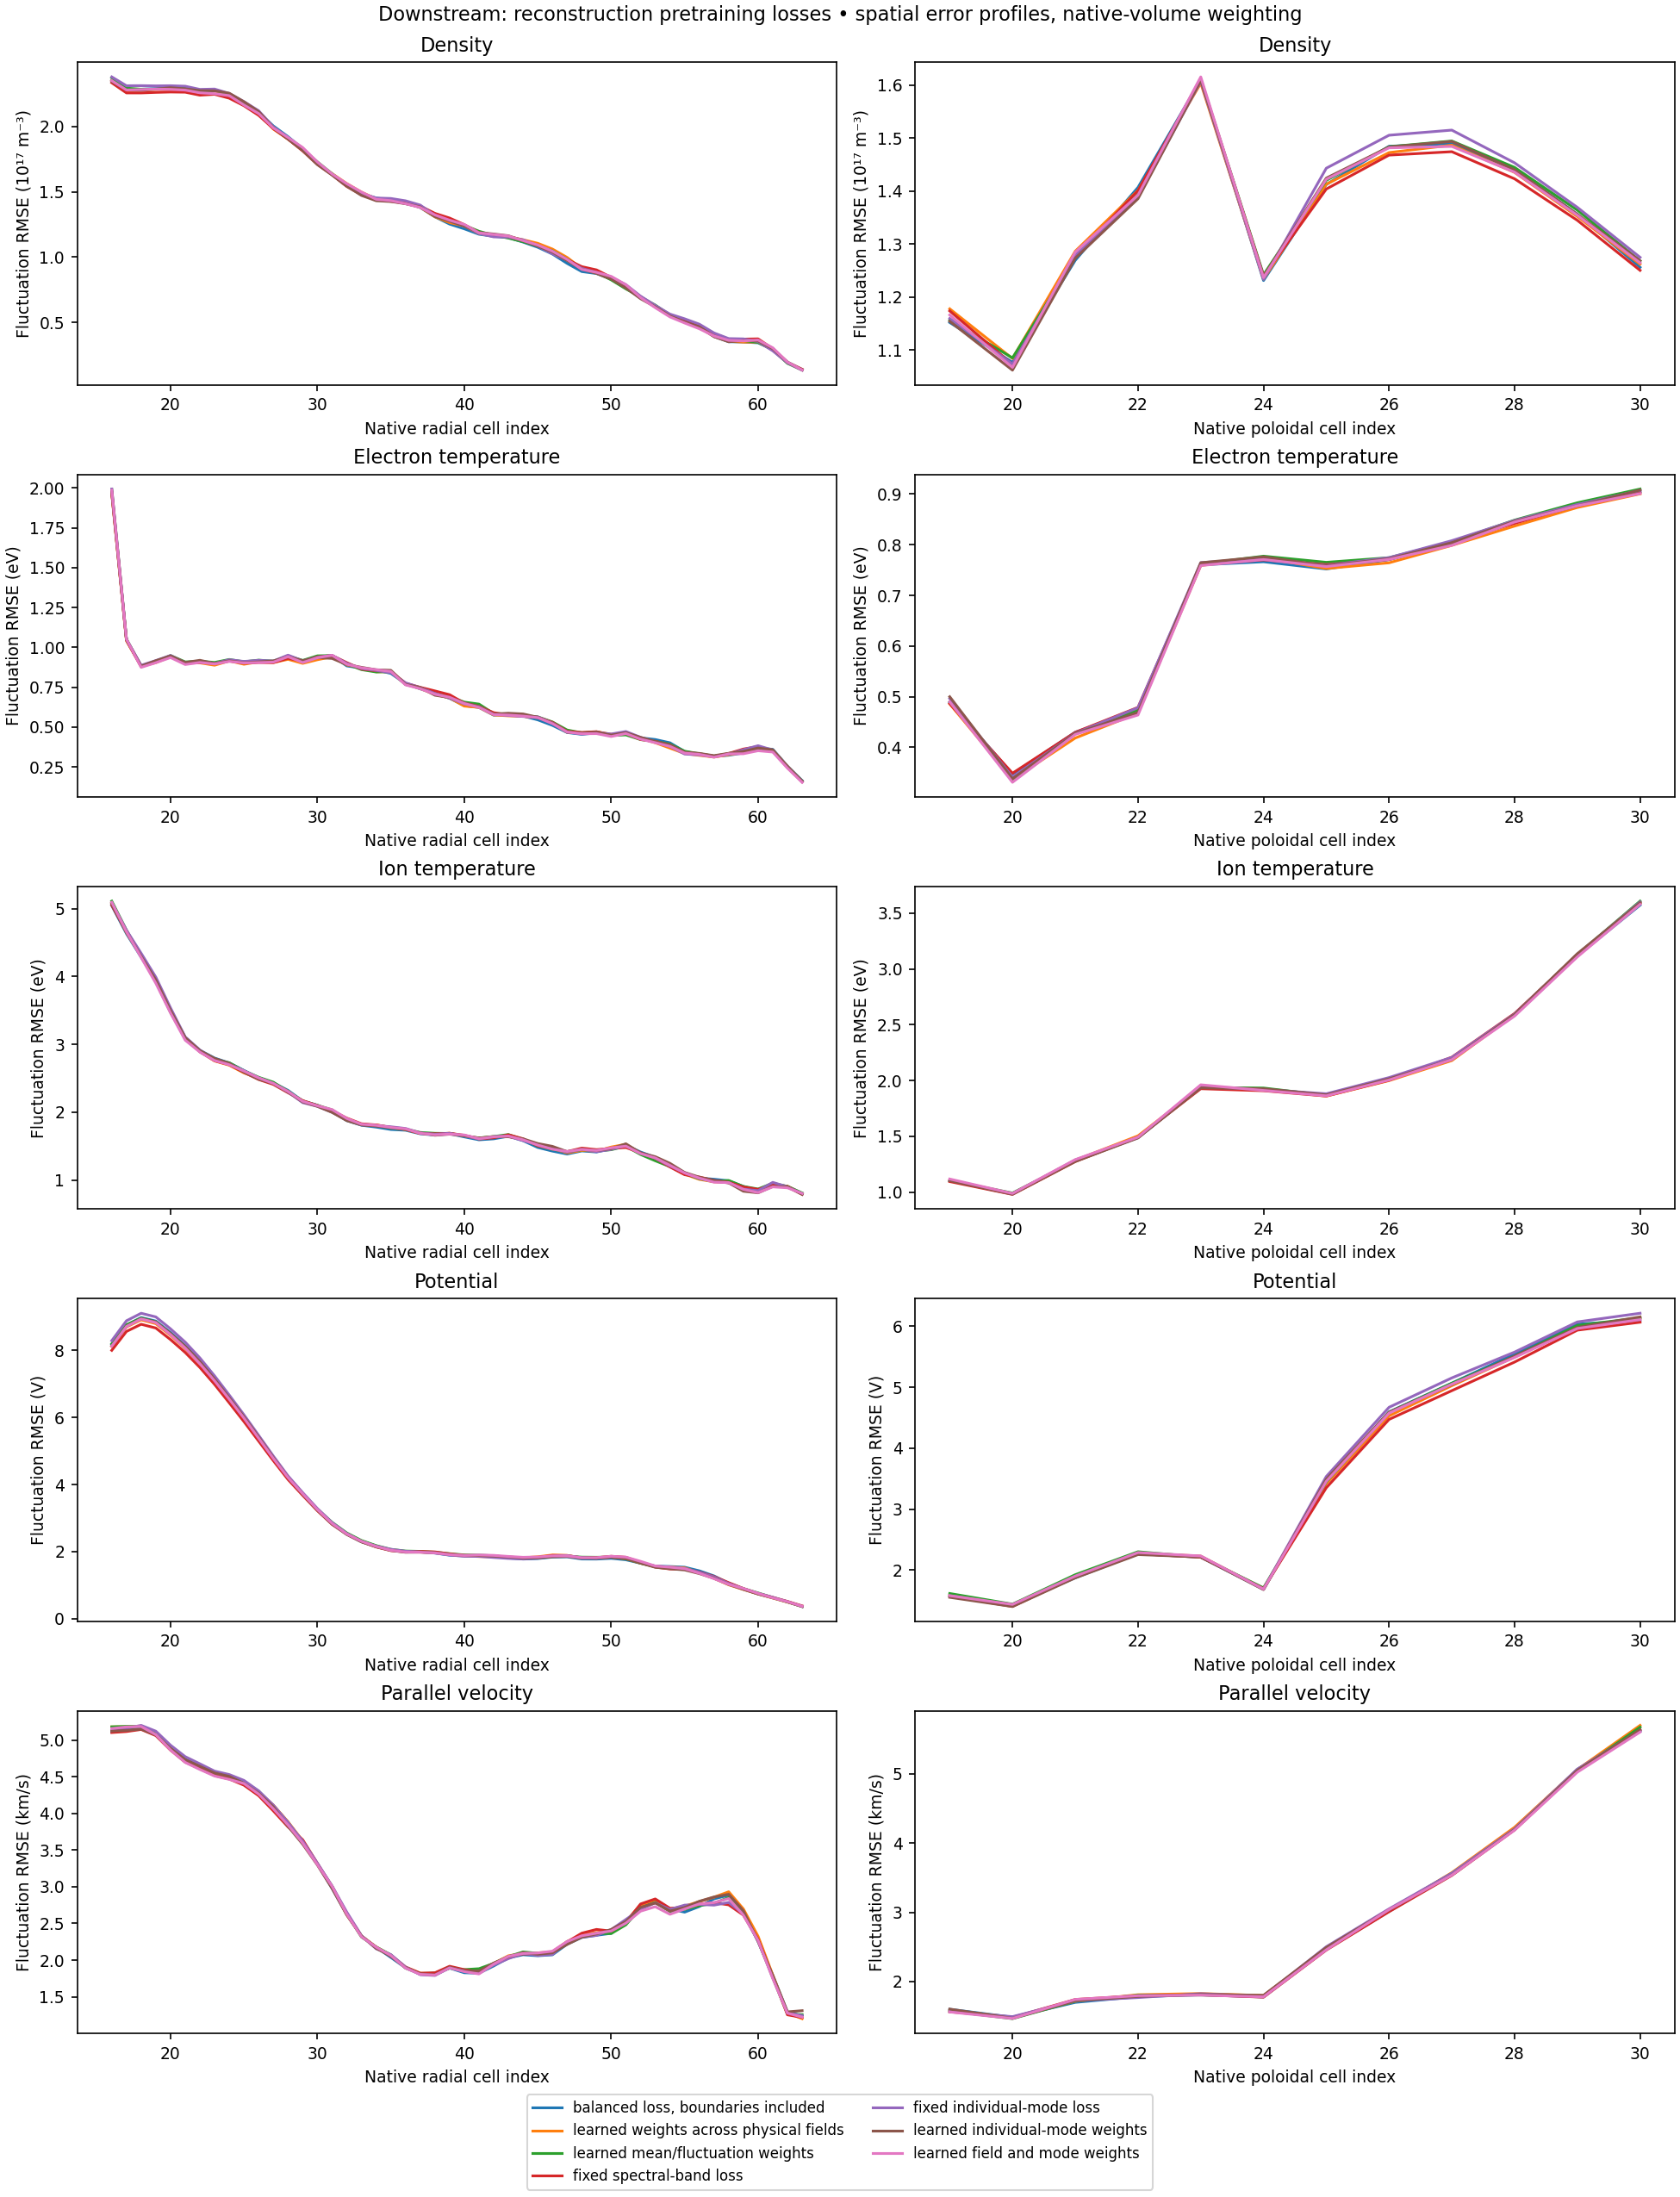
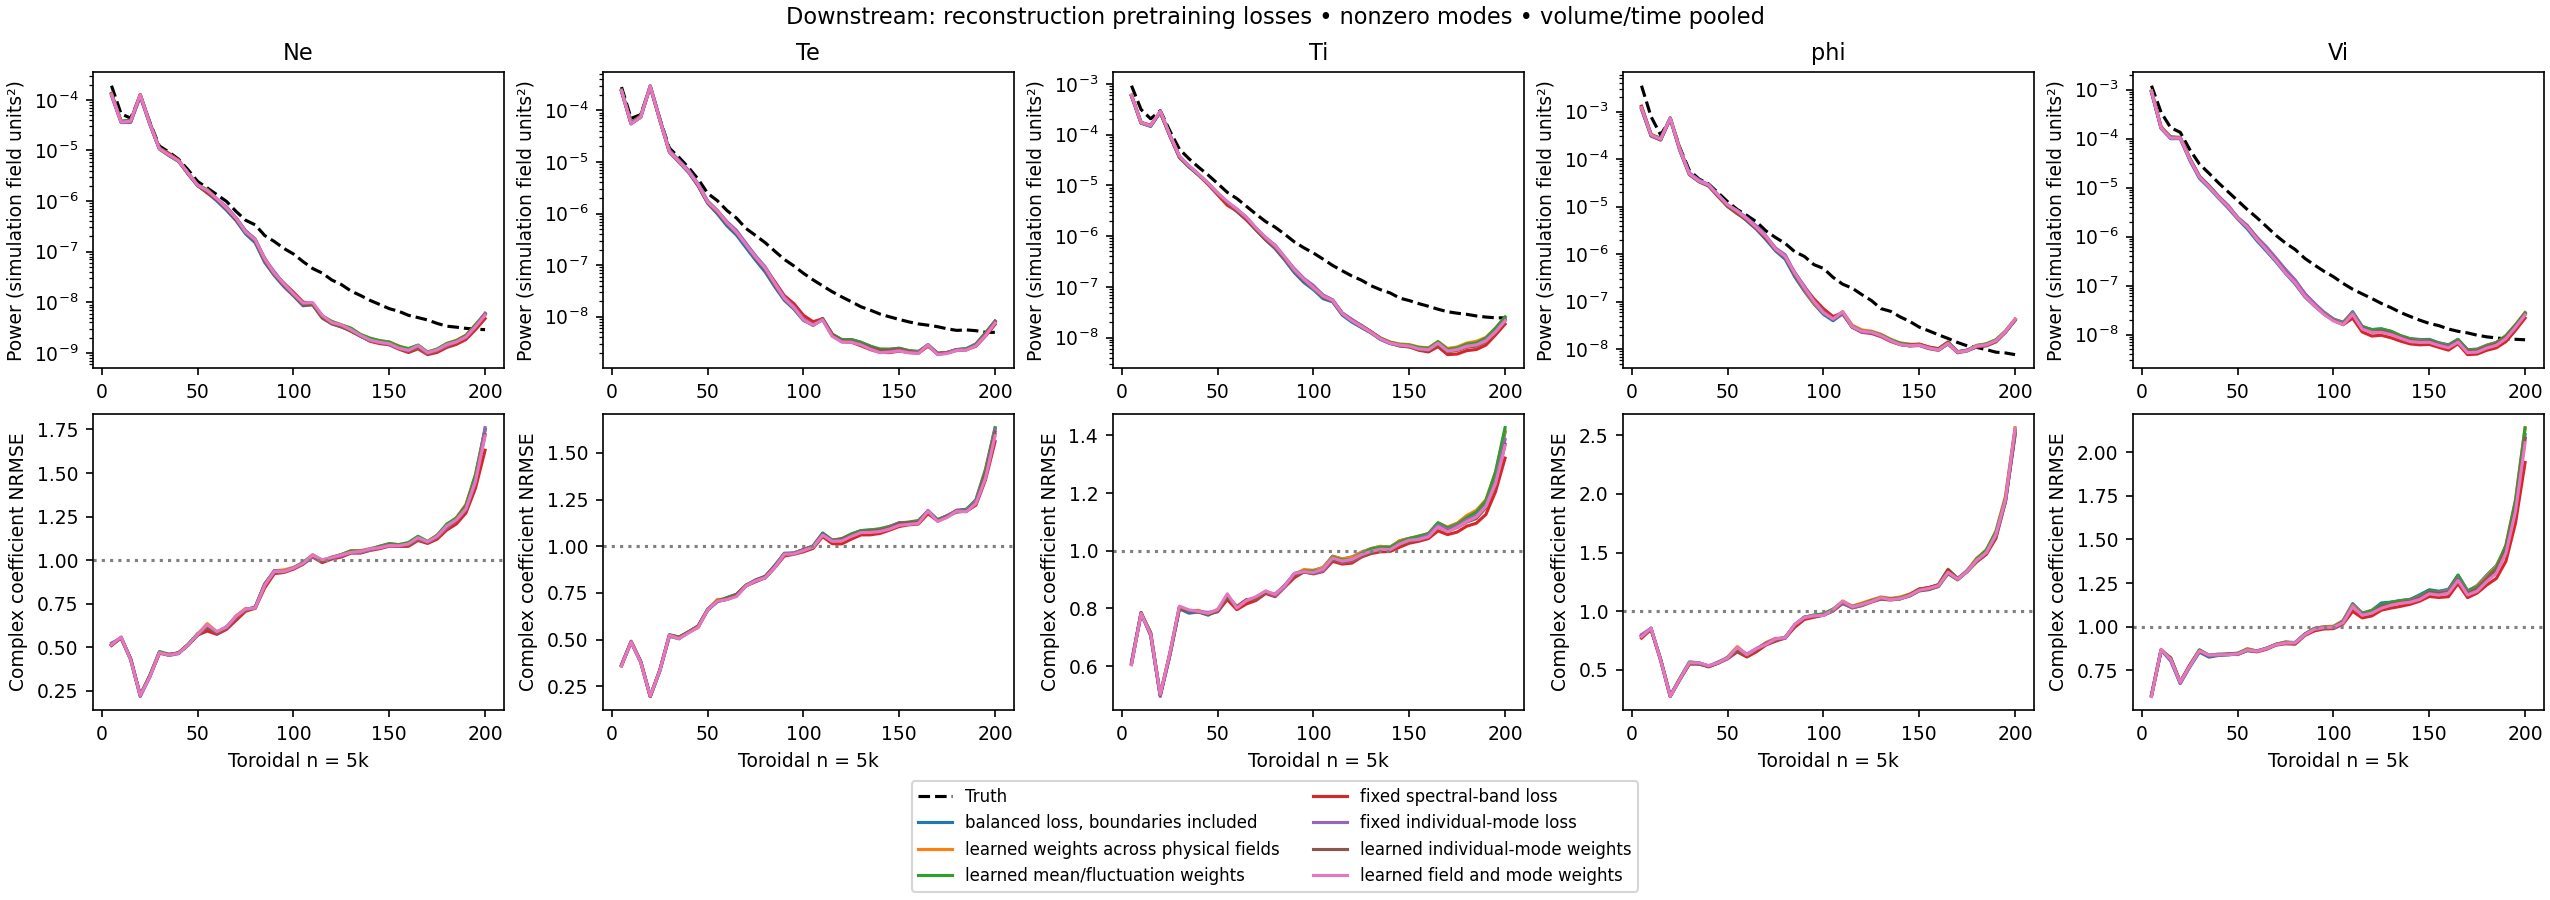
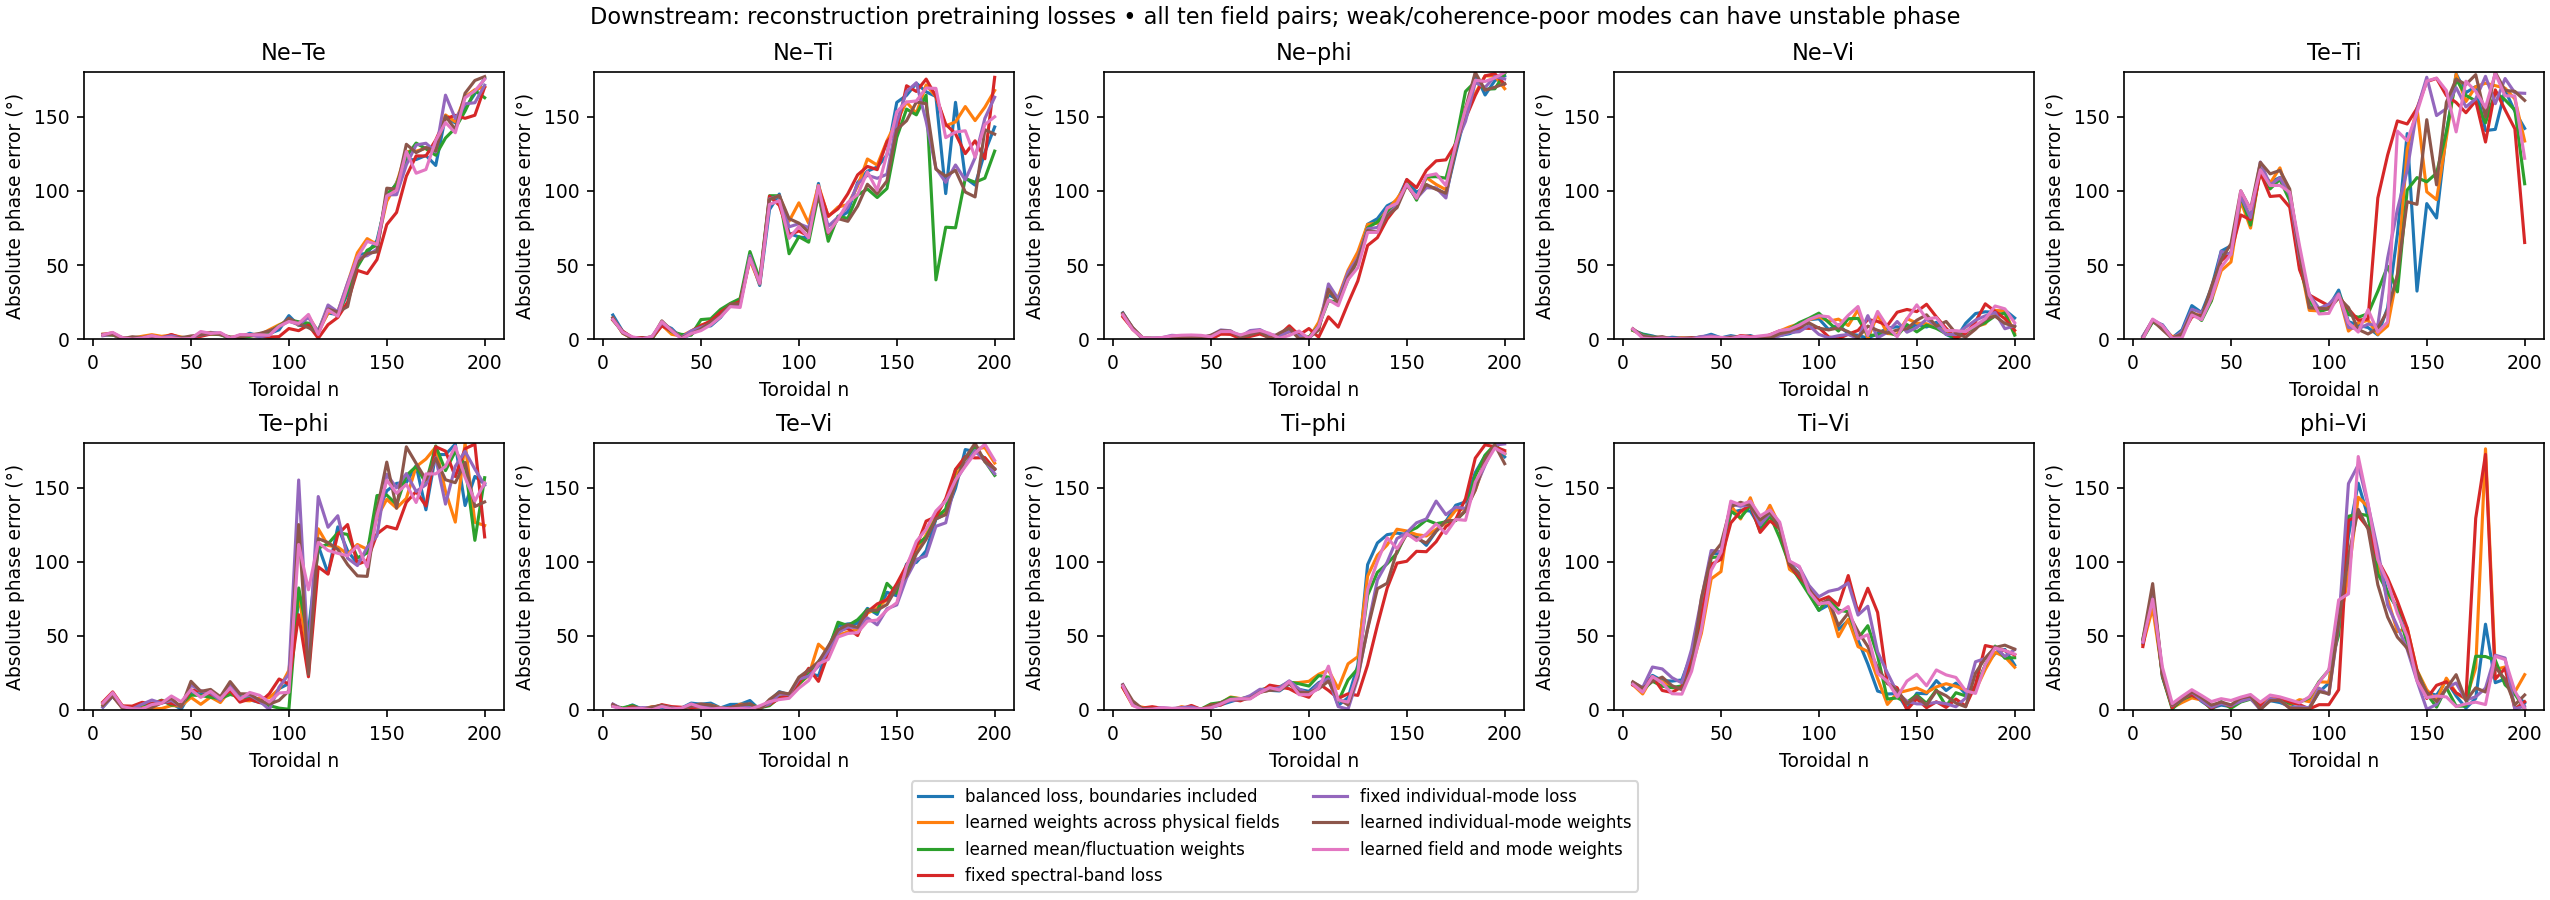
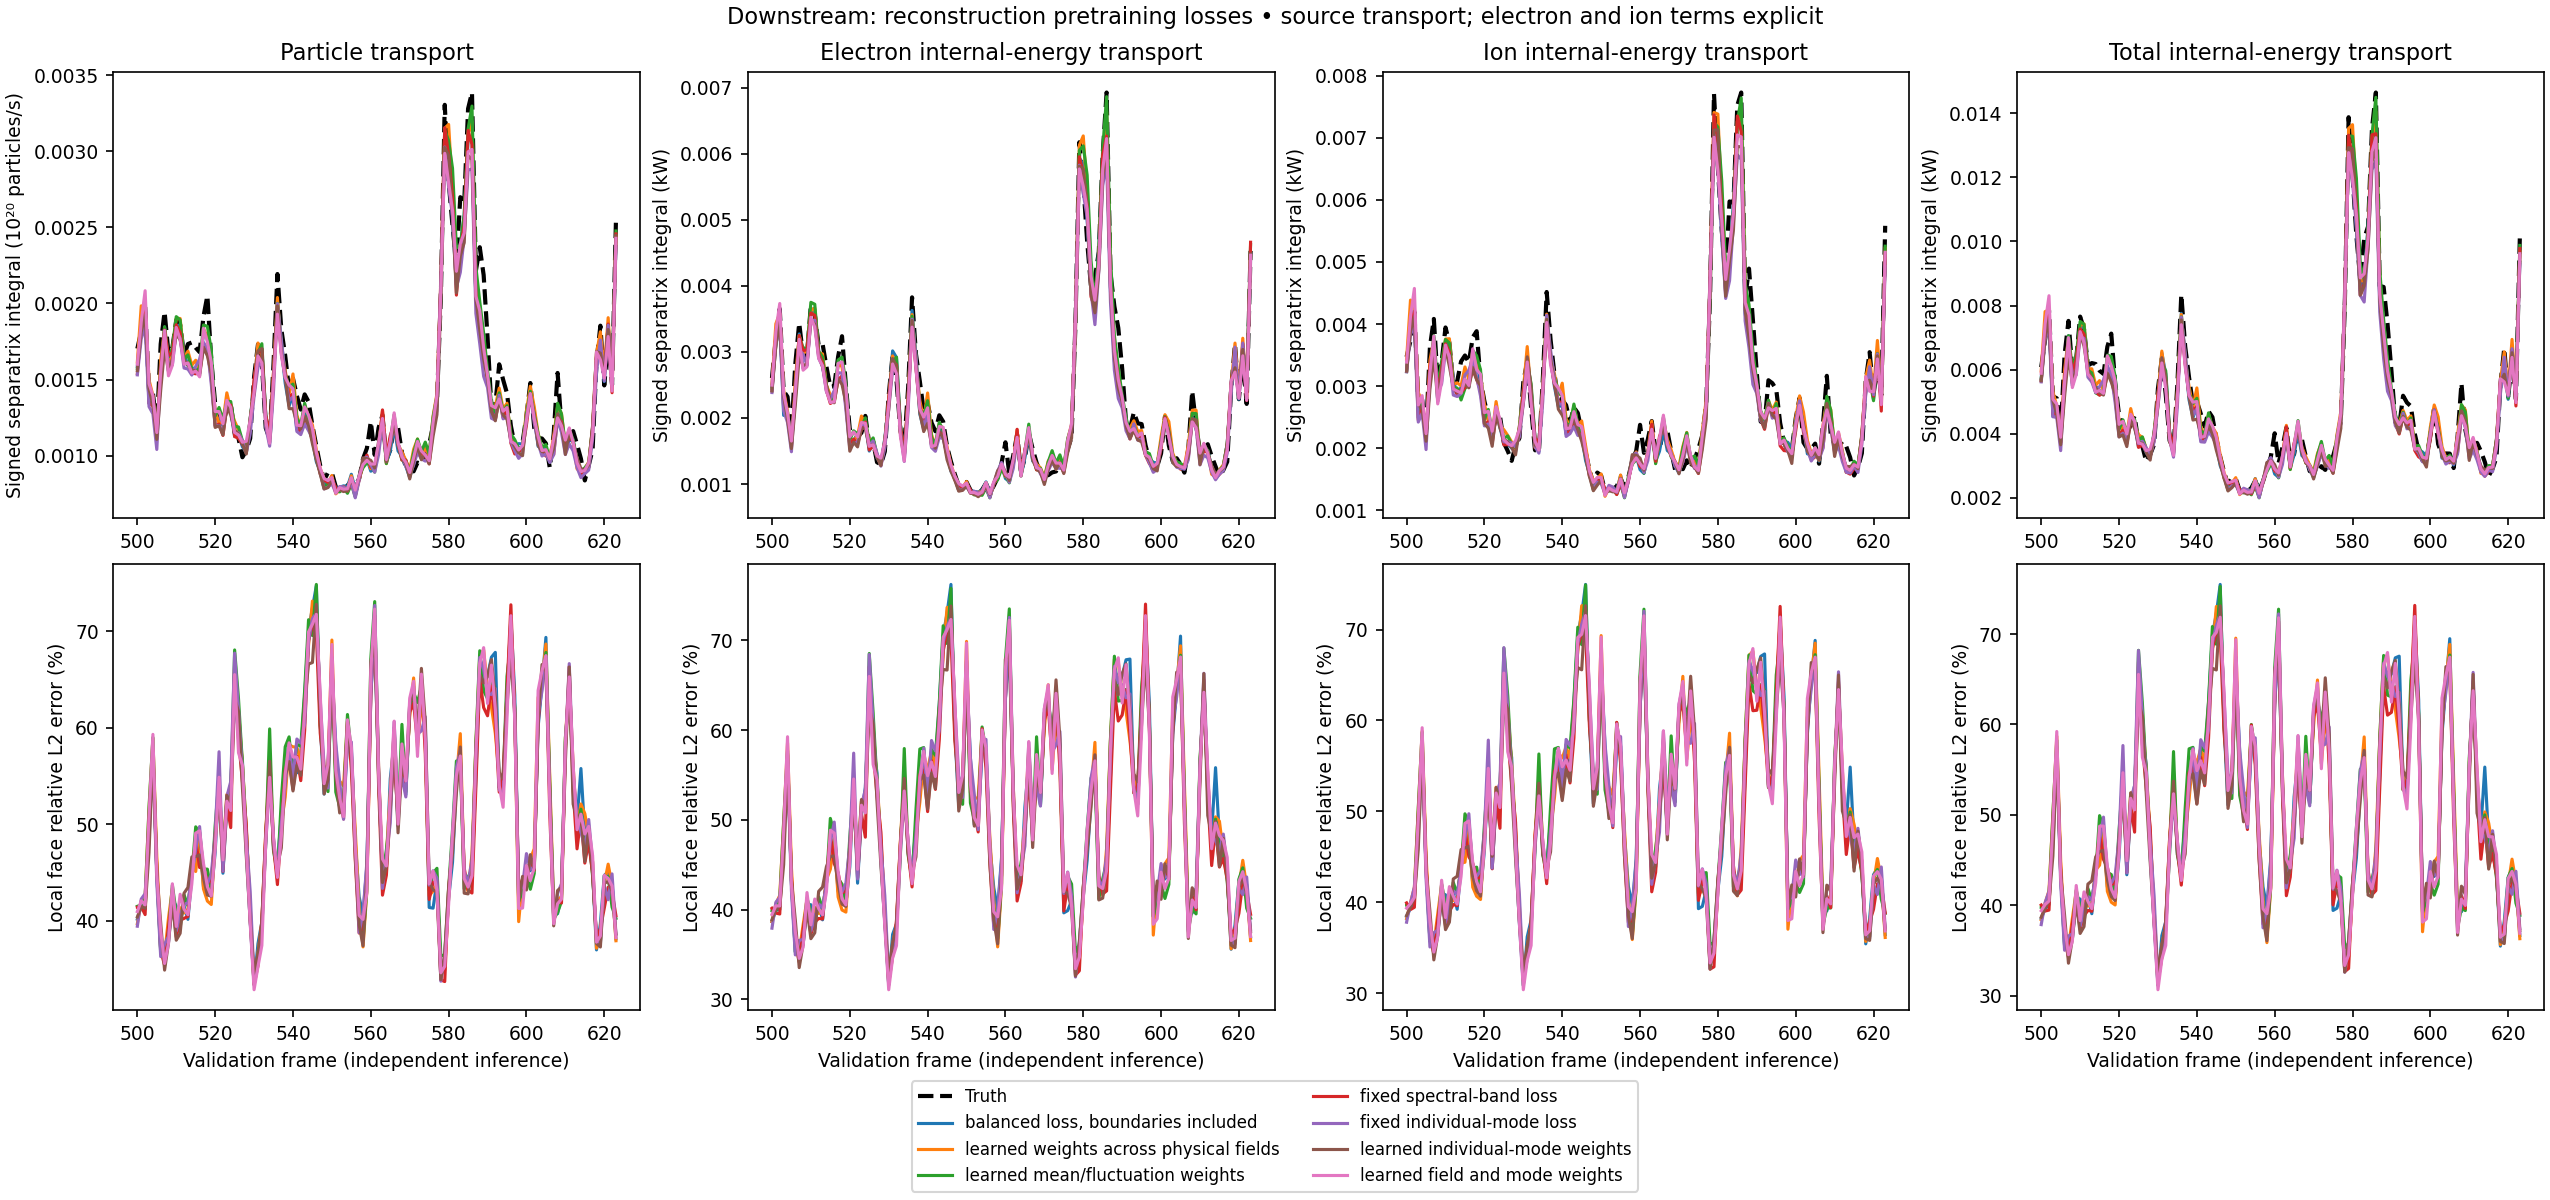
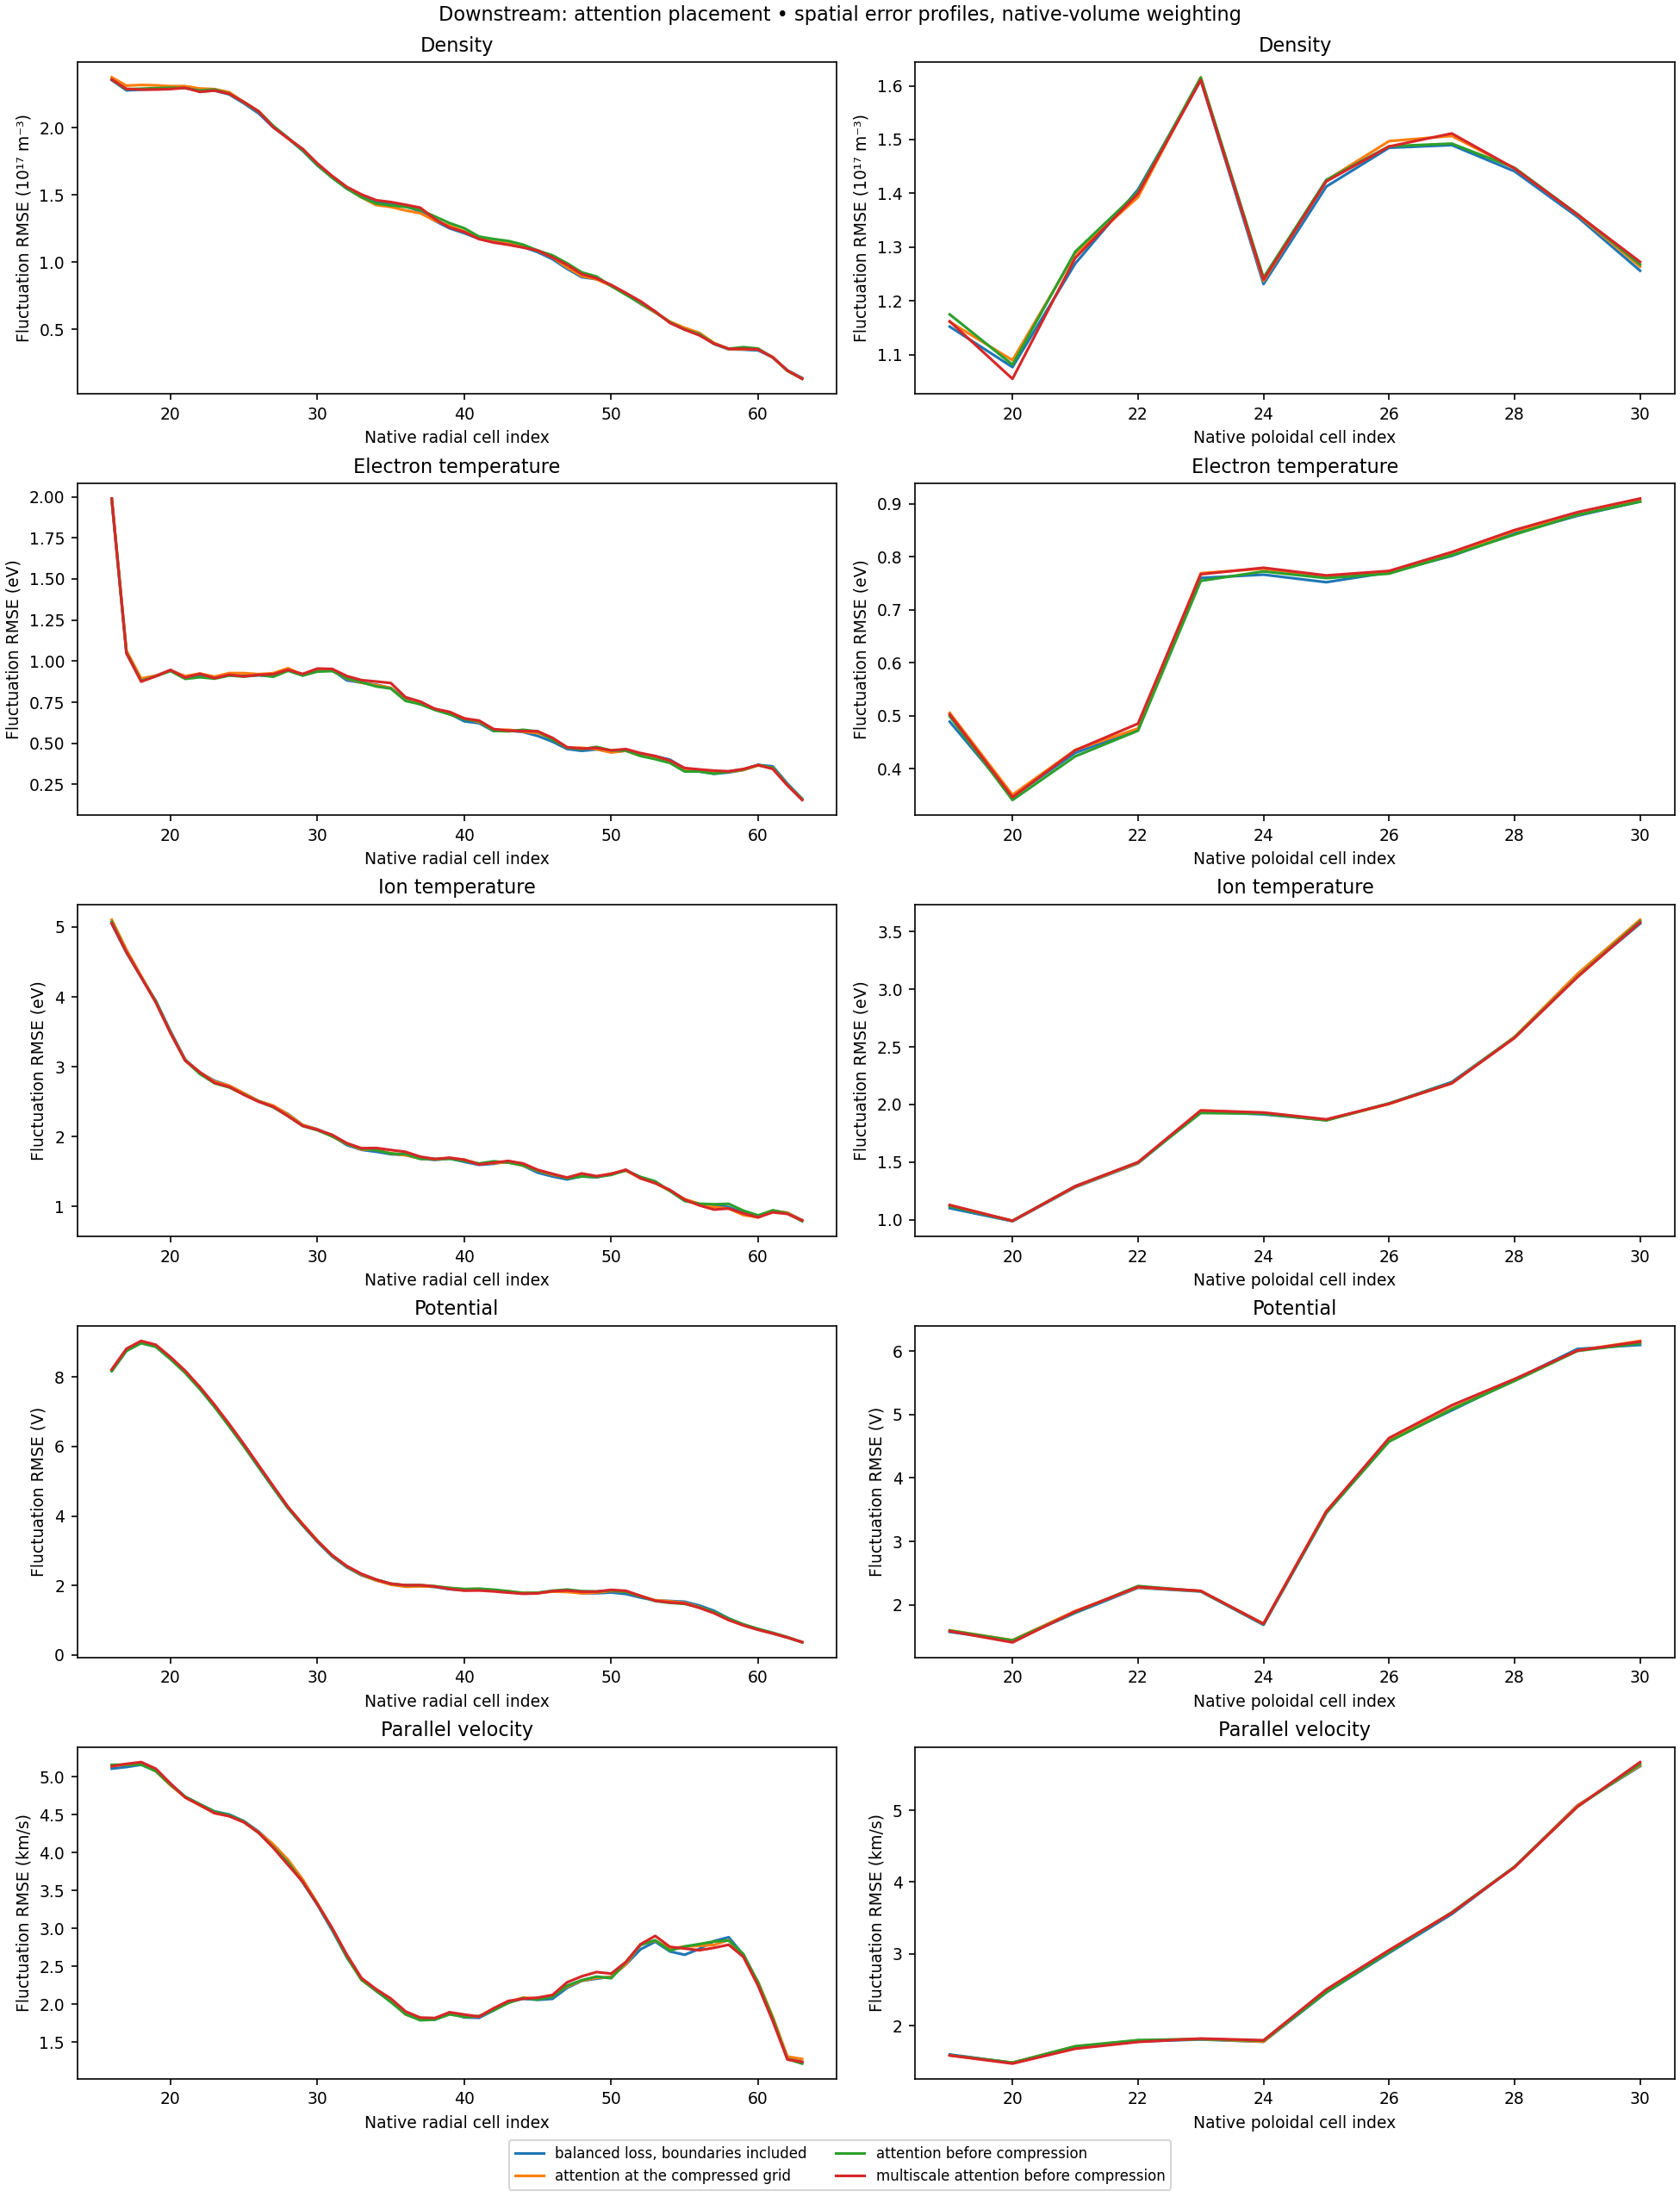
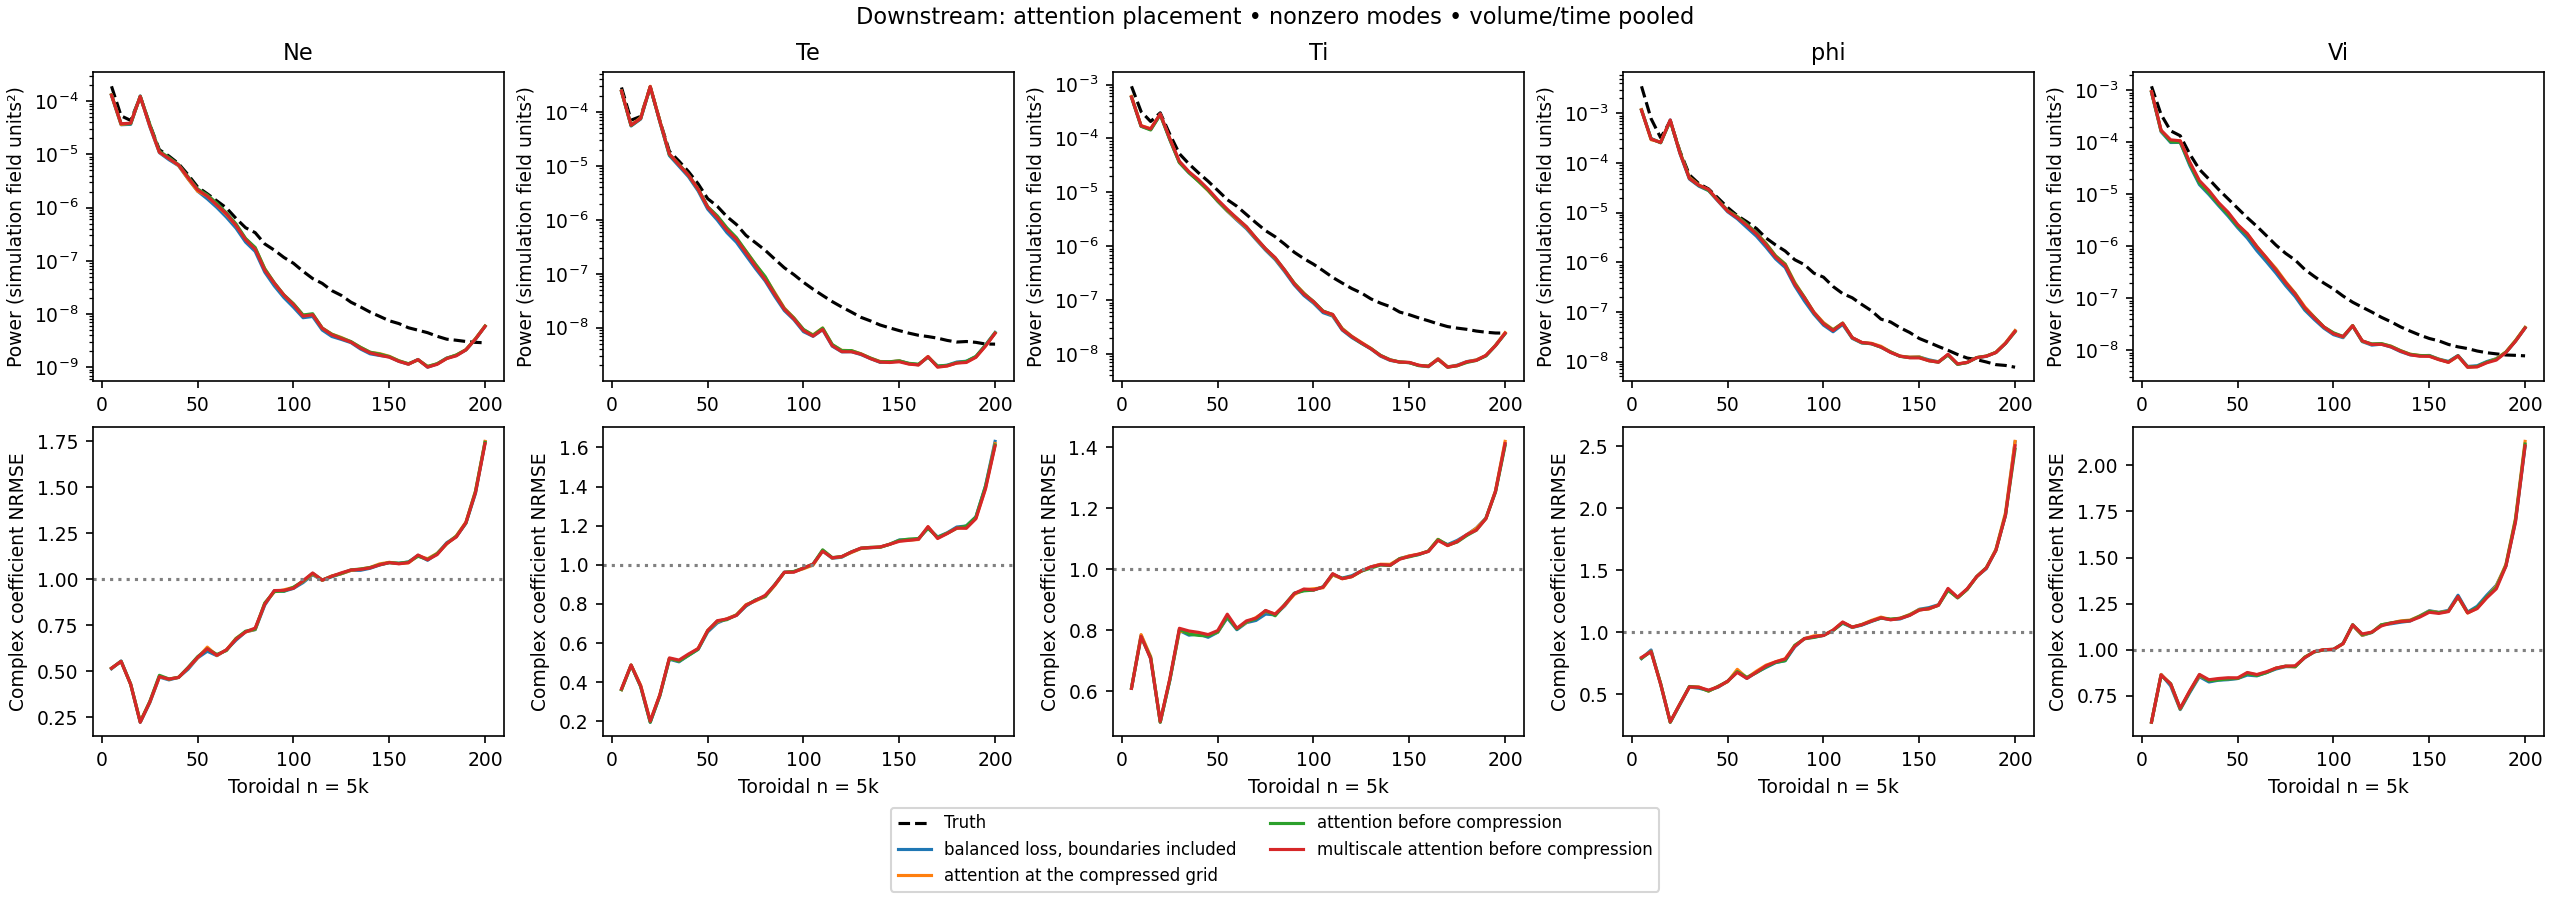
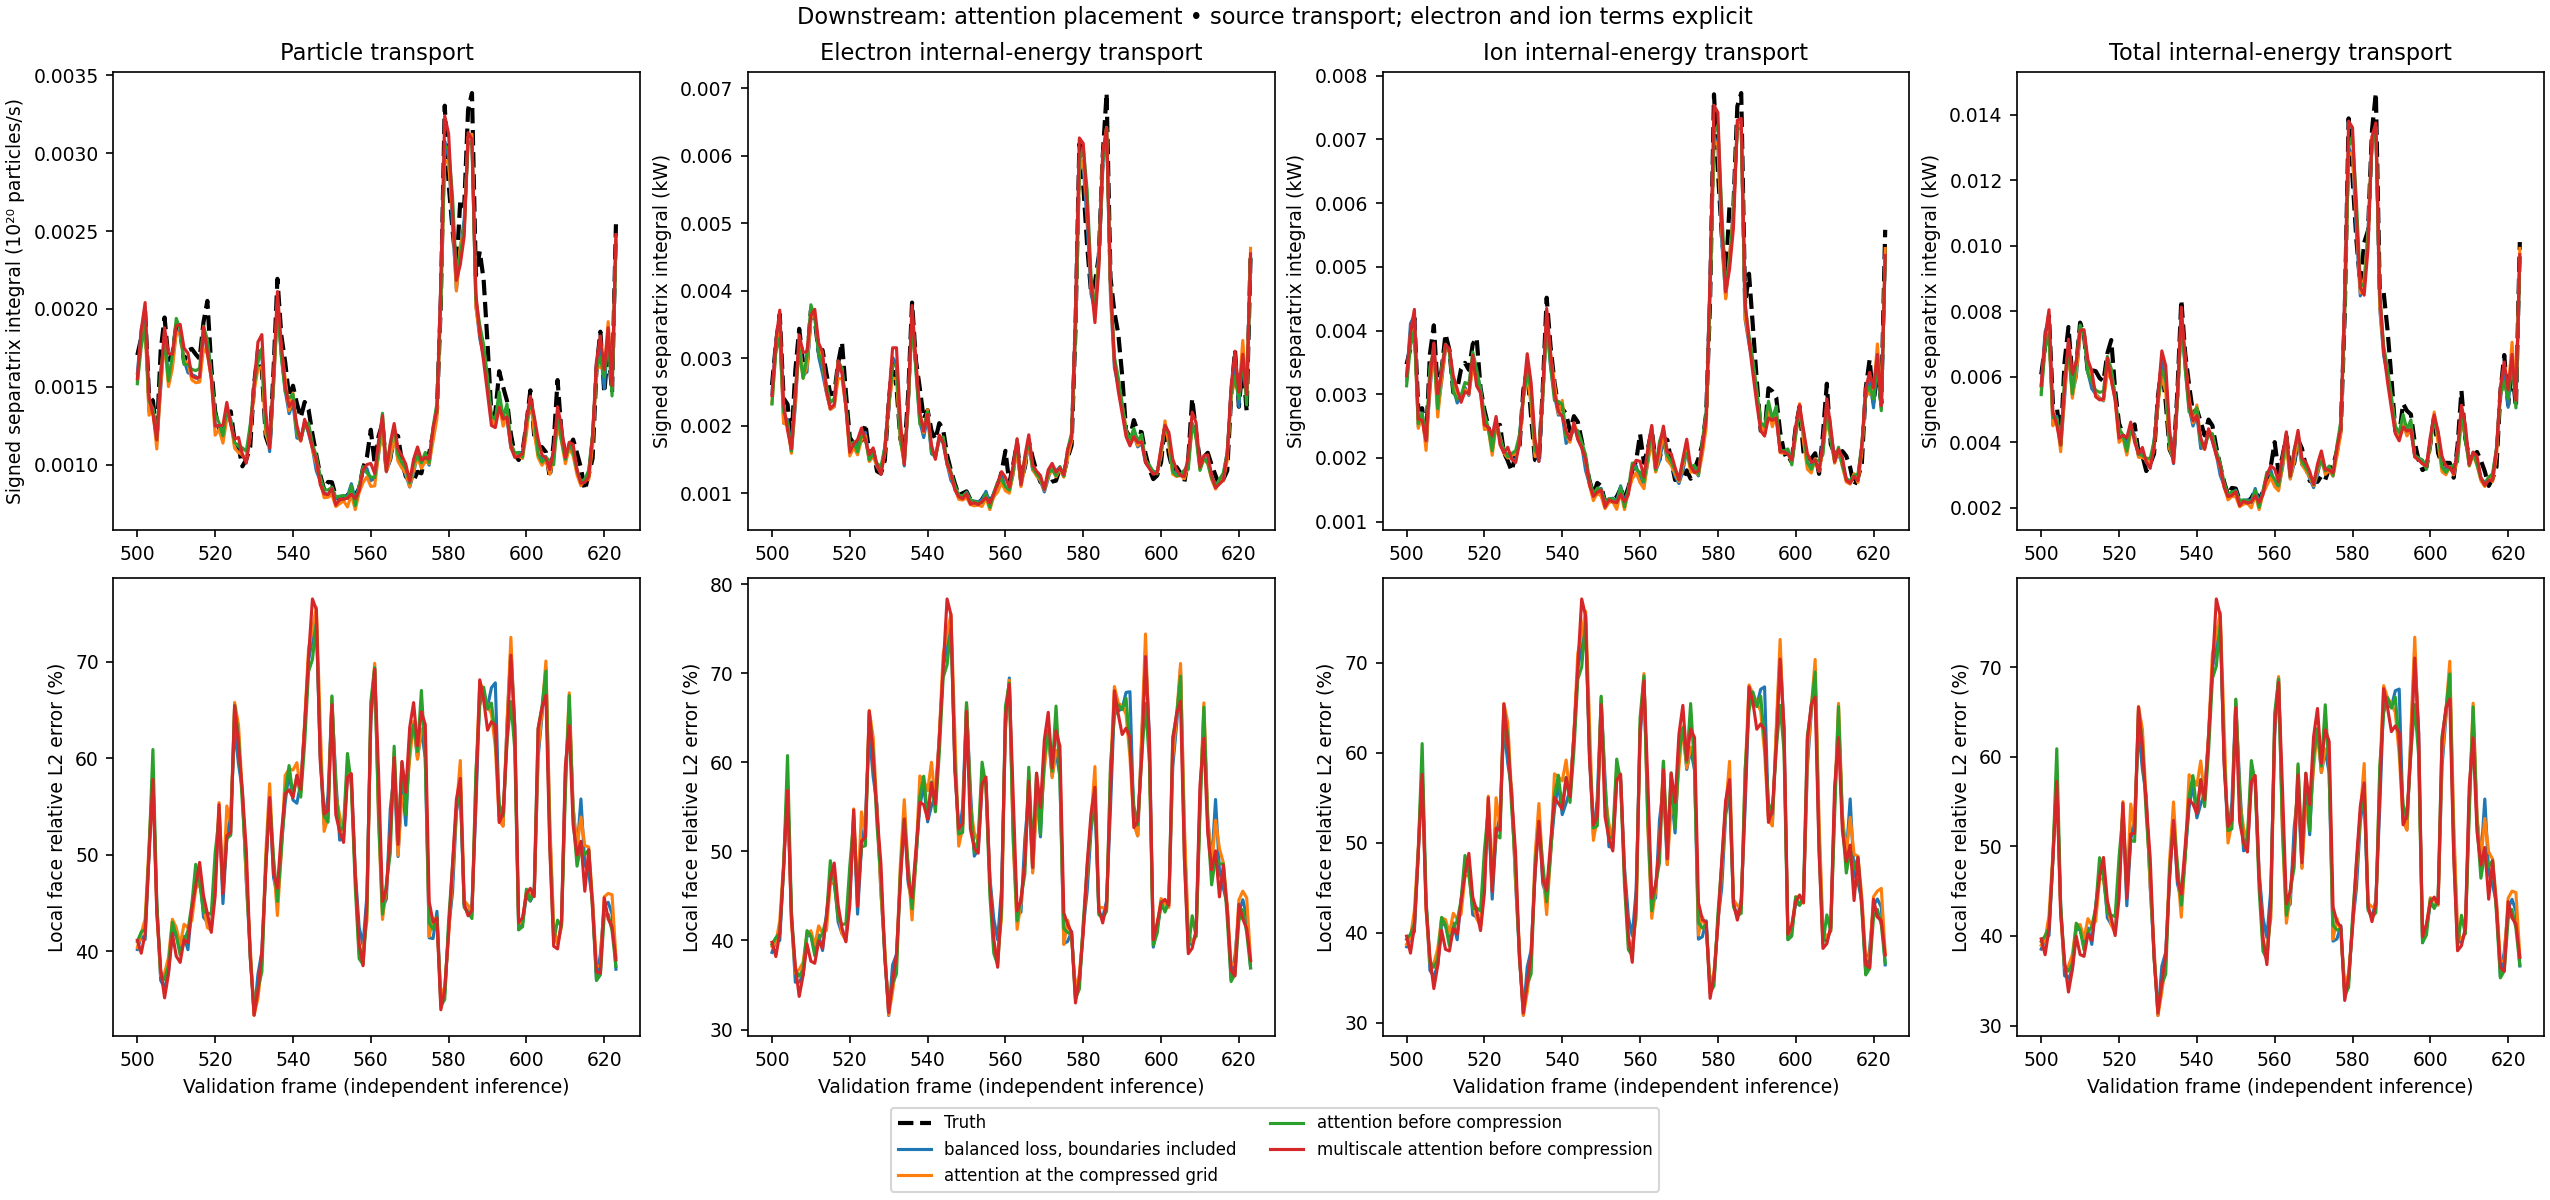
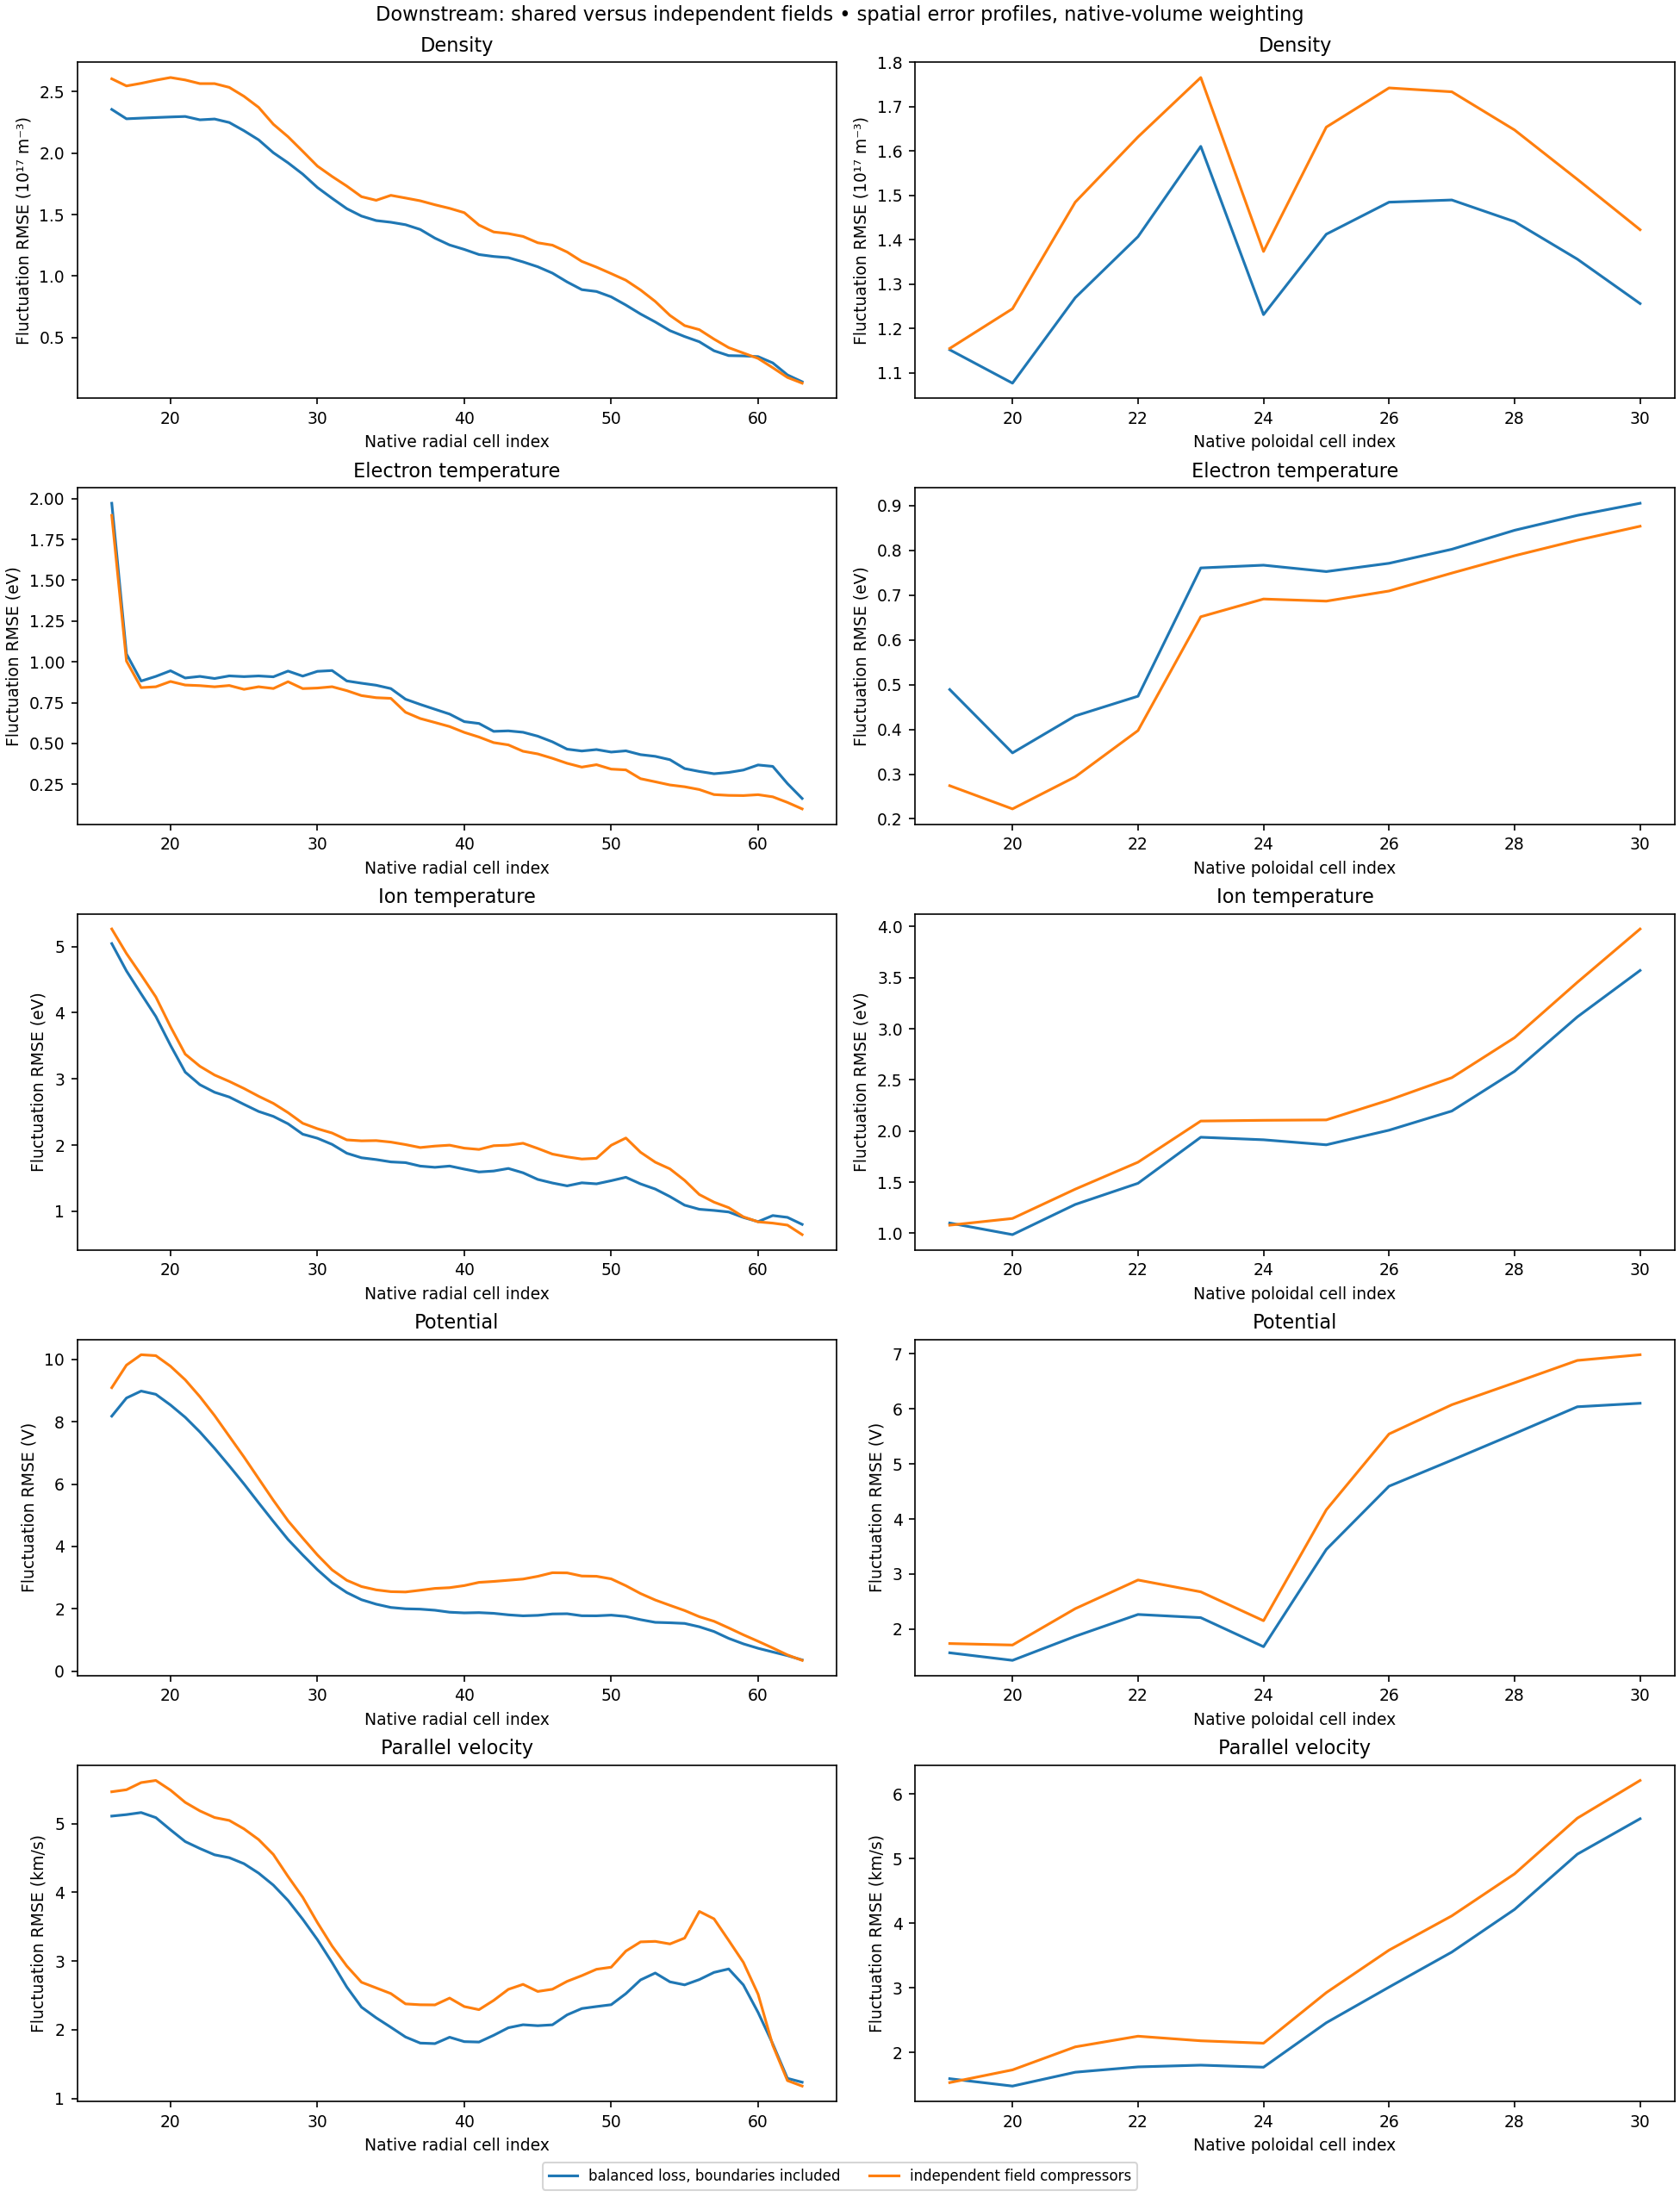
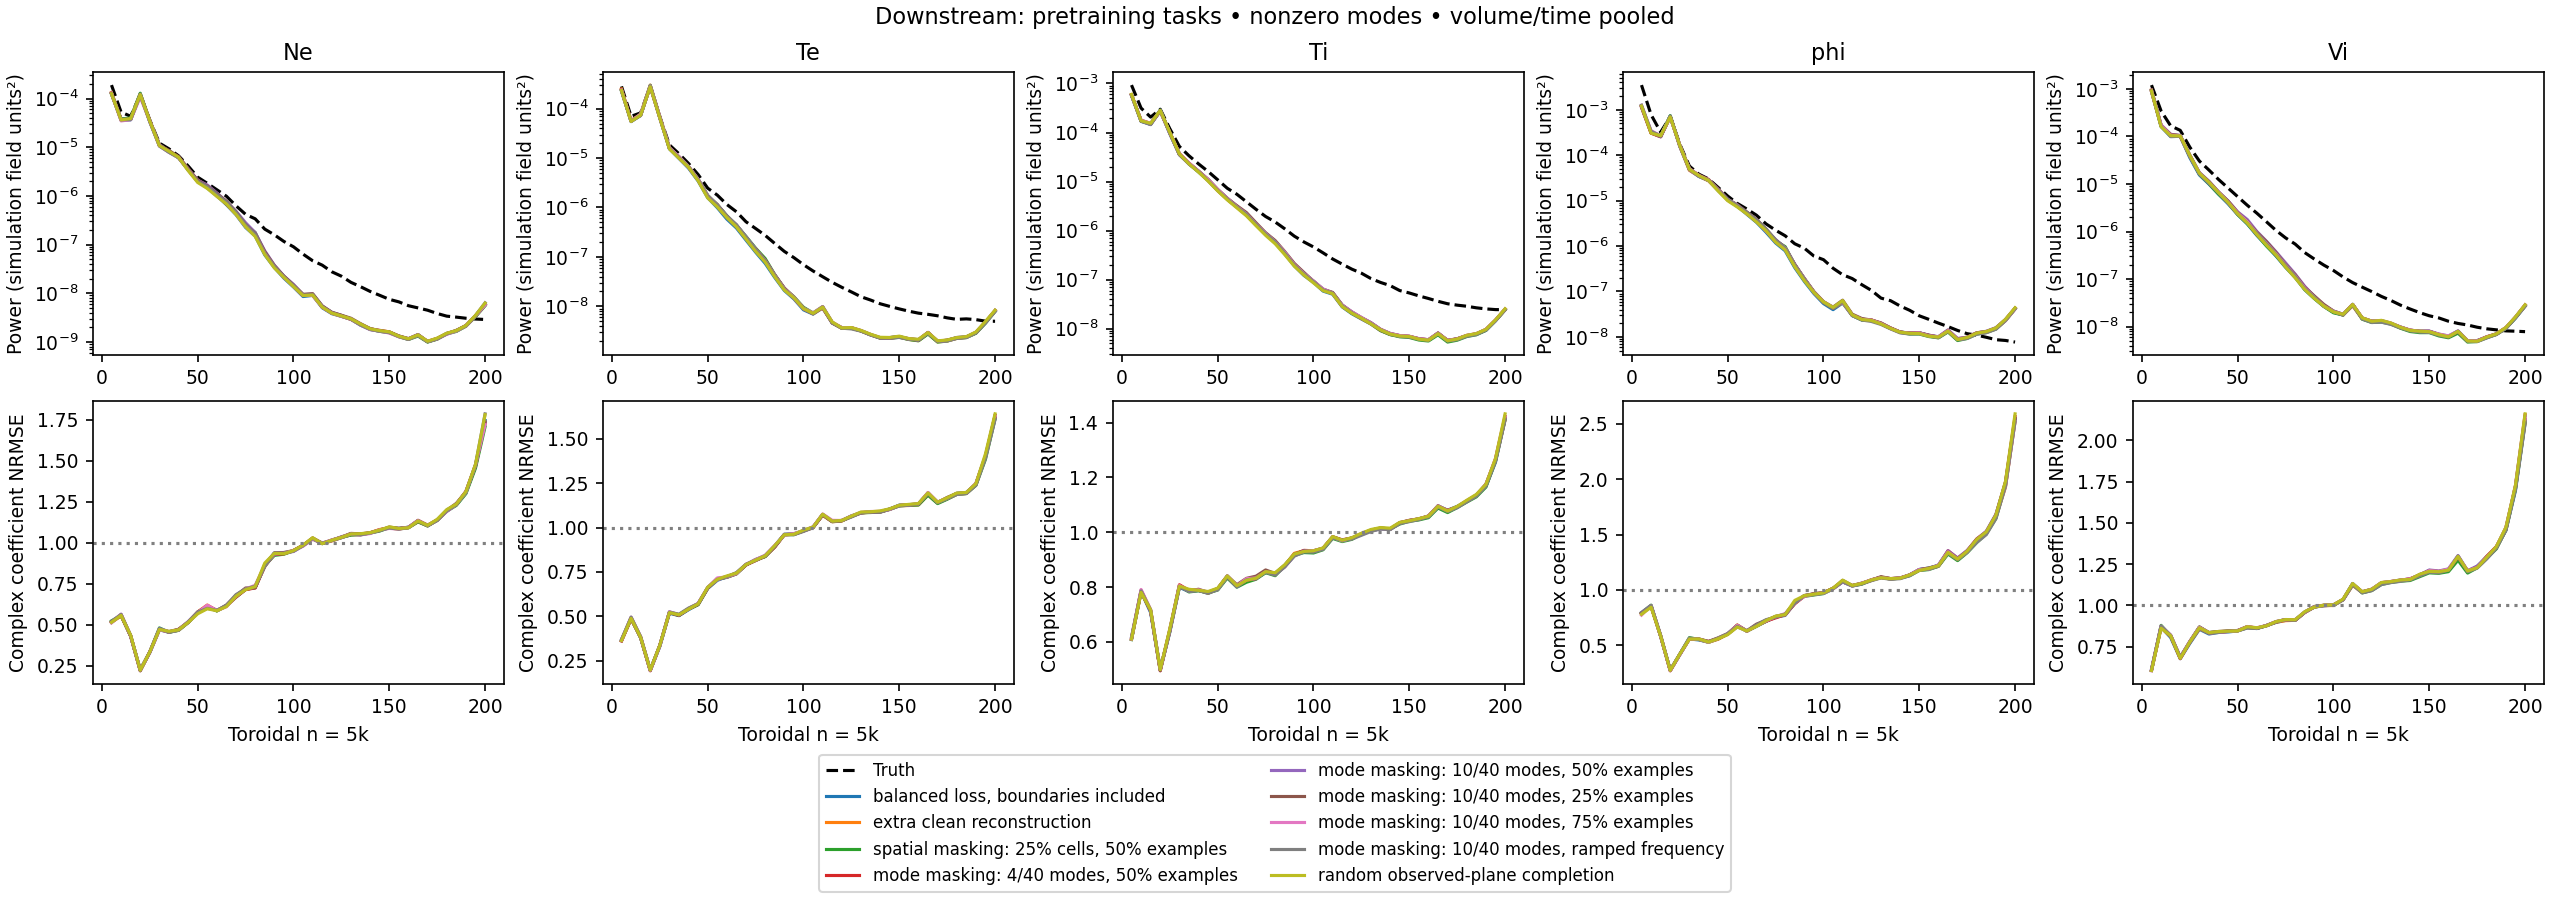
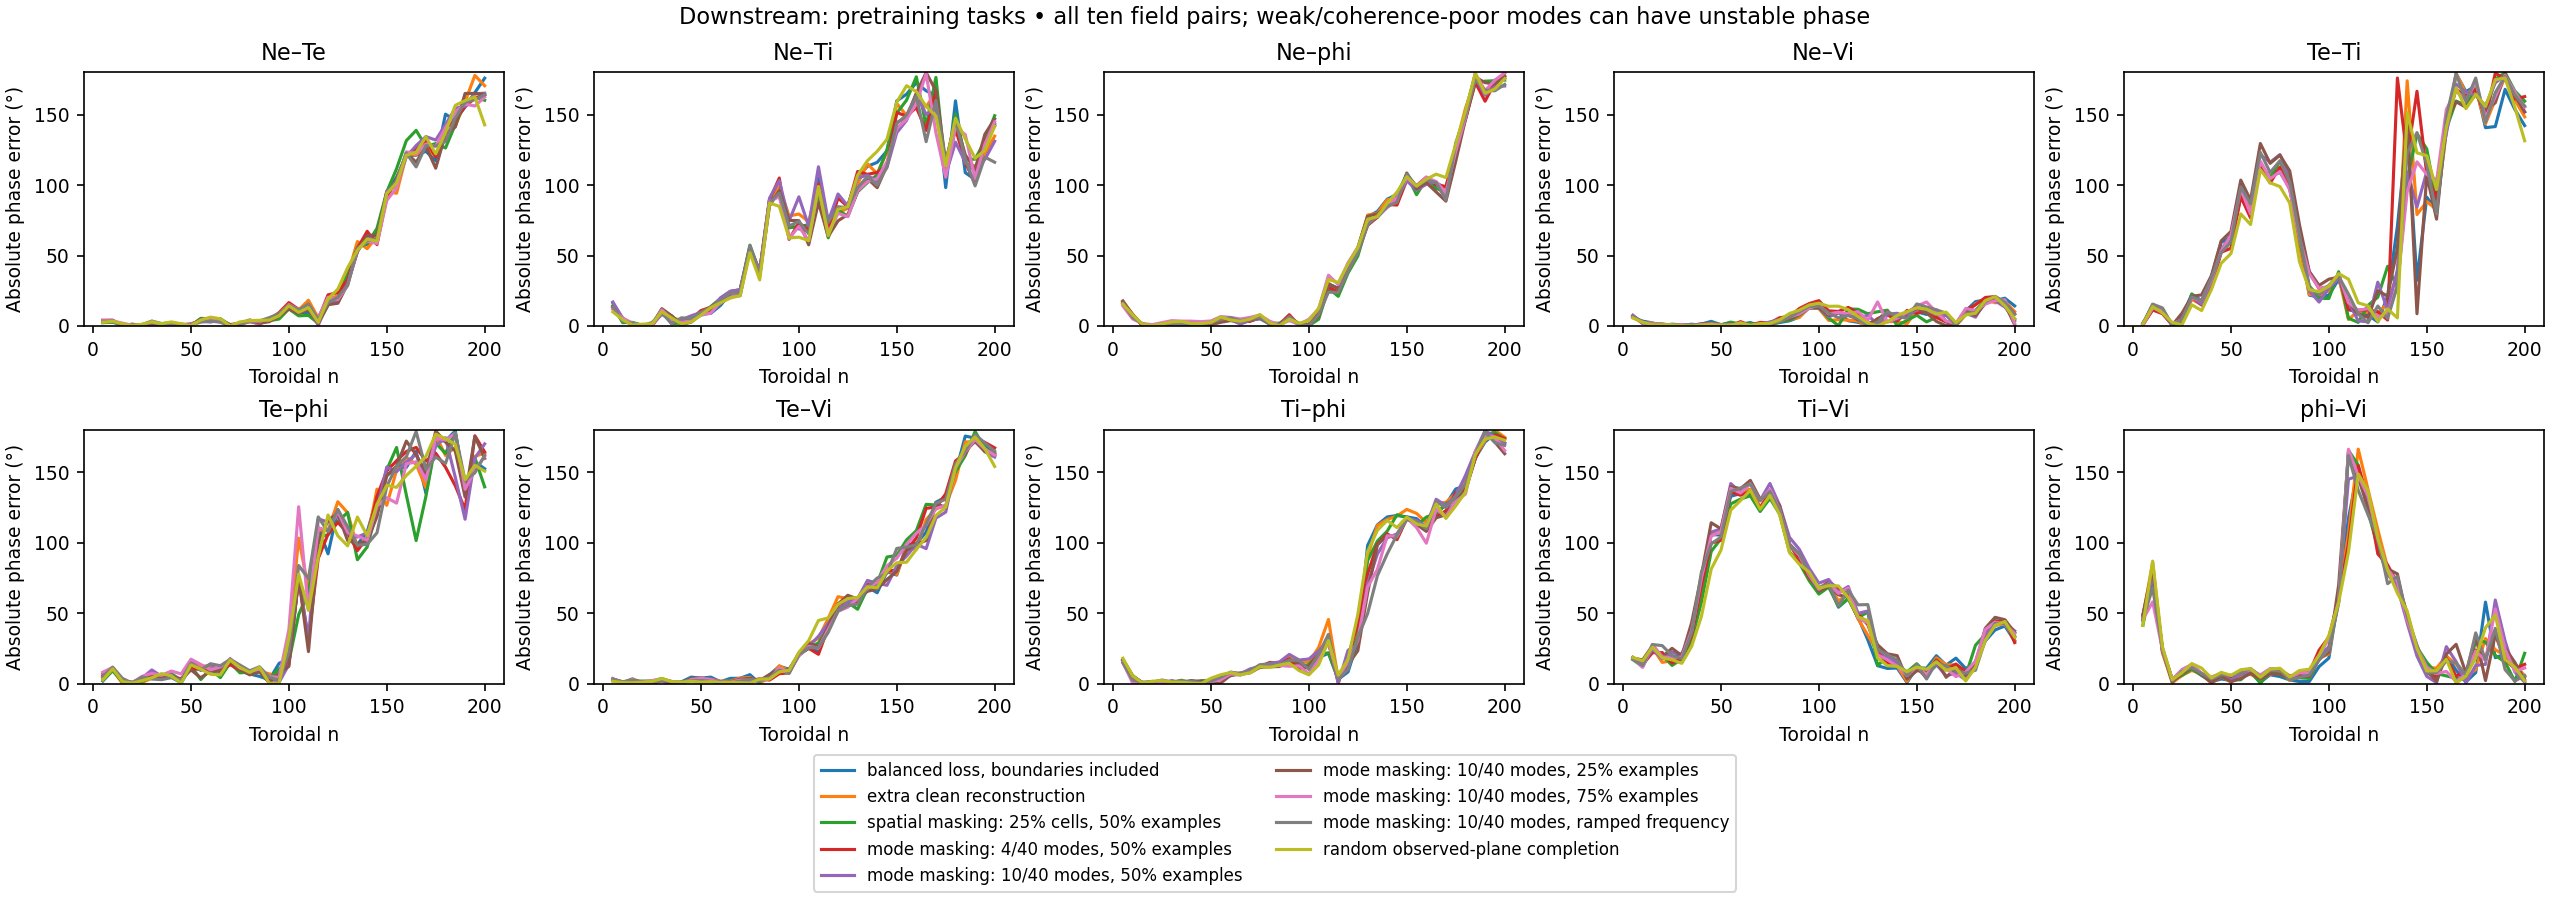
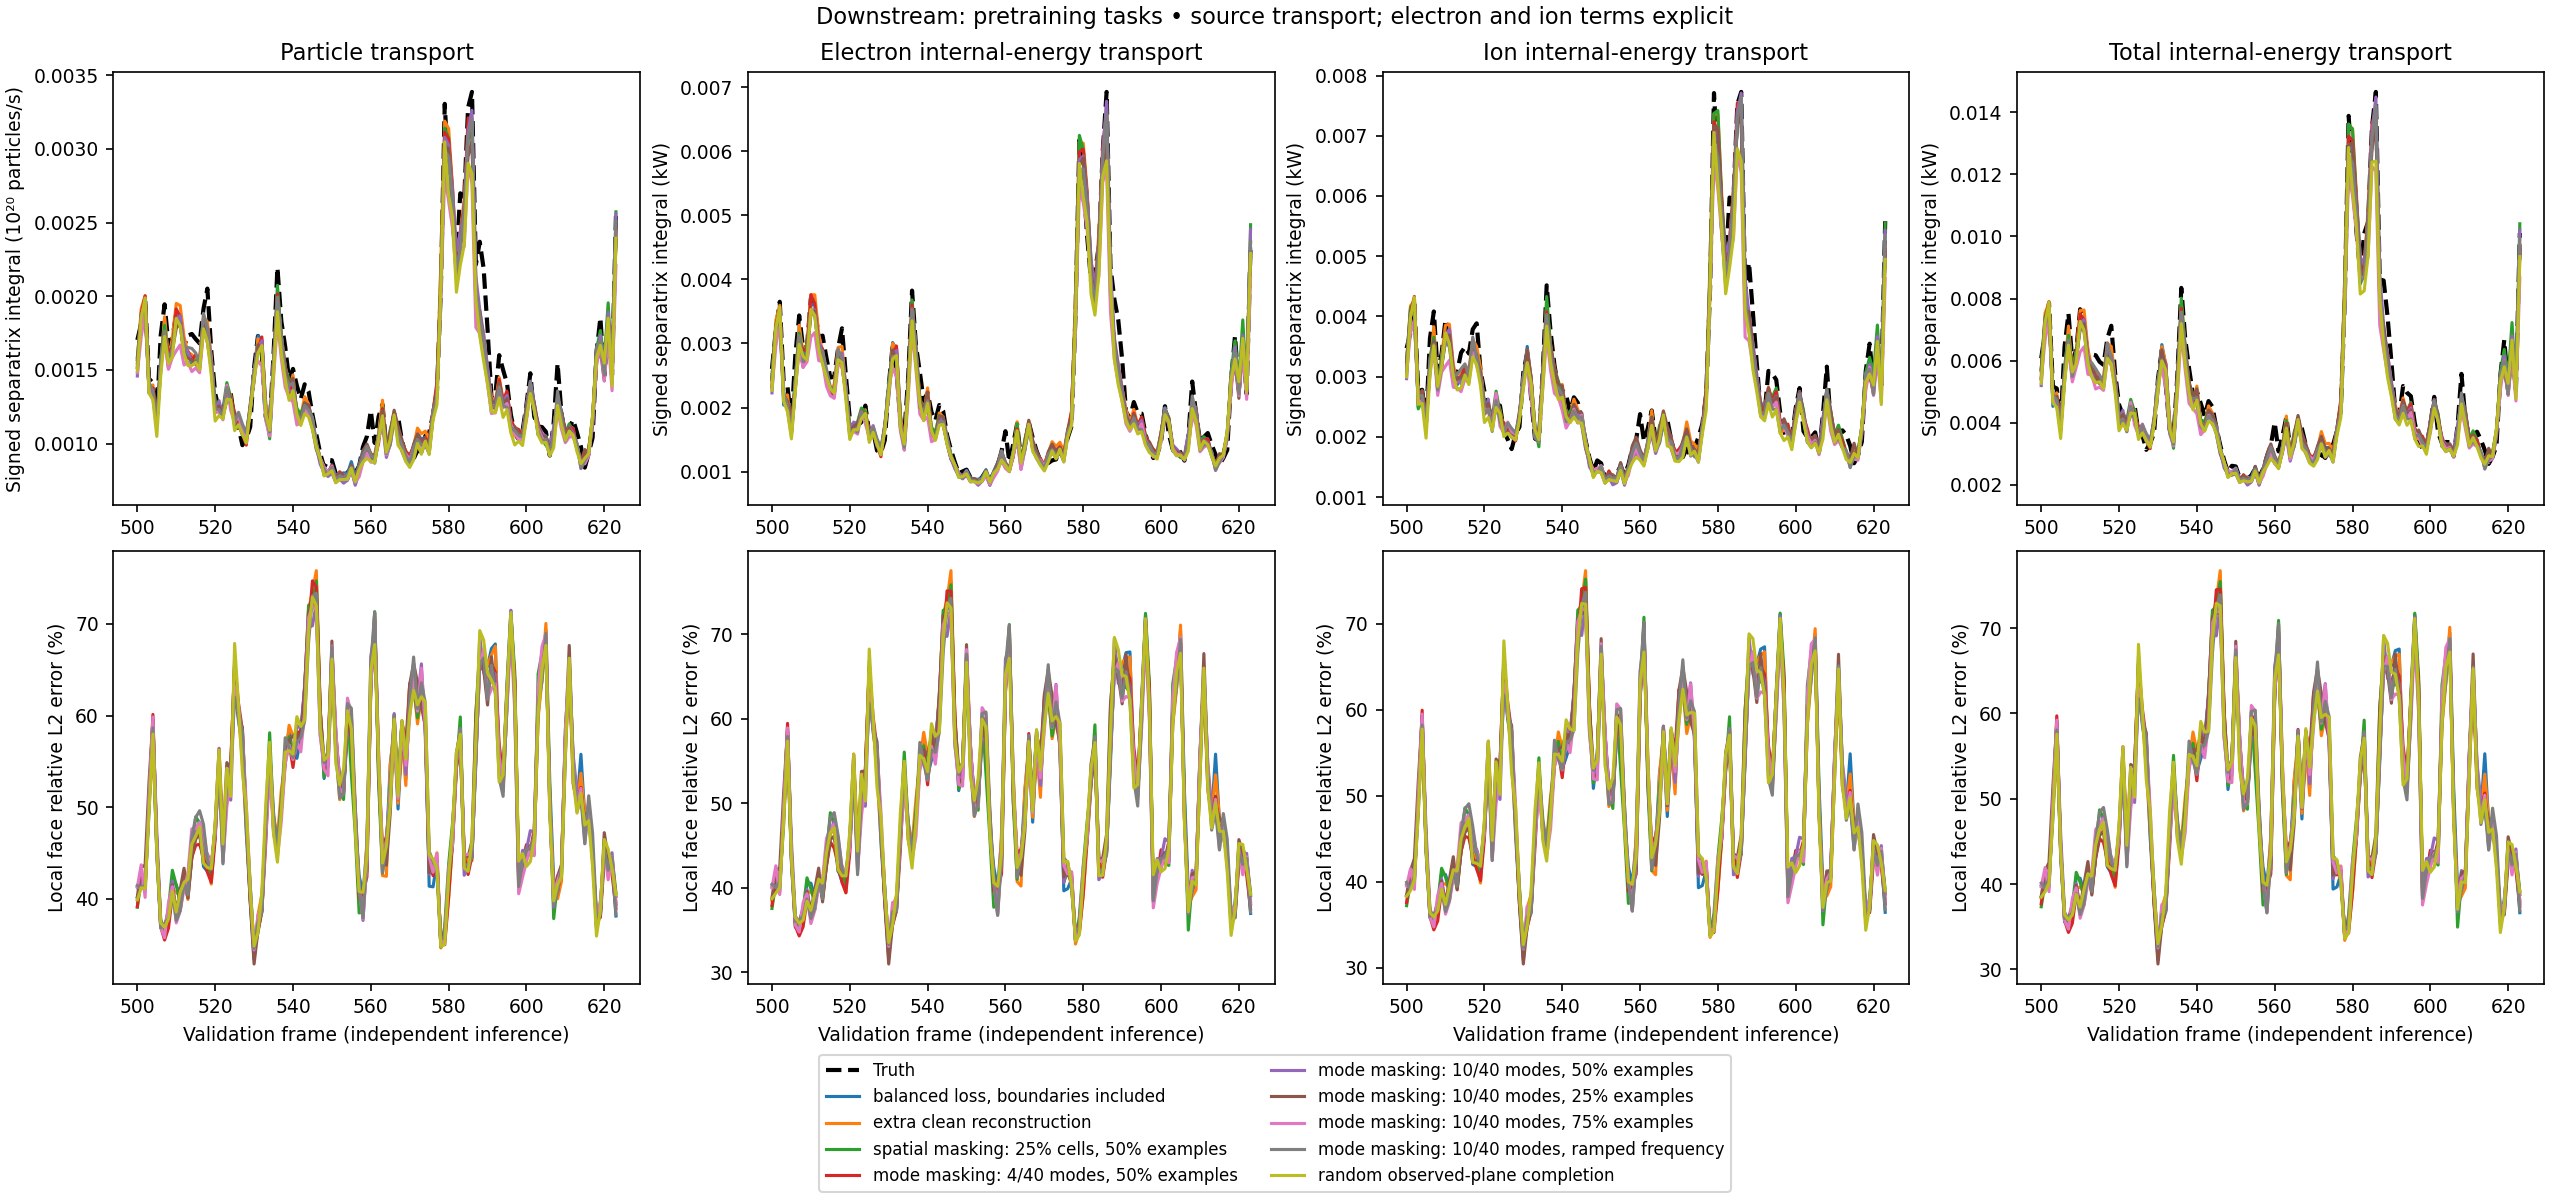
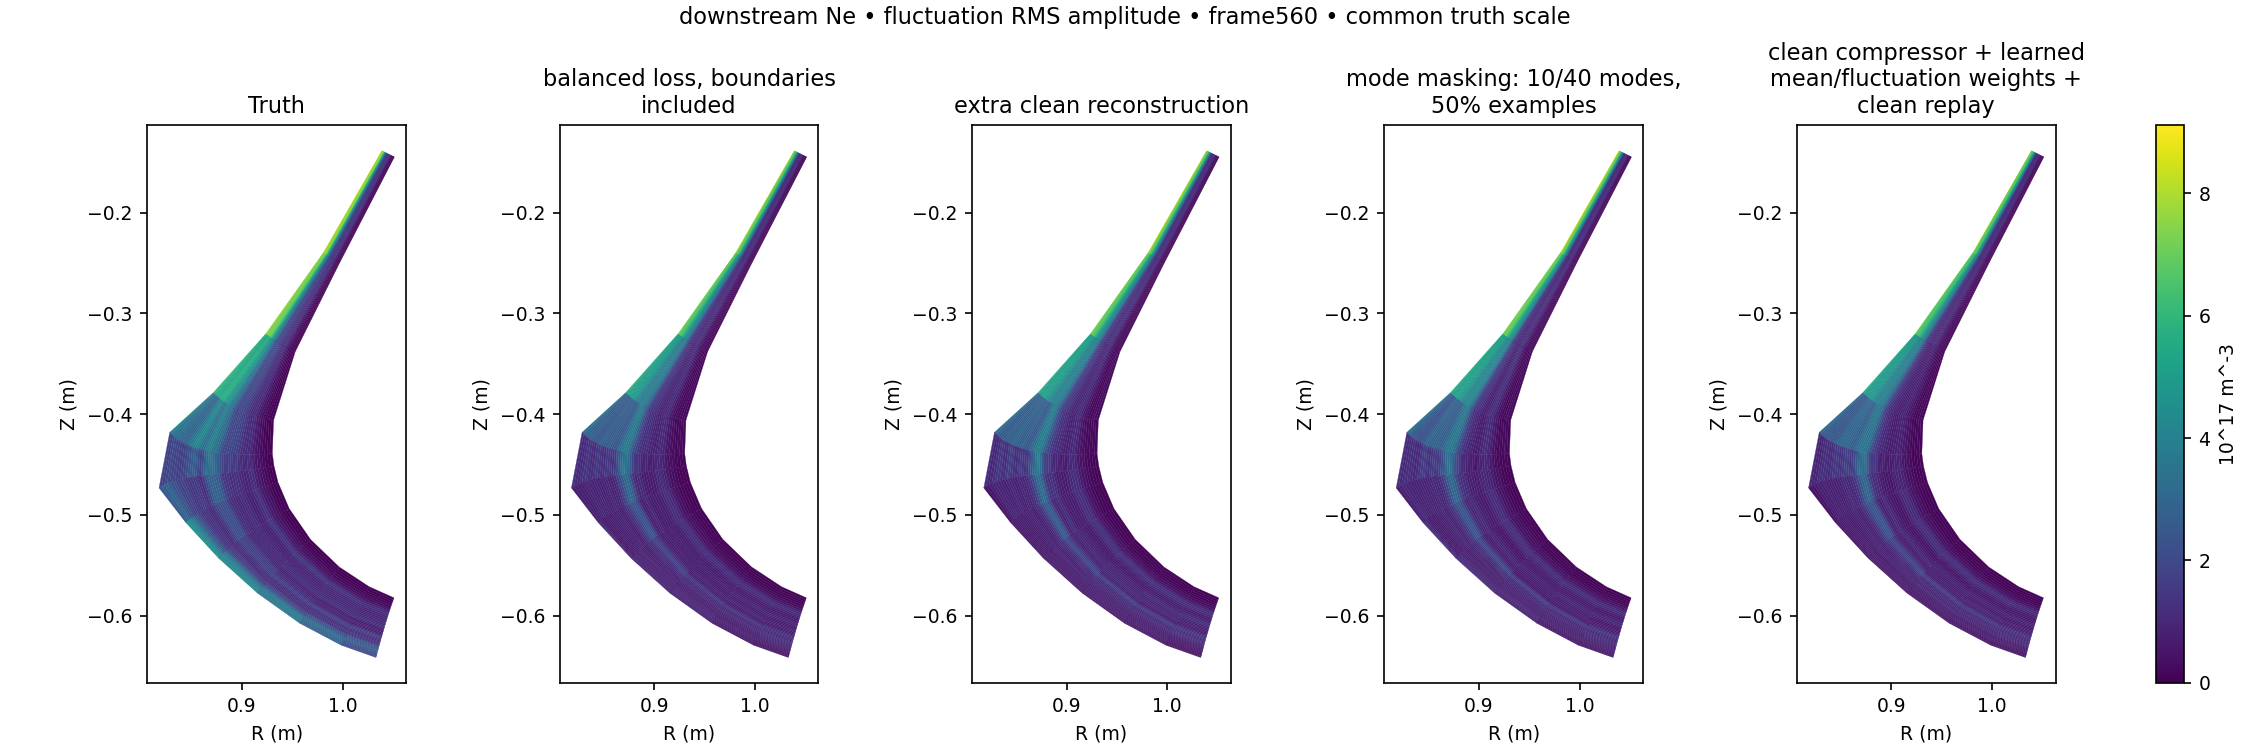
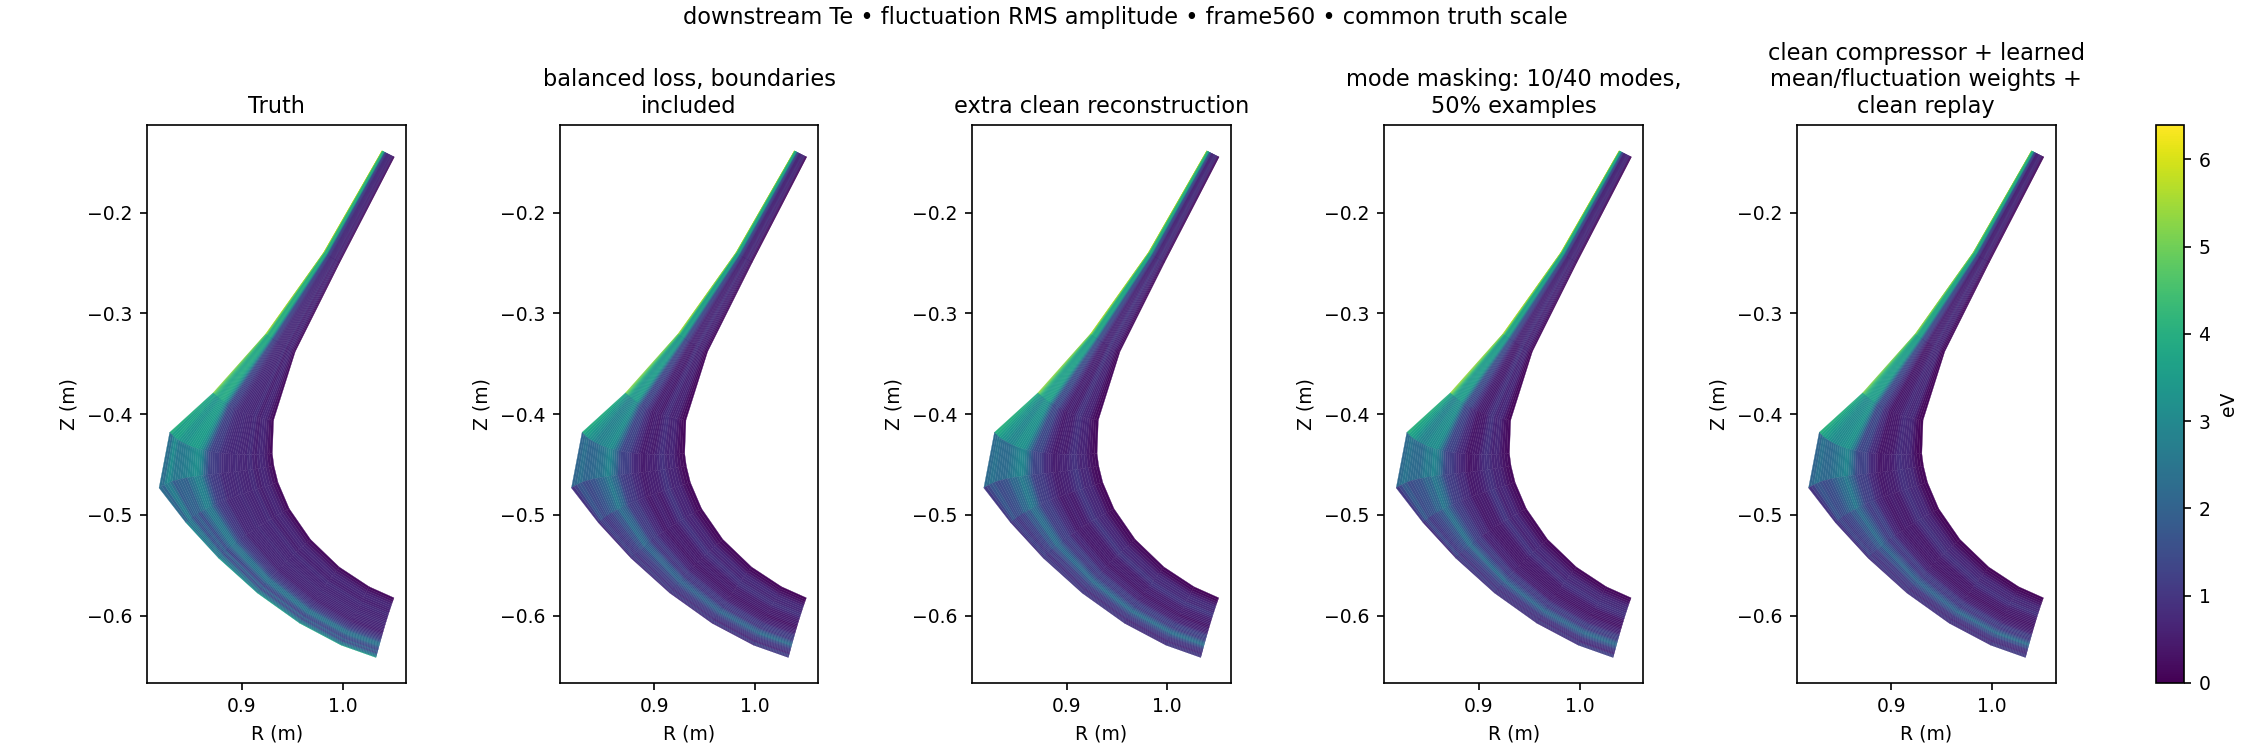
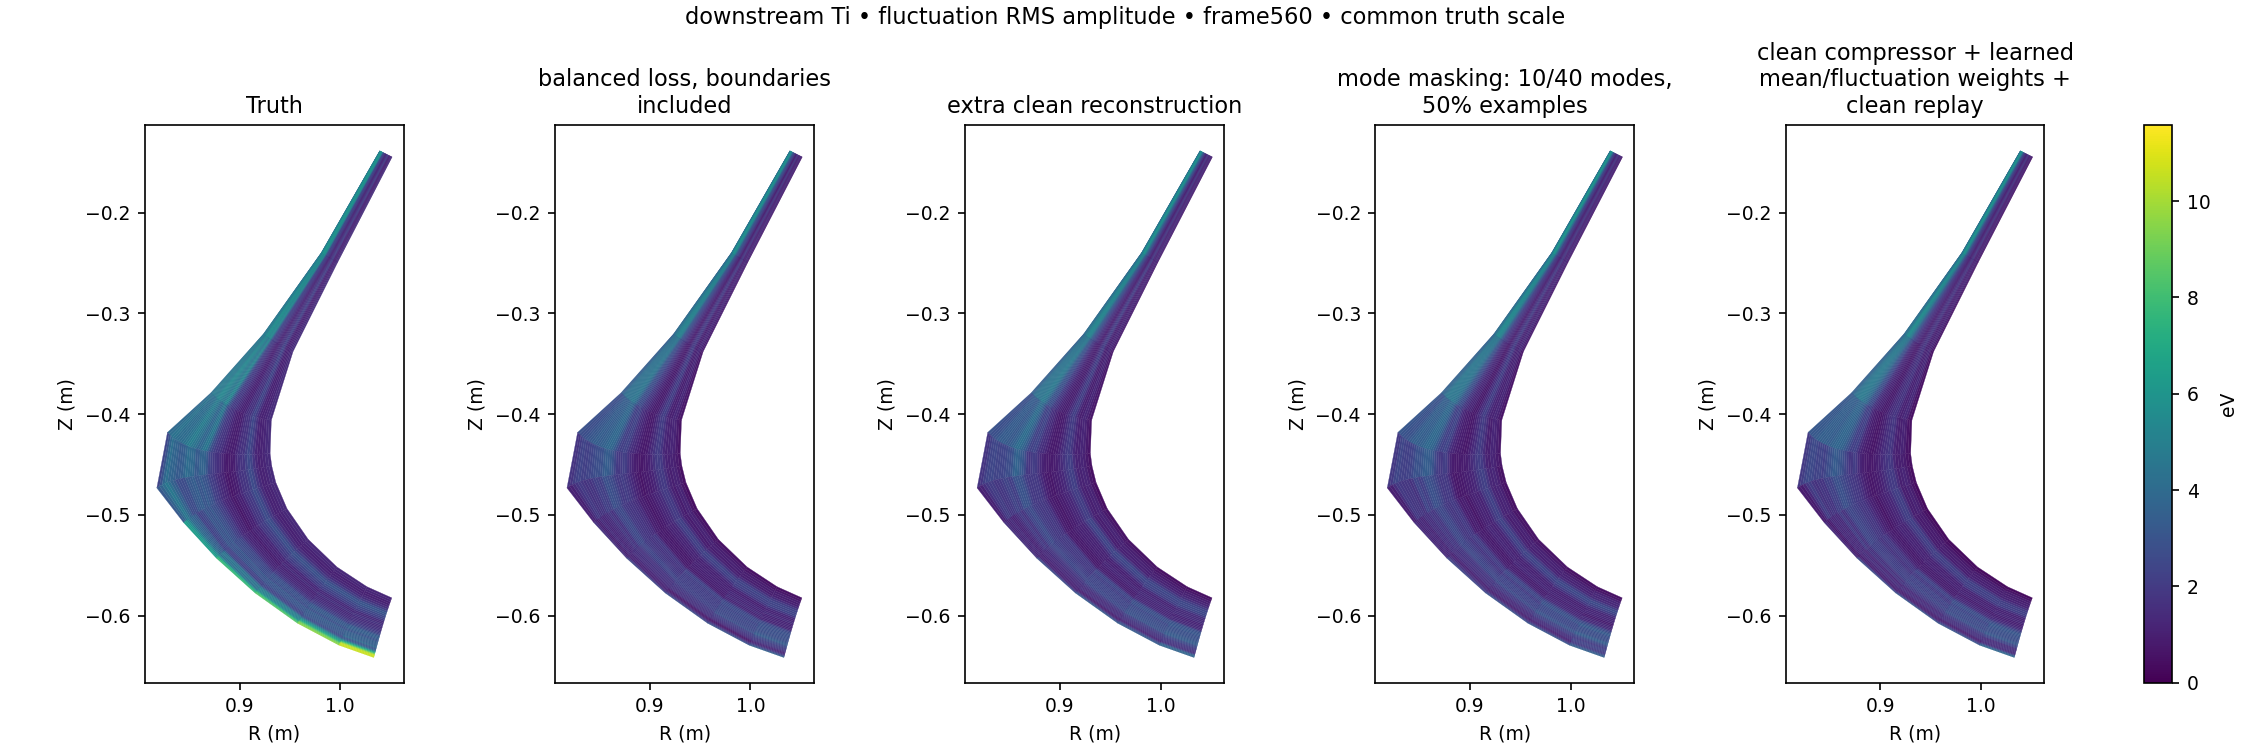
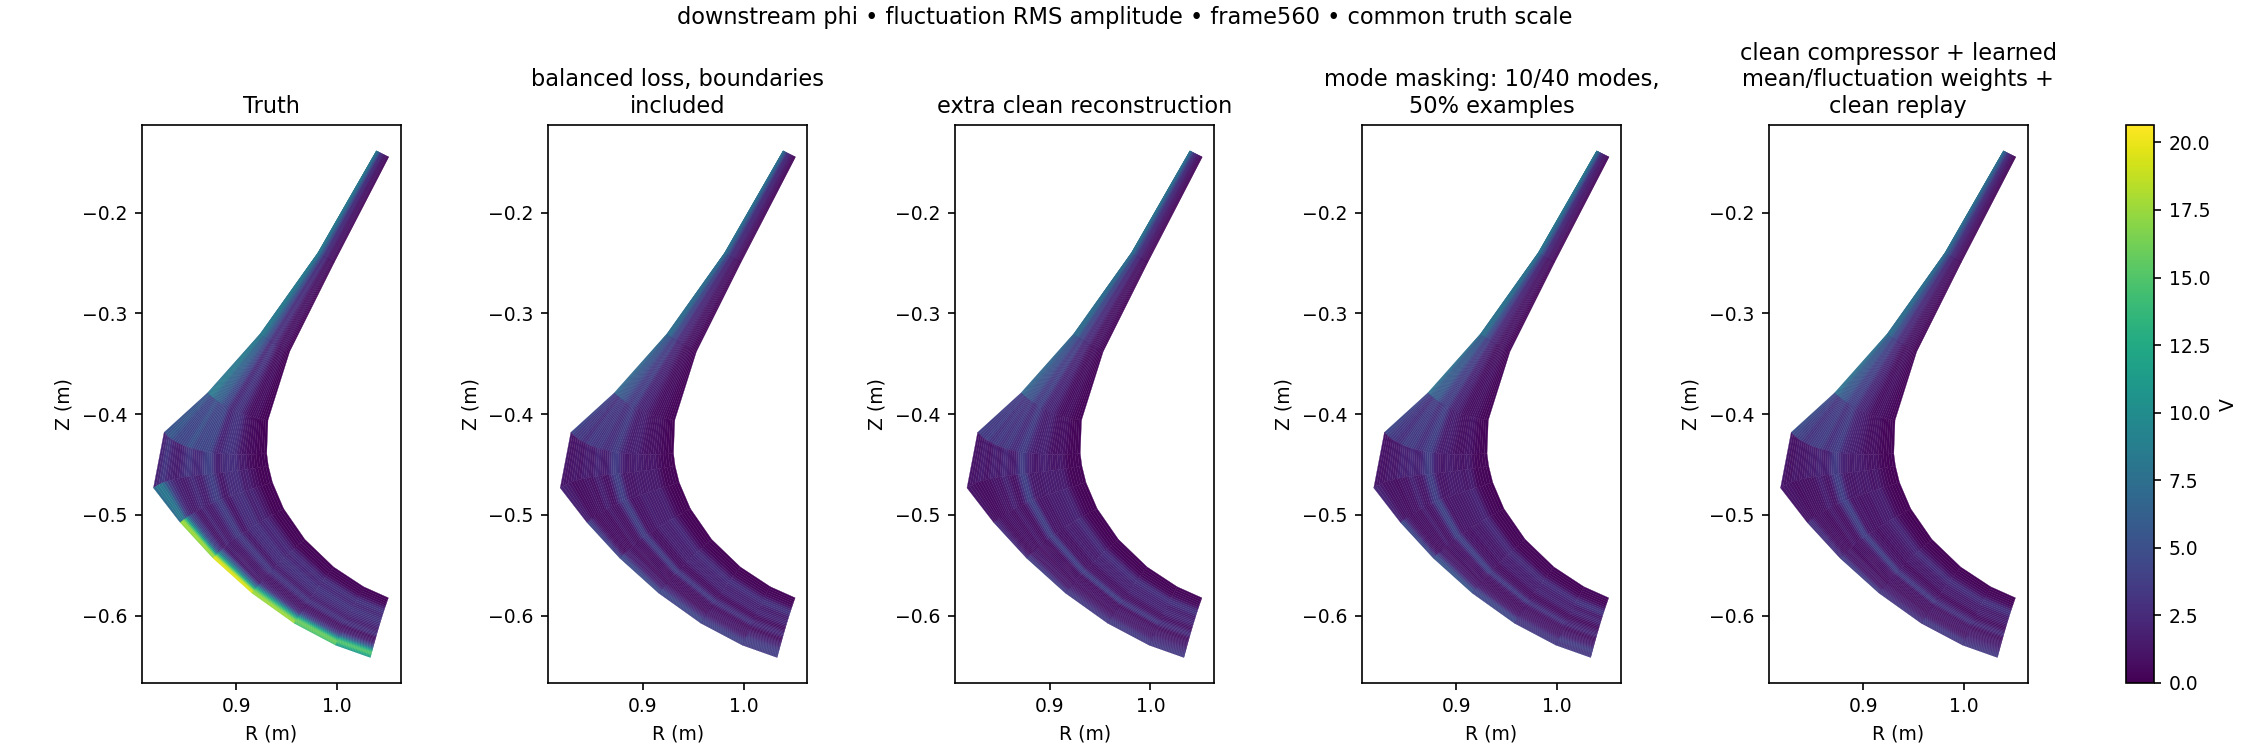
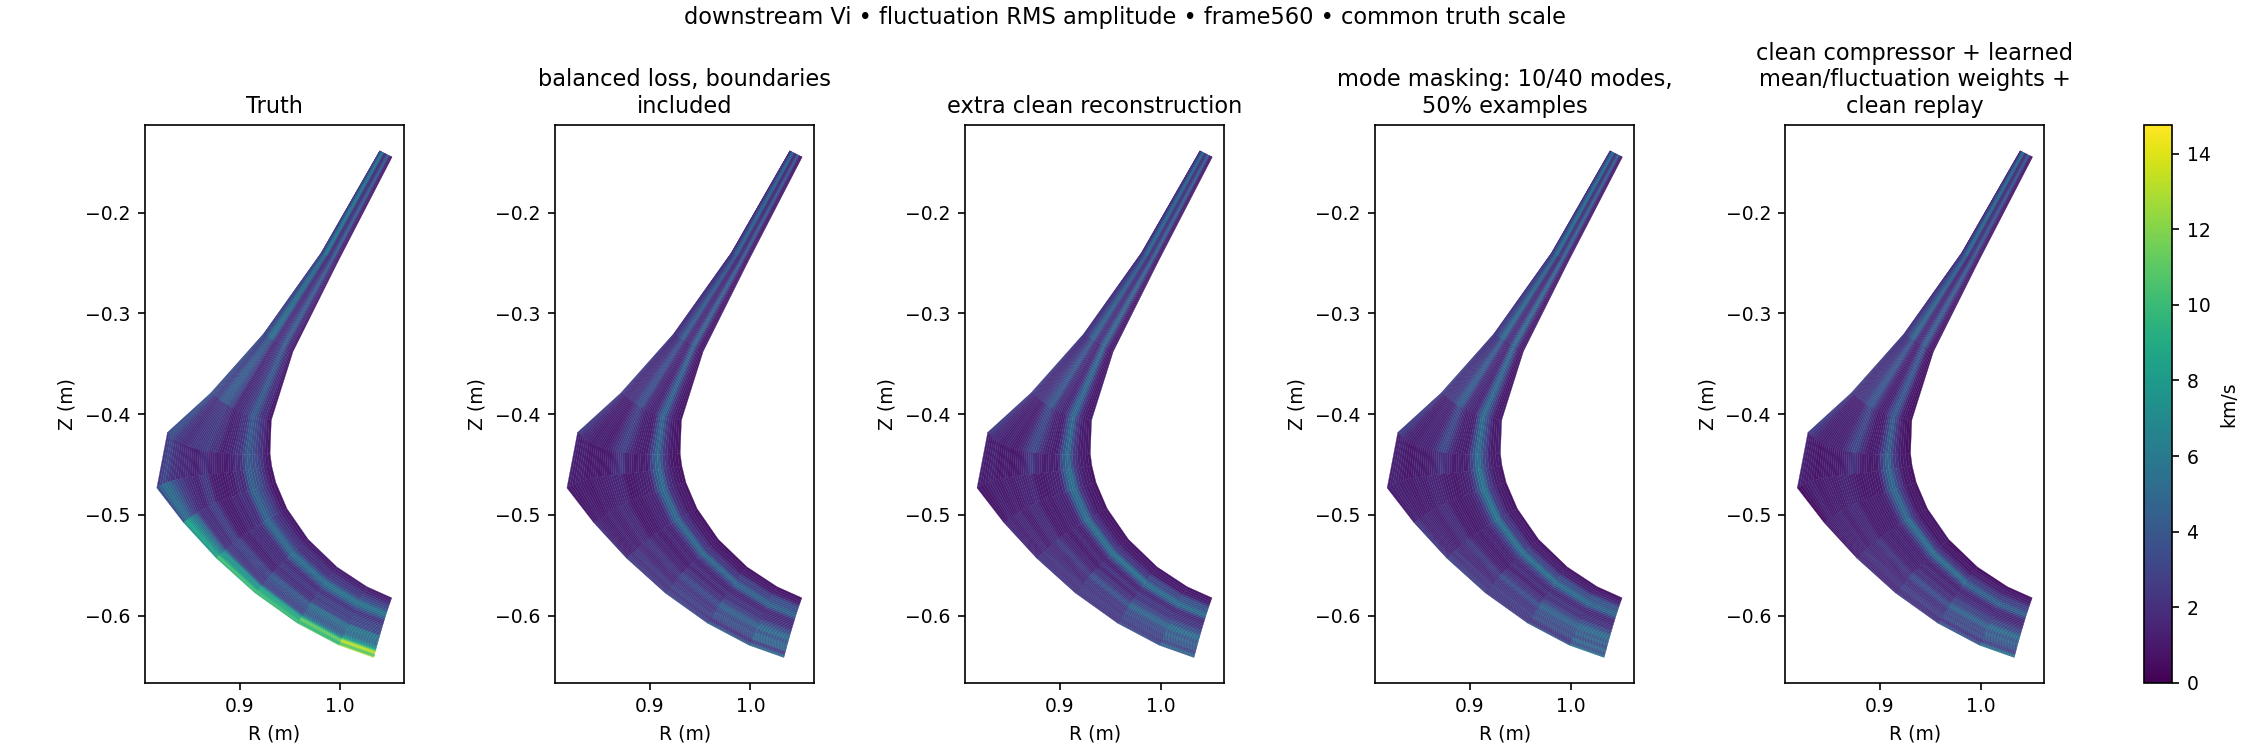
Toroidal mean on the R–Z mesh. Five fields; truth versus four reconstruction losses. Full volume supplied independently at every time. 50:50 and 25:75 denote mean:fluctuation loss weights. MP4Fluctuations on native radial–toroidal cells. Five fields; truth versus four reconstruction losses. Full volume supplied independently at every time. 50:50 and 25:75 denote mean:fluctuation loss weights. MP4Balanced compressor: fluctuation amplitude and reconstruction error. PNGReconstruction objectives: electron, ion and total recovered target heat. PNGSame-time reconstruction: local and integrated particle / energy transport. PNGMore figures from the earlier reports (32)Reconstruction error across toroidal modes PNGAll physical fields: spatial profiles PNGToroidal mode power PNGCross-field phase PNGLocal and integrated radial transport PNGElectron, ion and total target heat PNGAll physical fields: spatial profiles PNGToroidal mode power PNGCross-field phase PNGAll physical fields: spatial profiles PNGToroidal mode power PNGCross-field phase PNGLocal and integrated radial transport PNGElectron, ion and total target heat PNGAll physical fields: spatial profiles PNGToroidal mode power PNGCross-field phase PNGLocal and integrated radial transport PNGElectron, ion and total target heat PNGAll physical fields: spatial profiles PNGToroidal mode power PNGCross-field phase PNGLocal and integrated radial transport PNGElectron, ion and total target heat PNGNe in the poloidal cross-section PNGTe in the poloidal cross-section PNGTi in the poloidal cross-section PNGphi in the poloidal cross-section PNGVi in the poloidal cross-section PNGAll-field transfer scores PNGMode power after transfer PNGCross-field phase after transfer PNG
Upstream → downstream
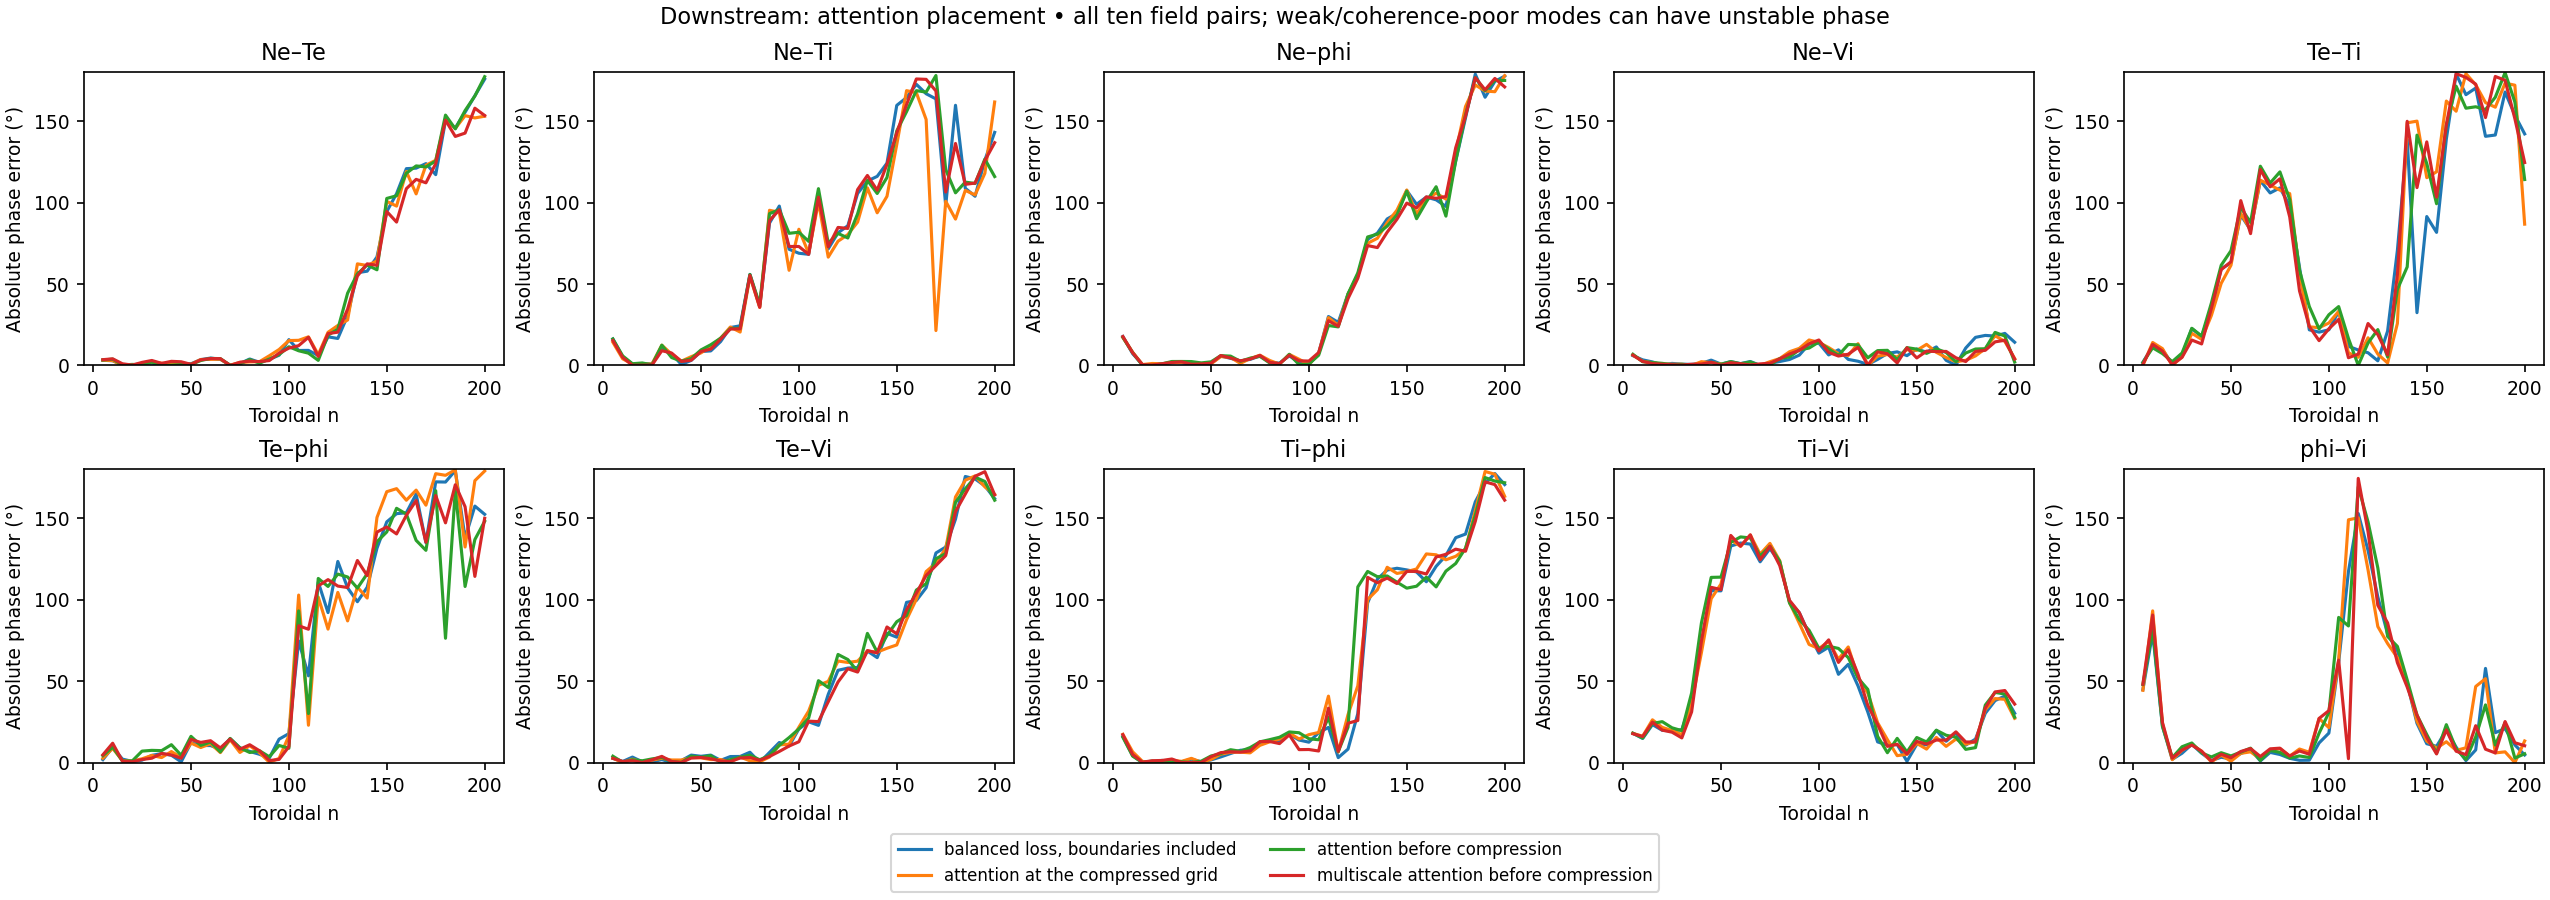
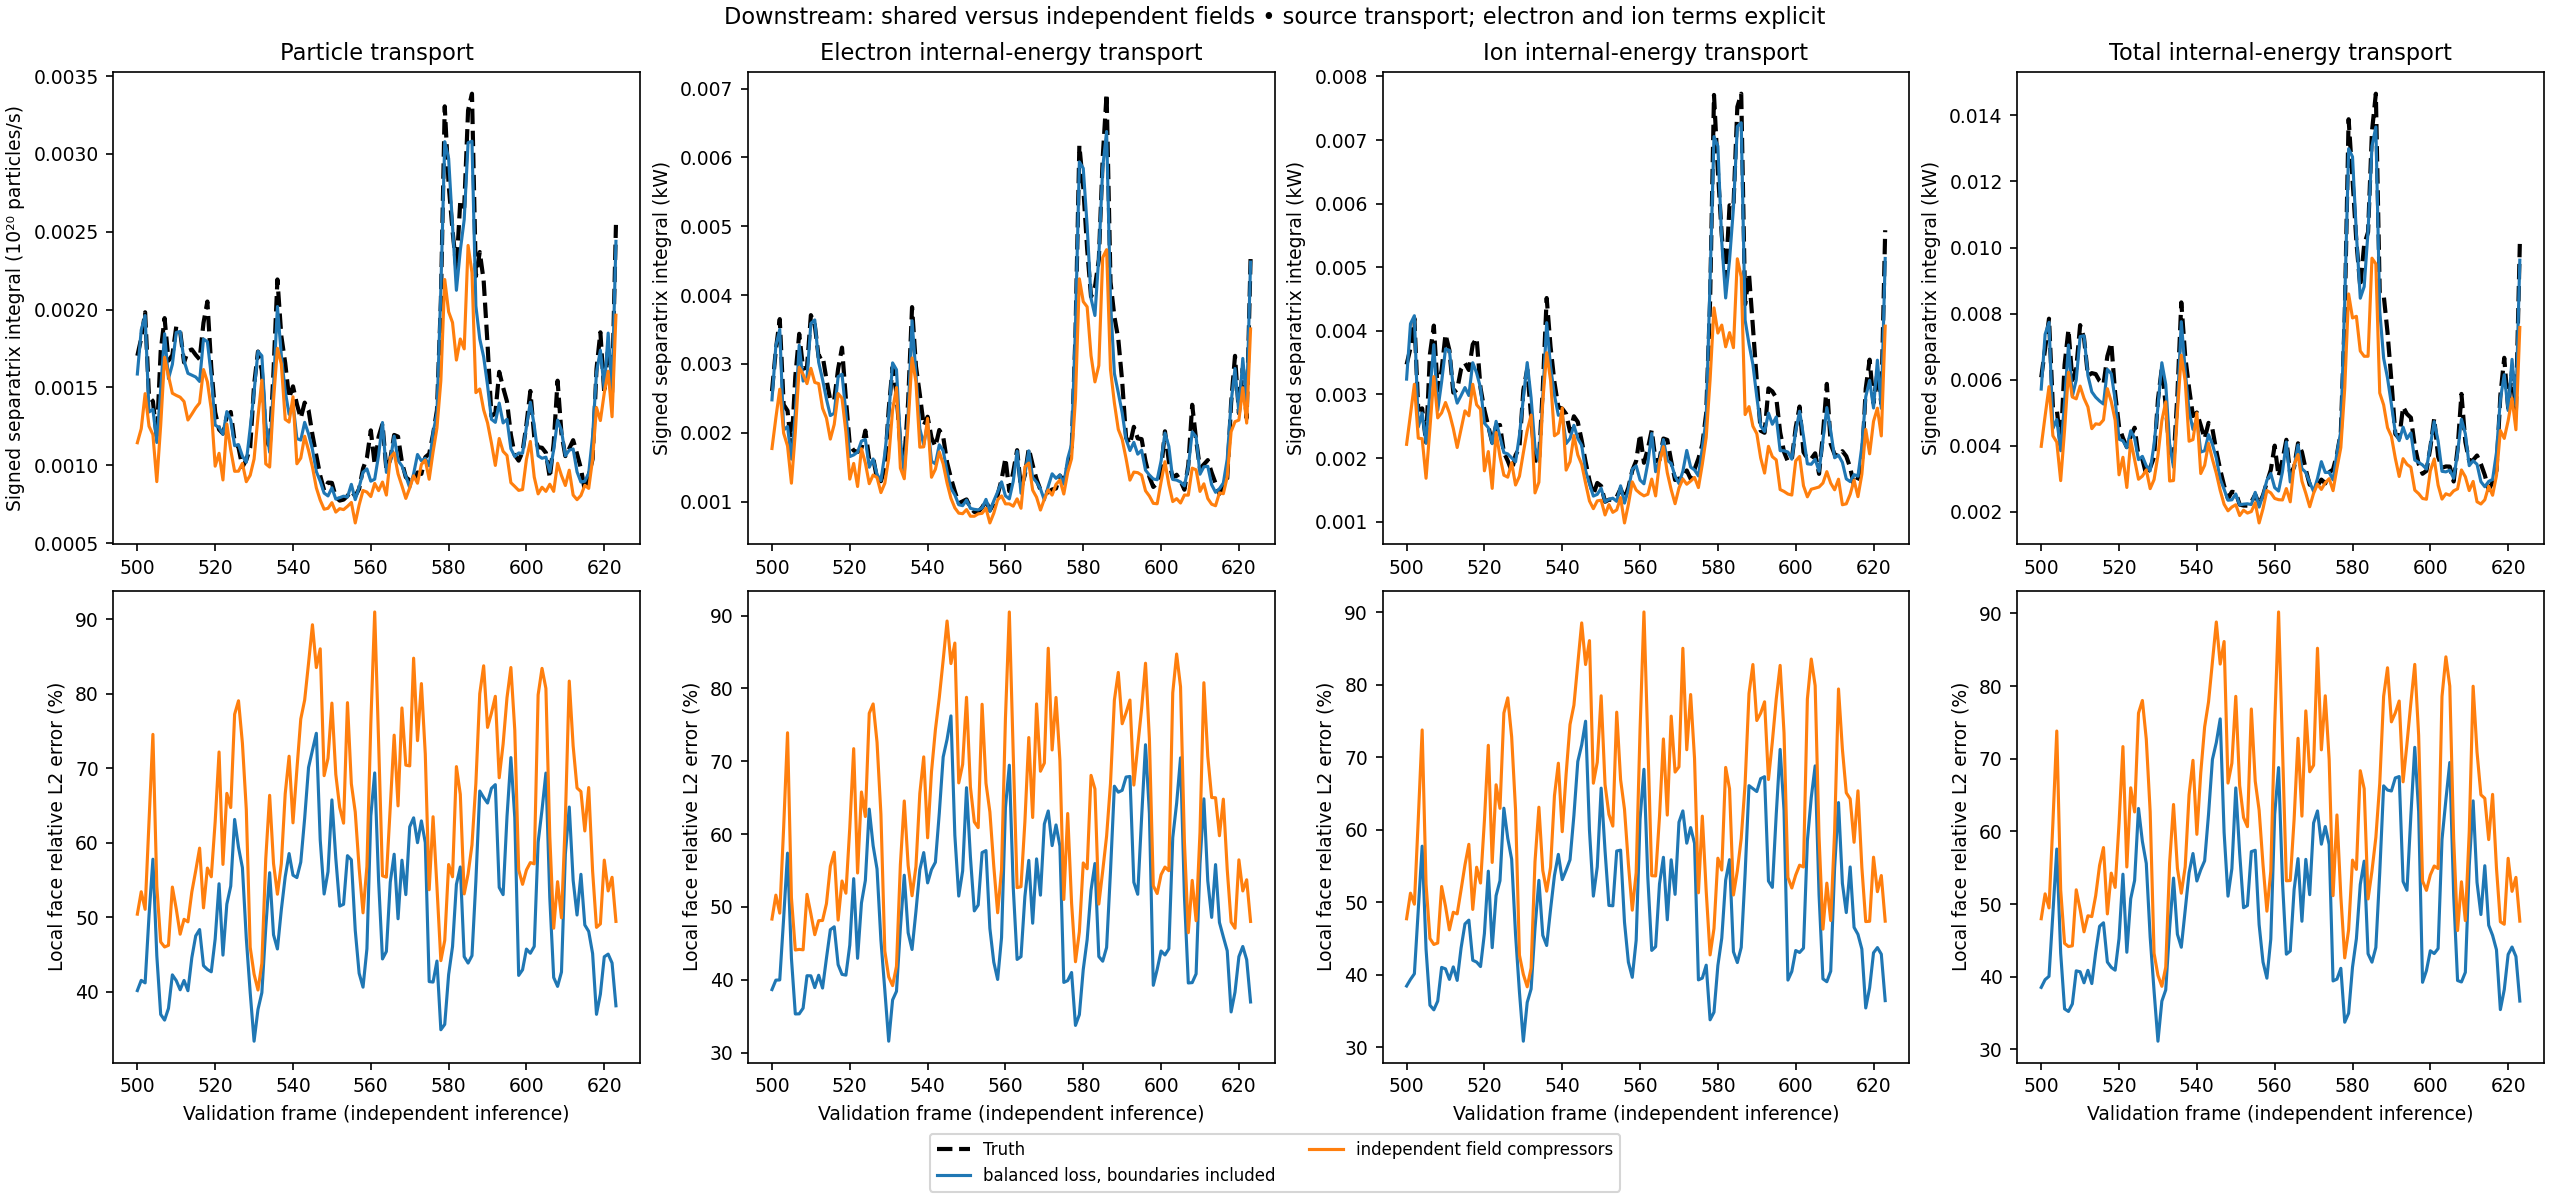
Partial observations in; same-time downstream fields out. This is distinct from compression and forecasting.
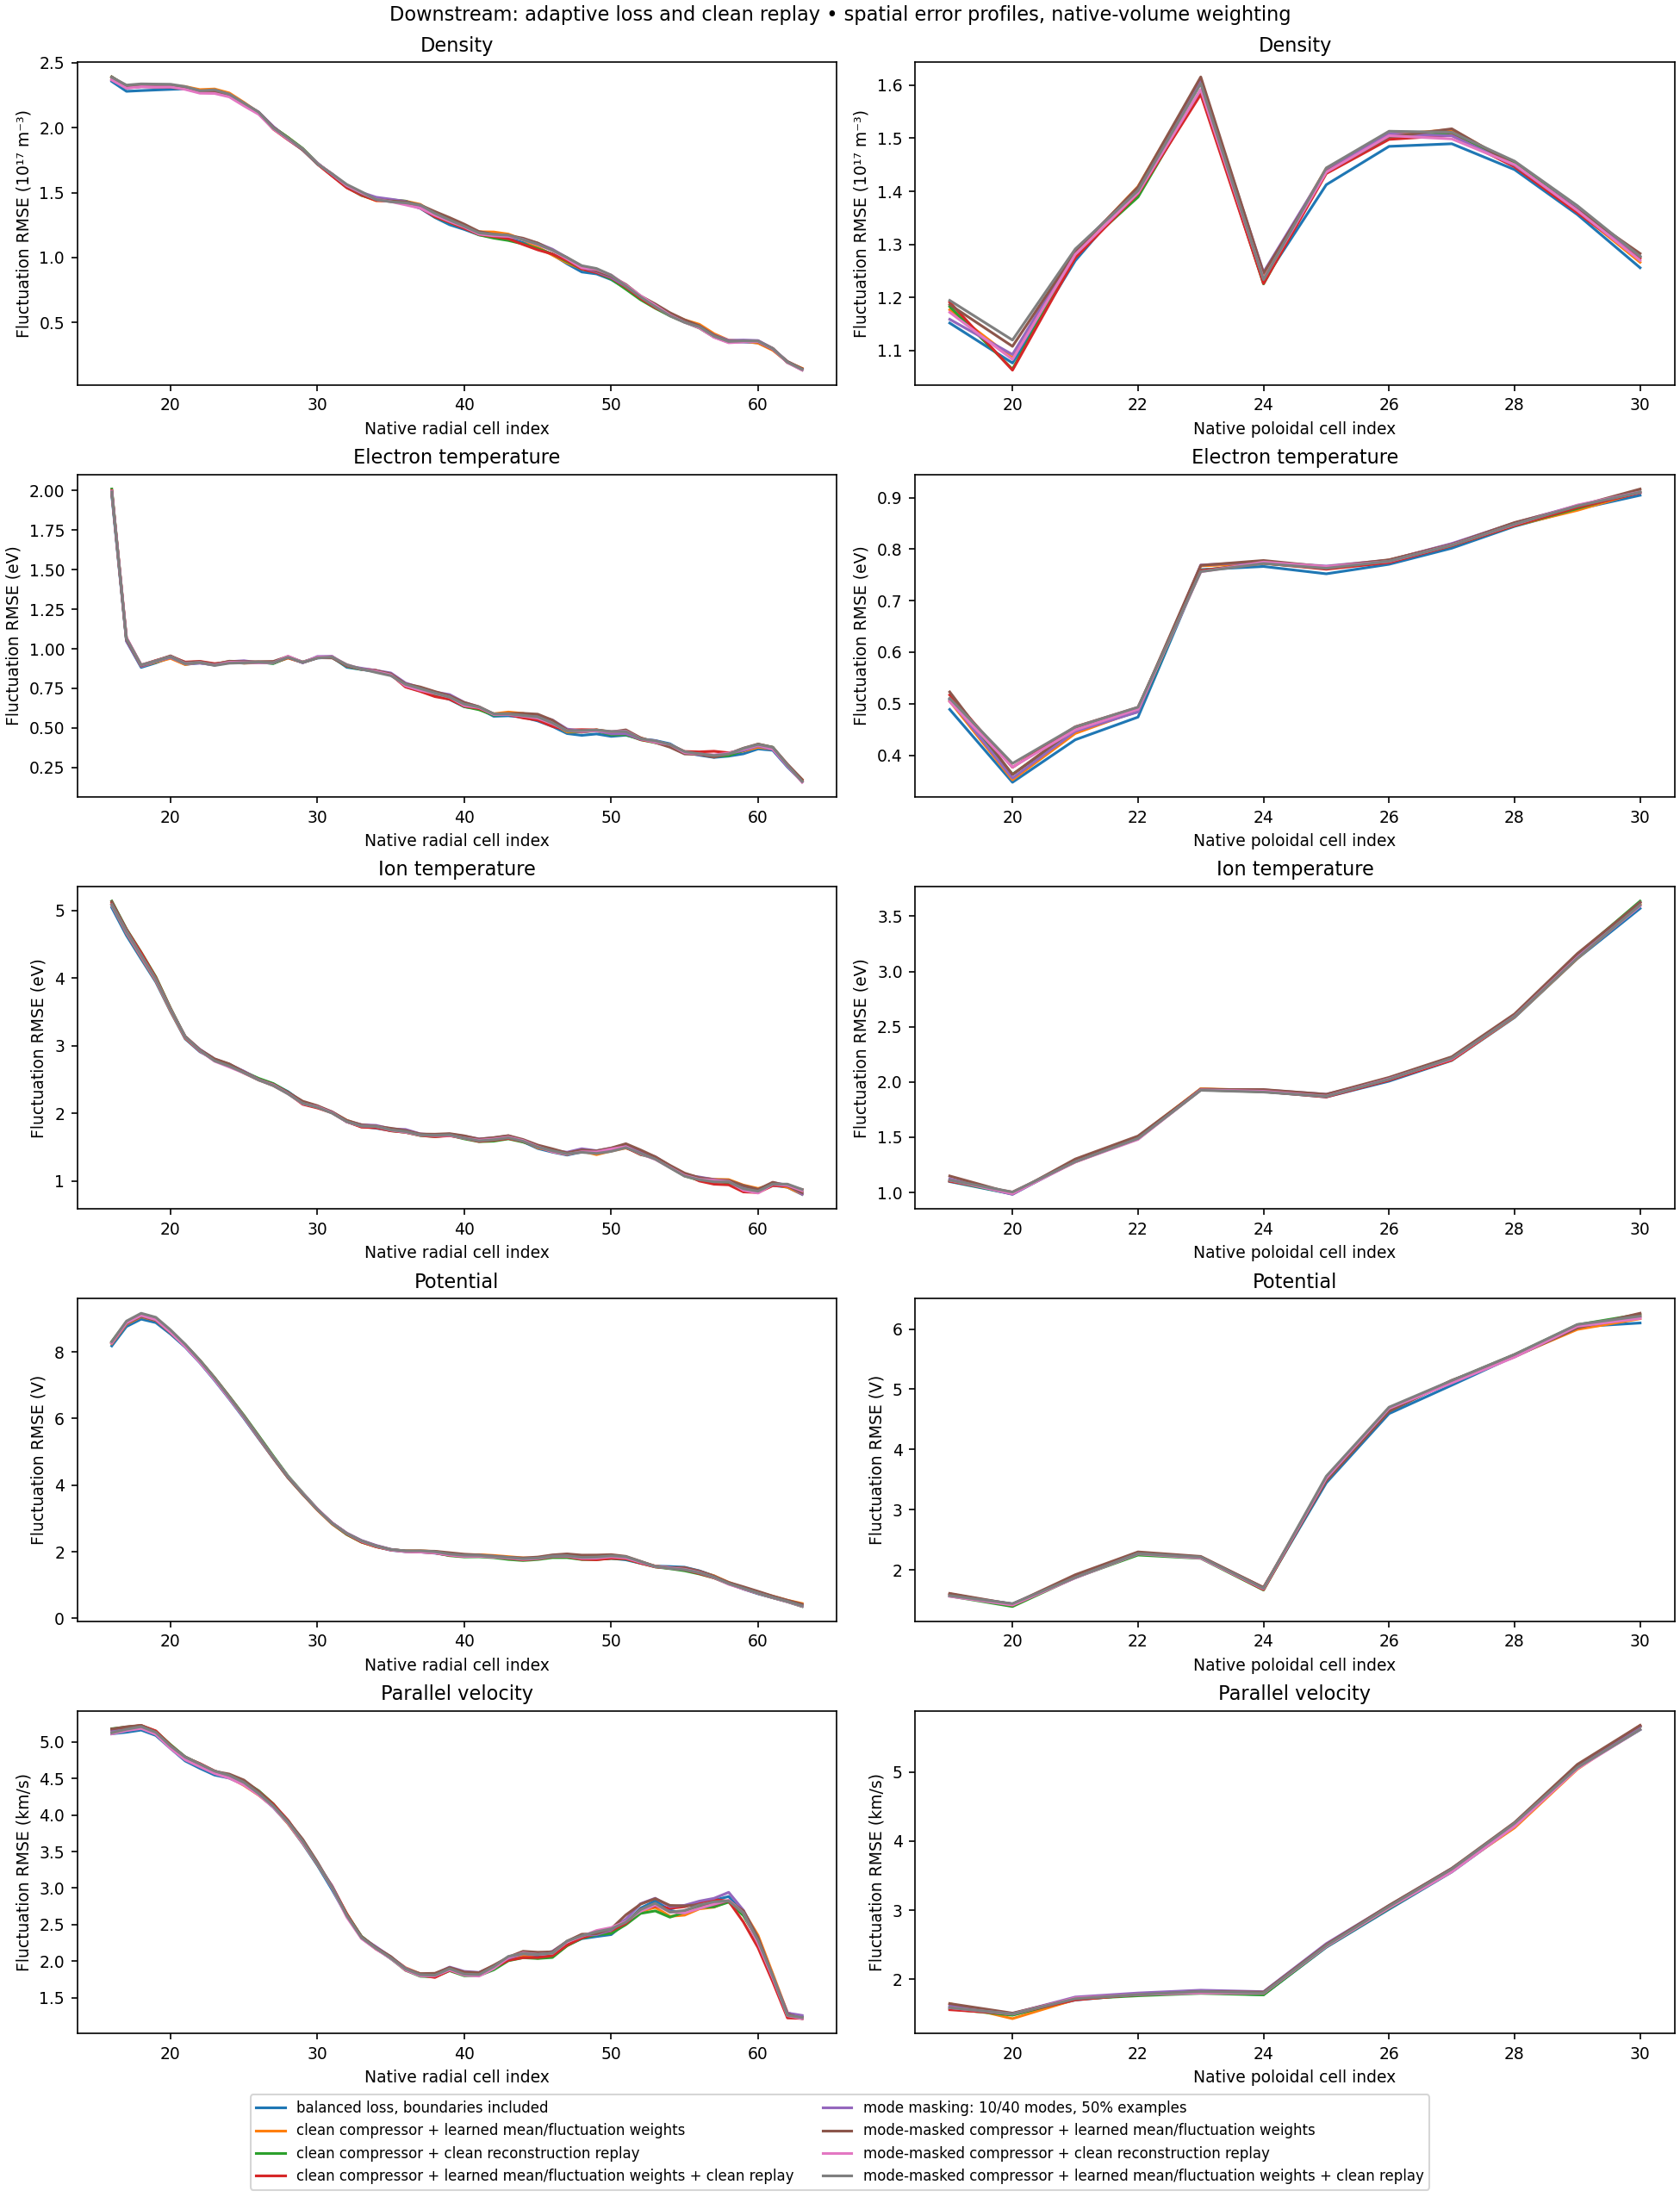
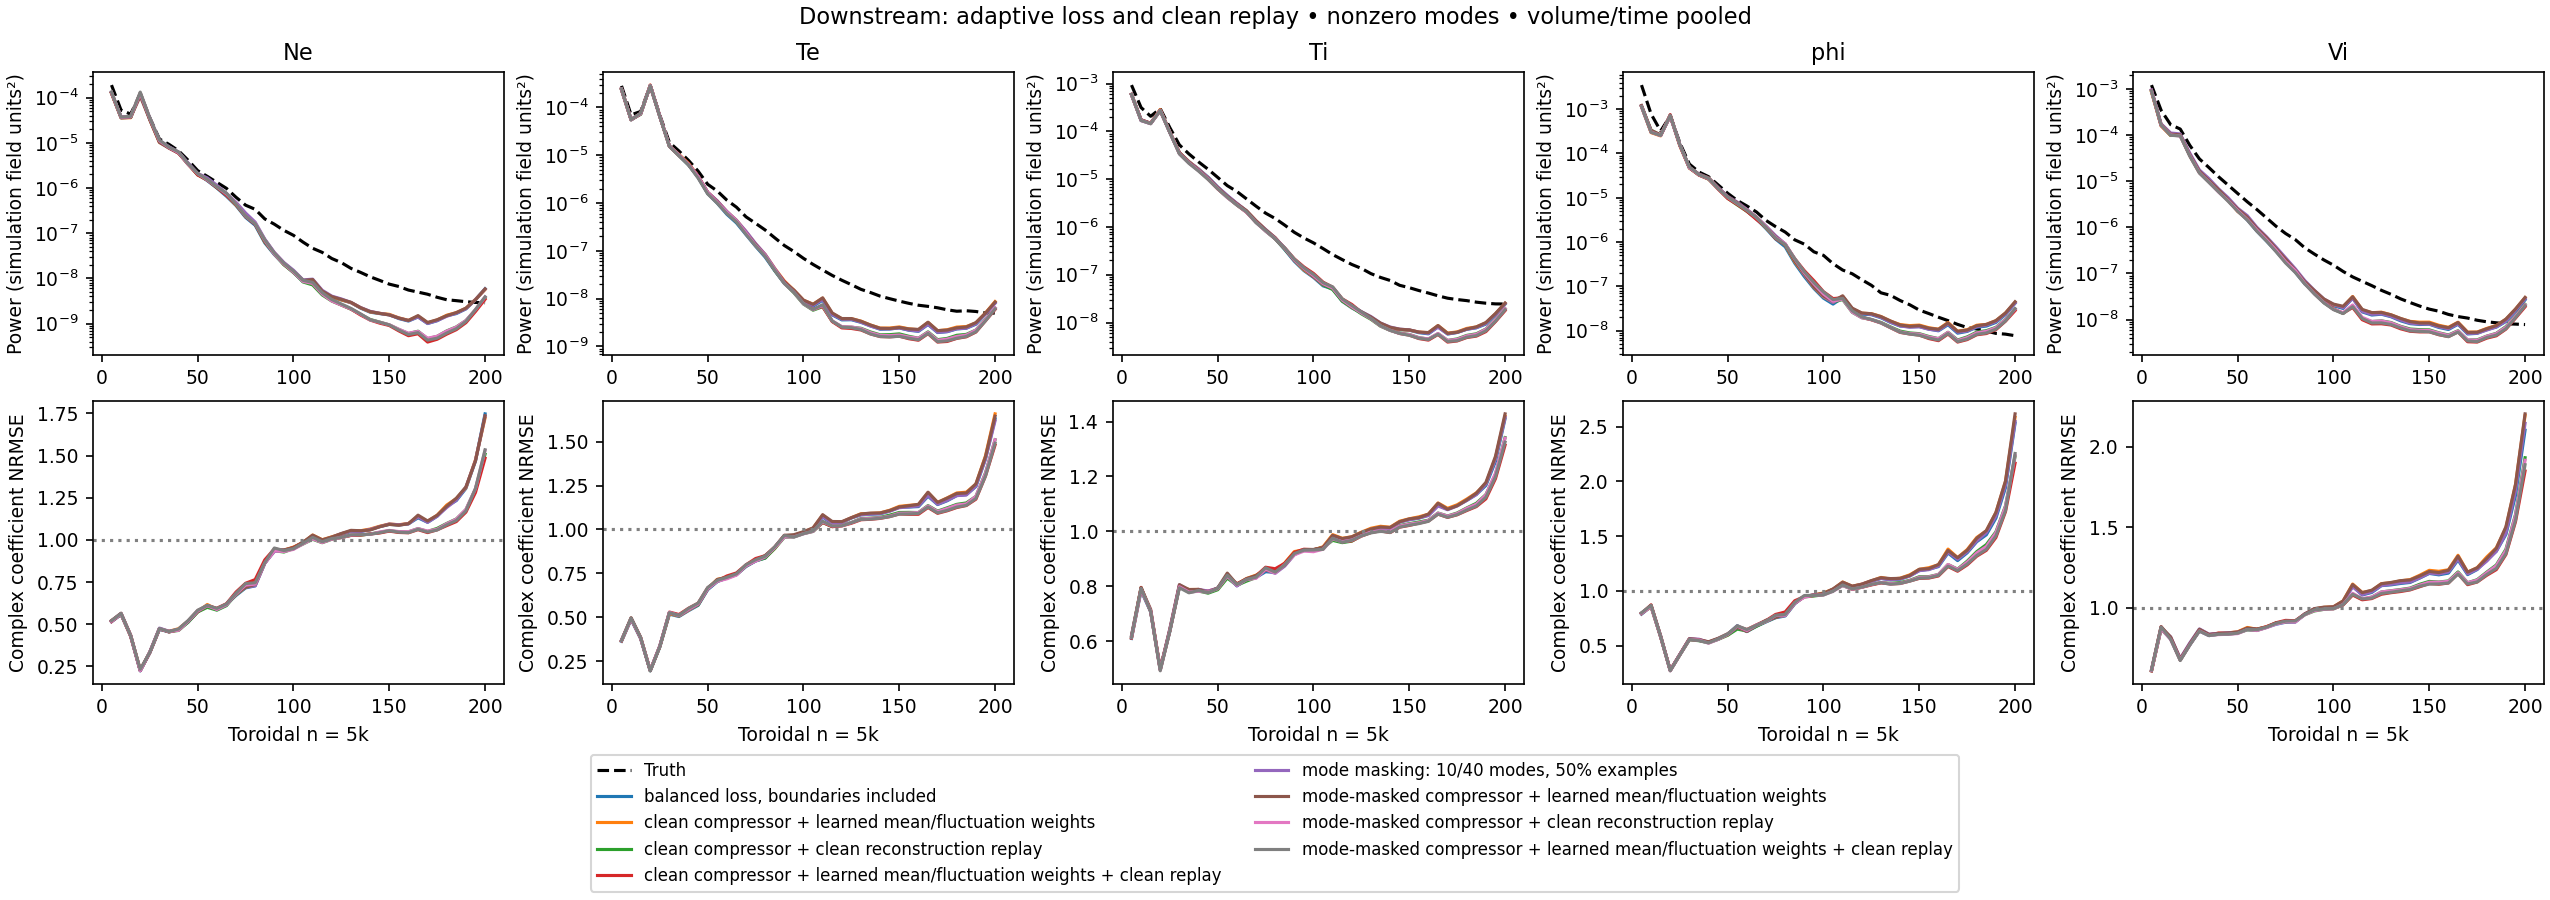
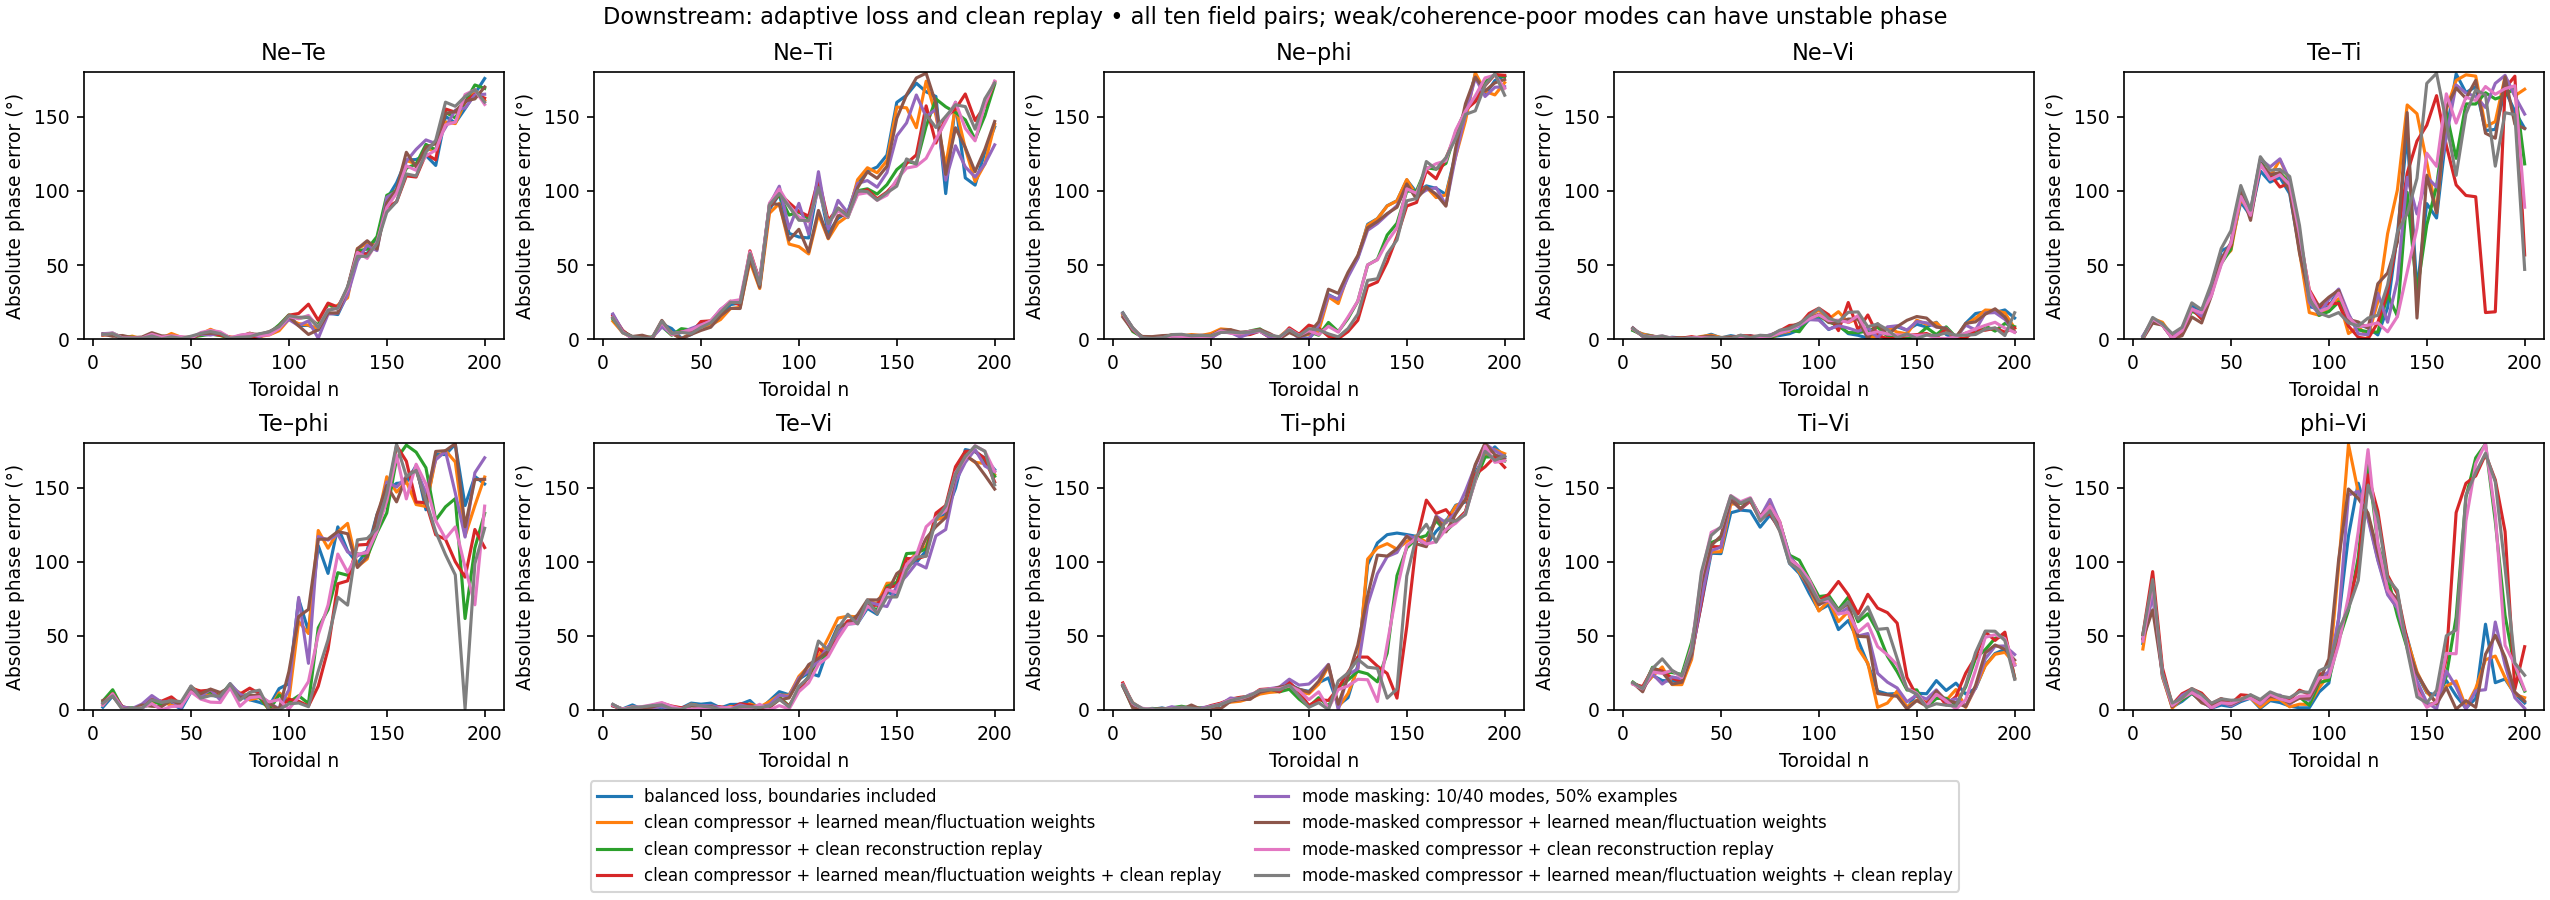
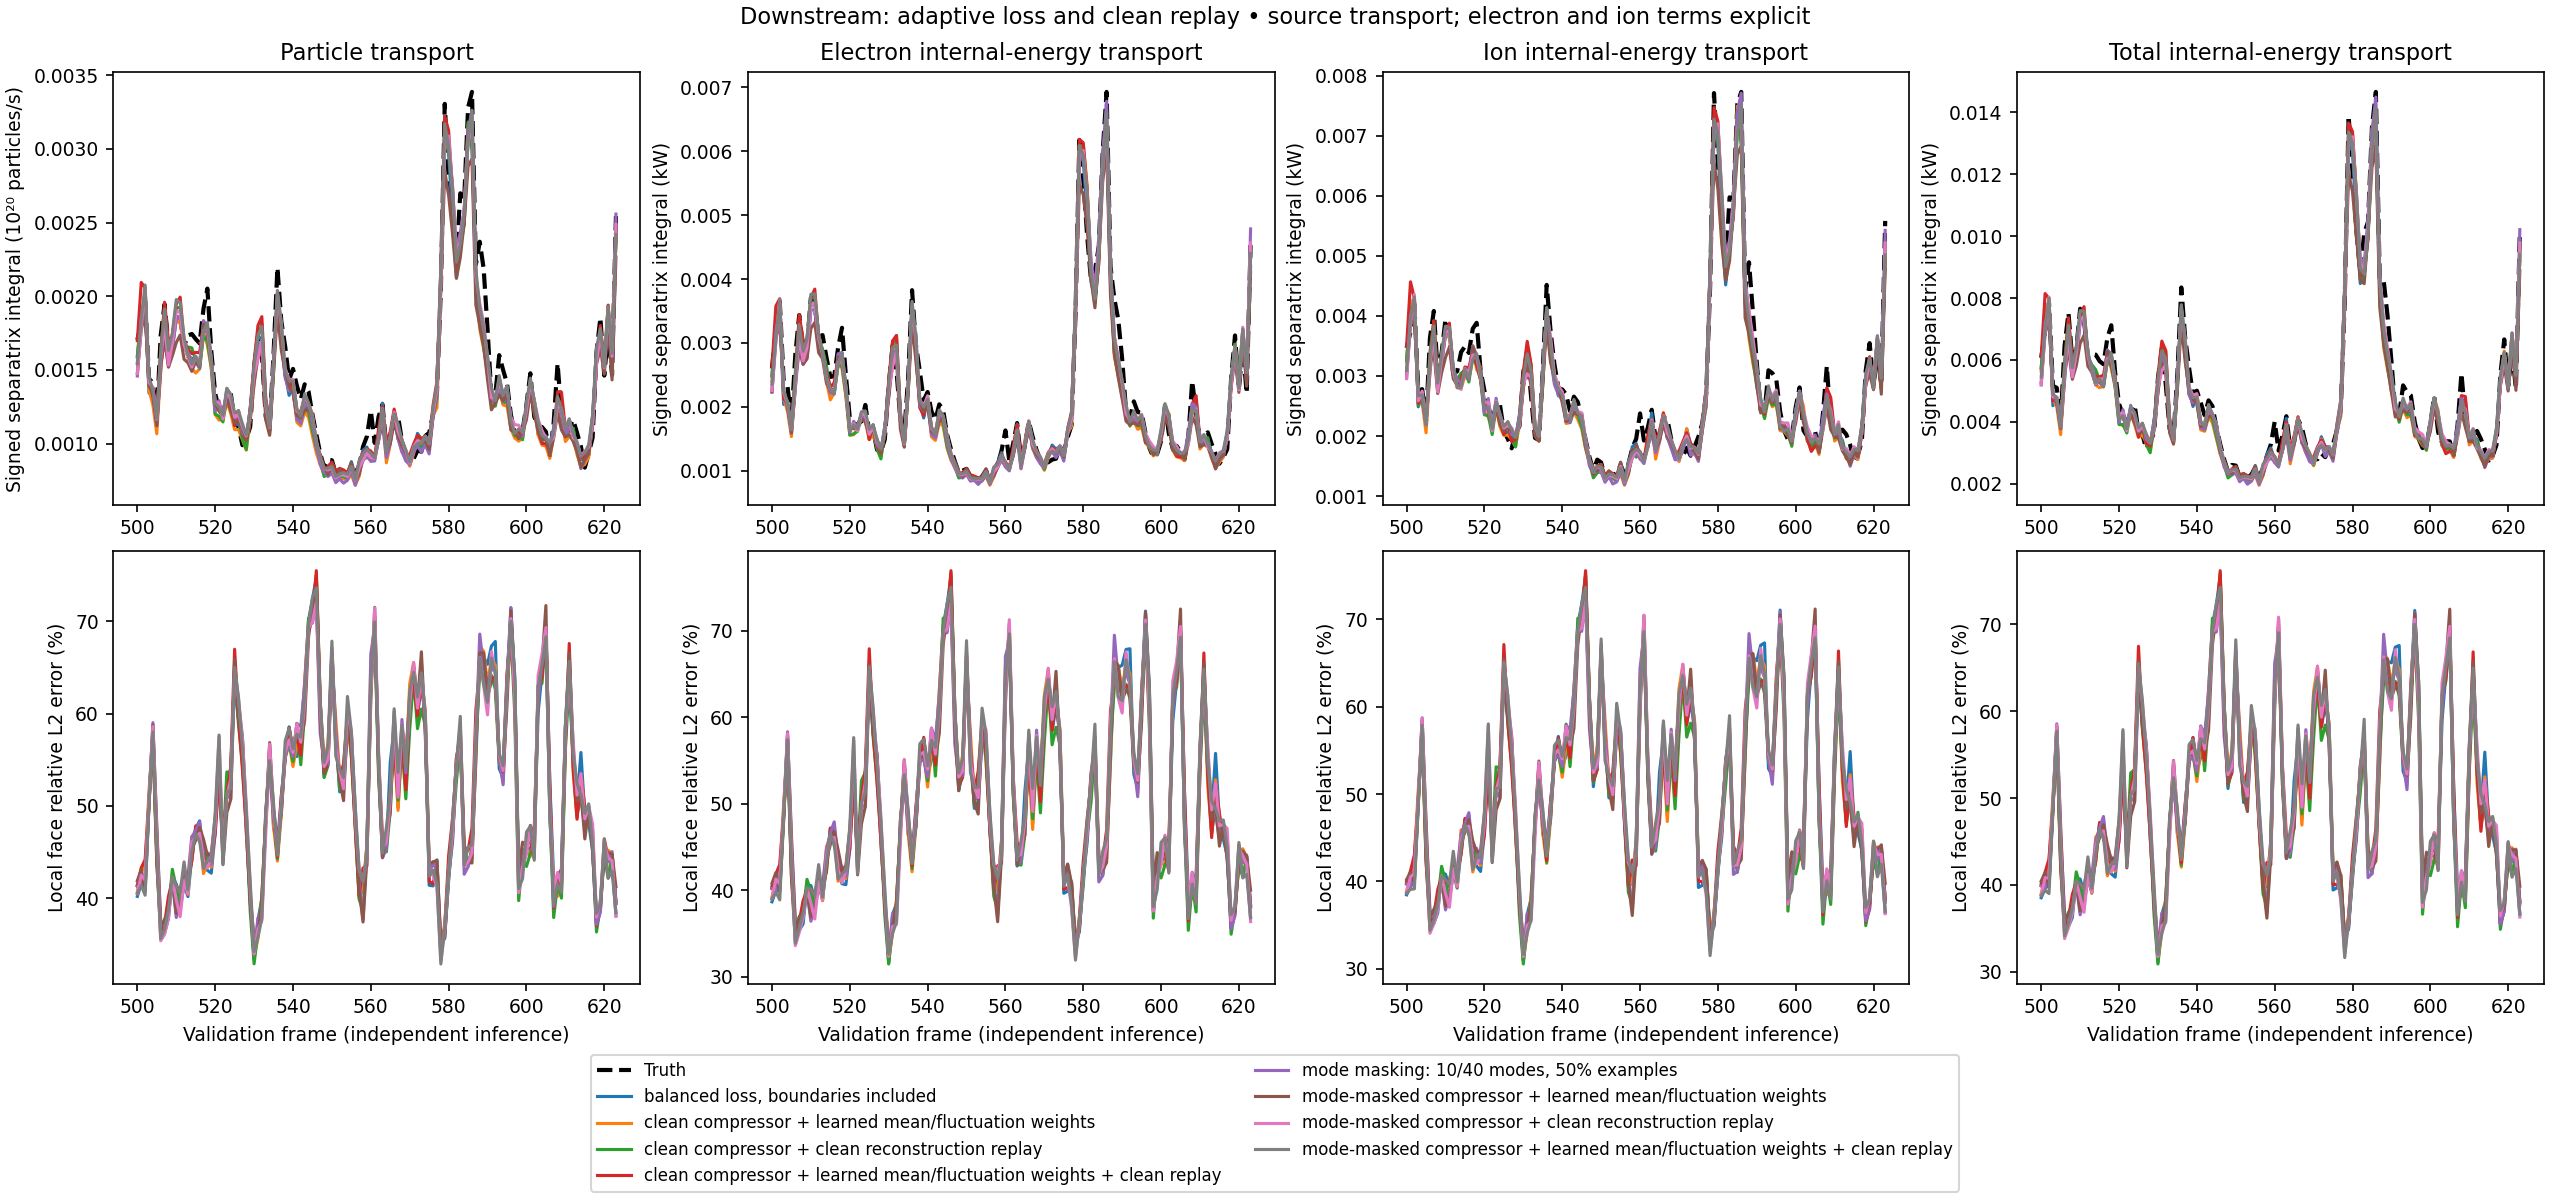
Downstream adaptation: with versus without clean reconstruction replay. PNGDownstream field relationships: convolution and attention comparisons. PNGMore figures from the earlier reports (28)All physical fields: spatial profiles PNGToroidal mode power PNGCross-field phase PNGLocal and integrated radial transport PNGElectron, ion and total target heat PNGAll physical fields: spatial profiles PNGToroidal mode power PNGLocal and integrated radial transport PNGElectron, ion and total target heat PNGAll physical fields: spatial profiles PNGToroidal mode power PNGCross-field phase PNGLocal and integrated radial transport PNGElectron, ion and total target heat PNGAll physical fields: spatial profiles PNGToroidal mode power PNGCross-field phase PNGLocal and integrated radial transport PNGElectron, ion and total target heat PNGAll physical fields: spatial profiles PNGToroidal mode power PNGCross-field phase PNGLocal and integrated radial transport PNGNe downstream PNGTe downstream PNGTi downstream PNGphi downstream PNGVi downstream PNG
Transfer to another equilibrium
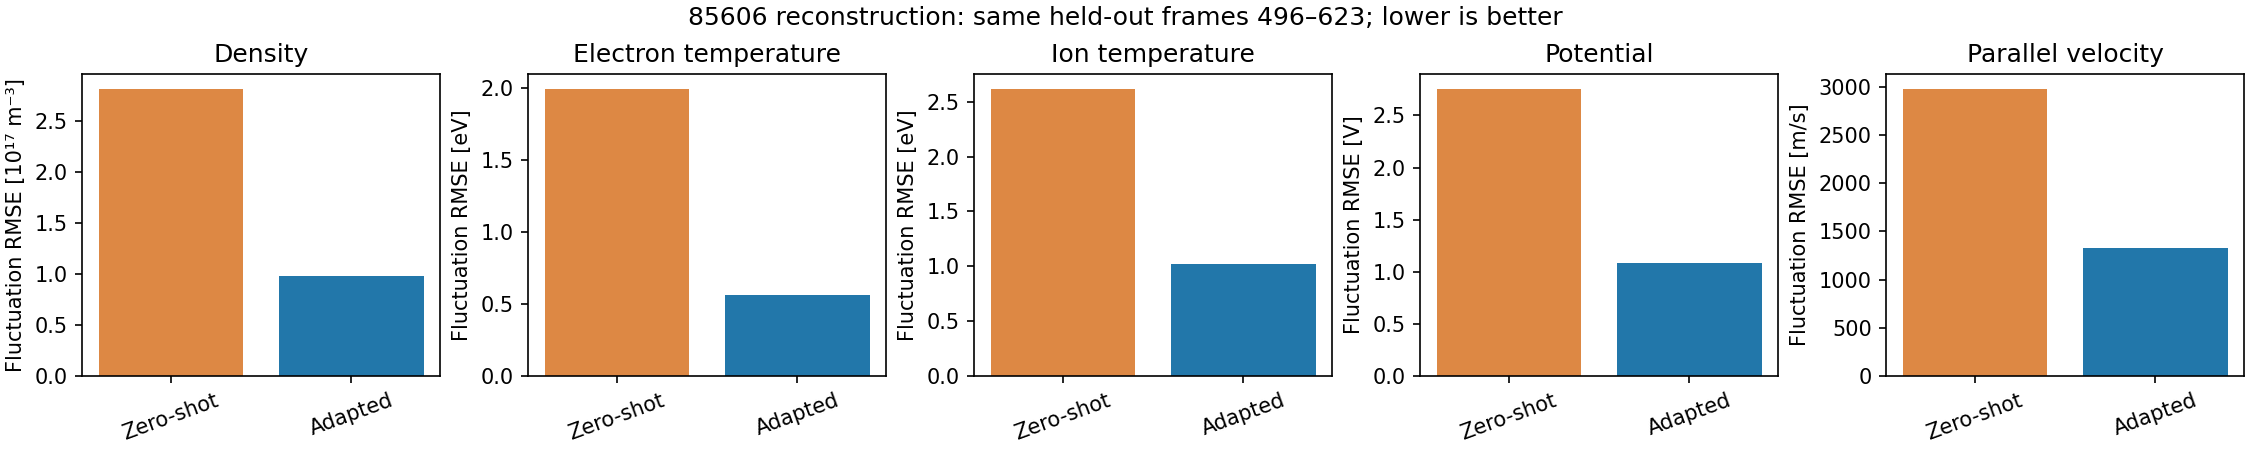
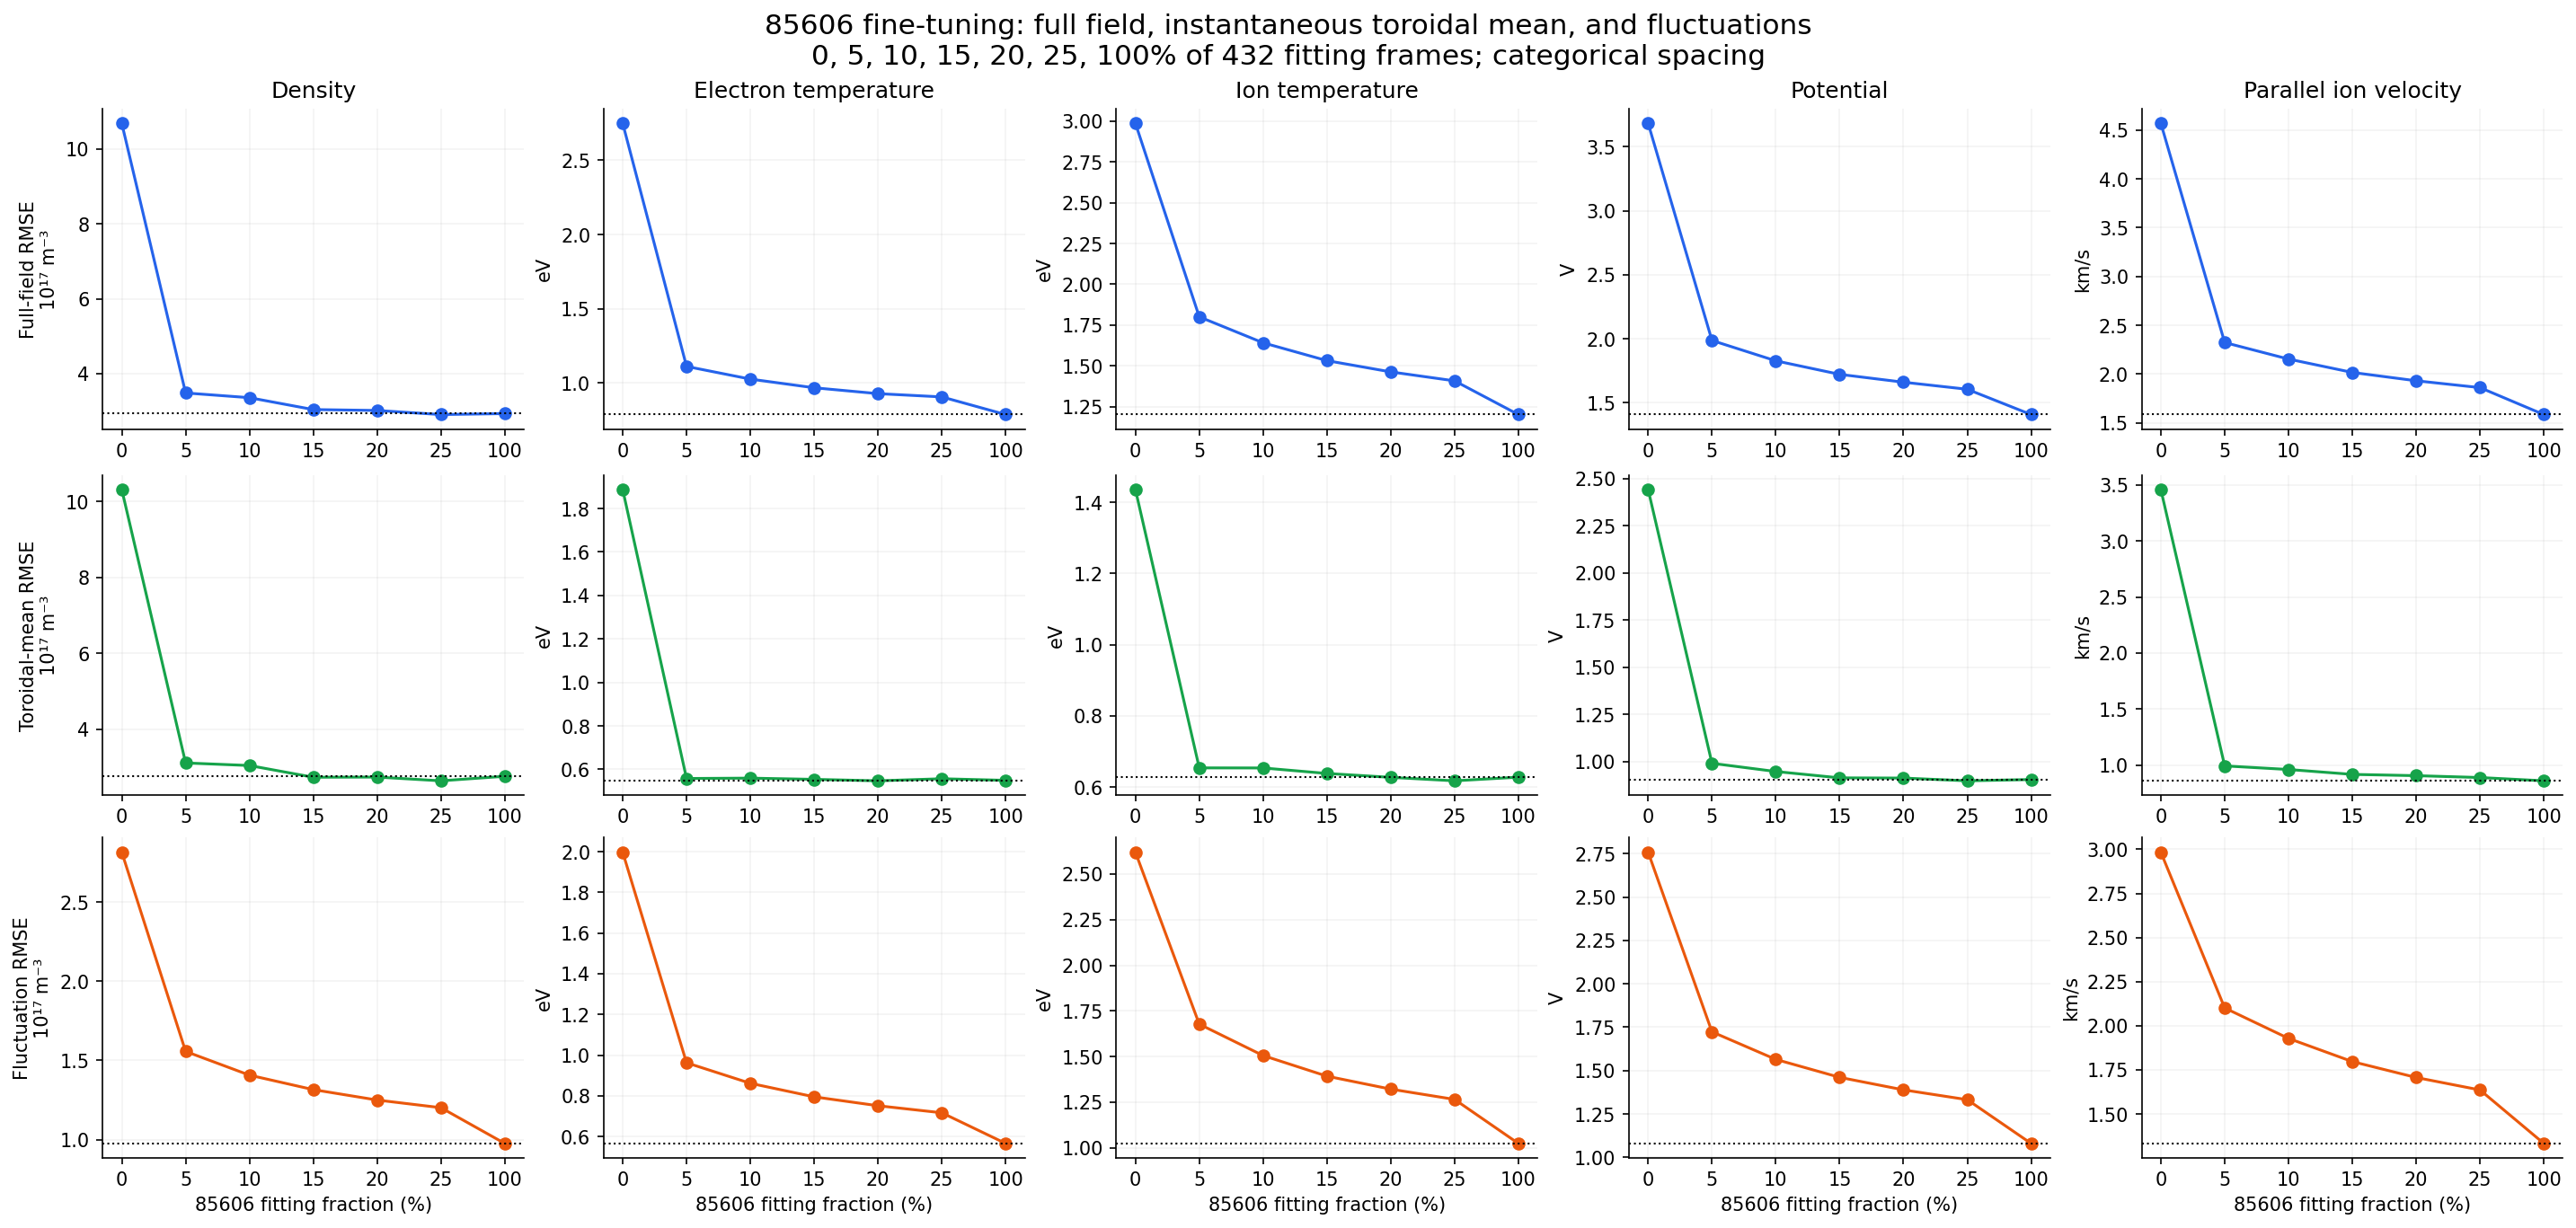
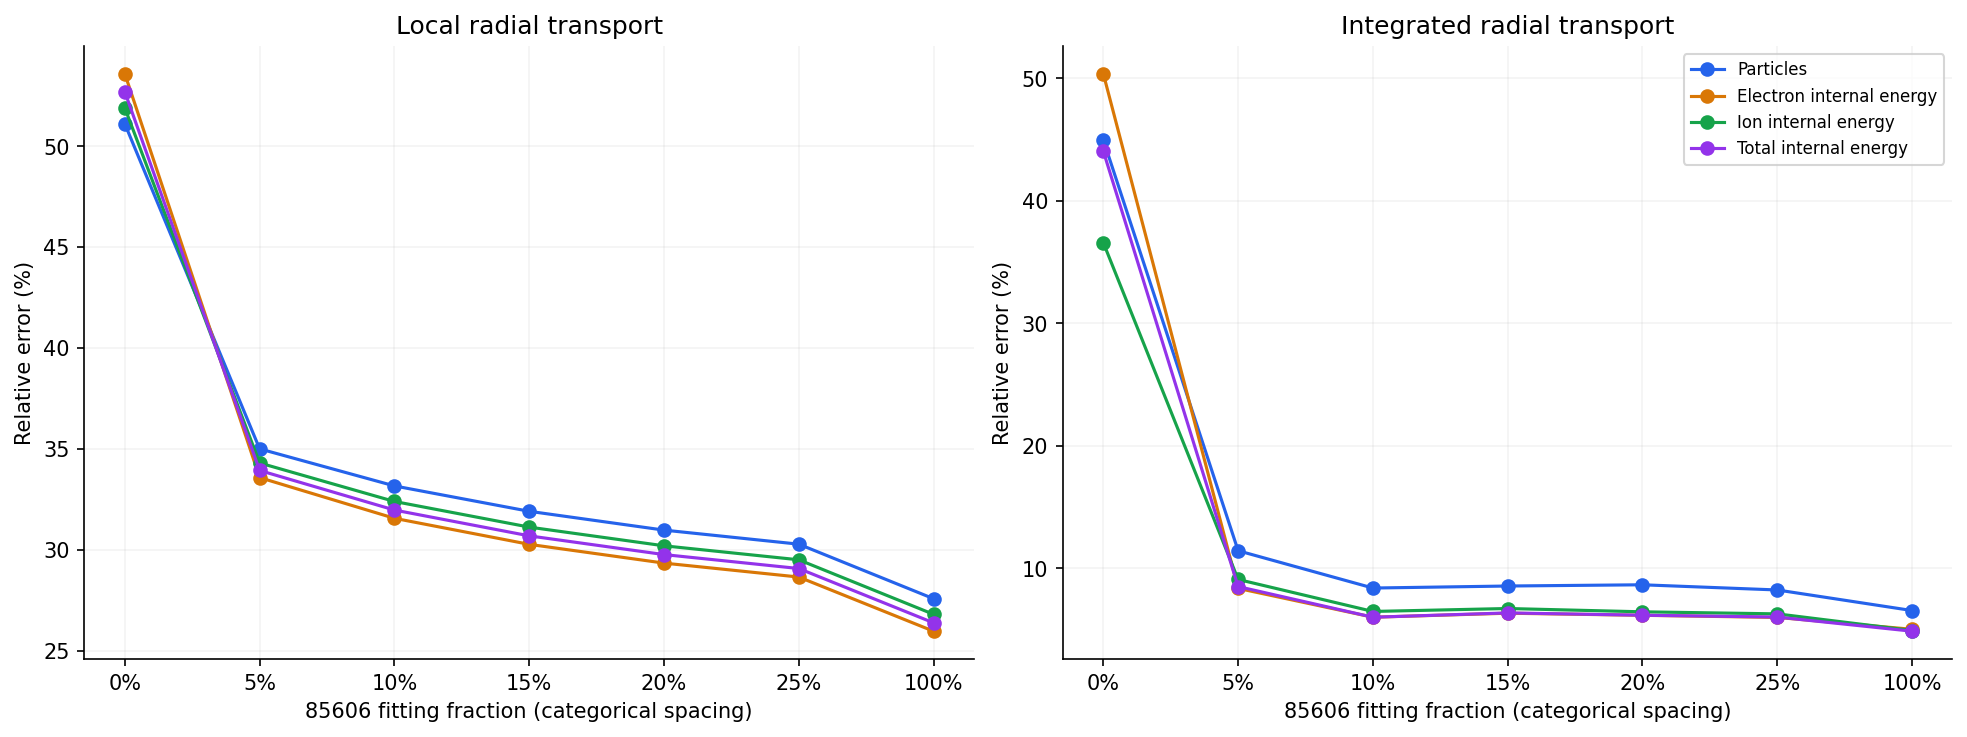
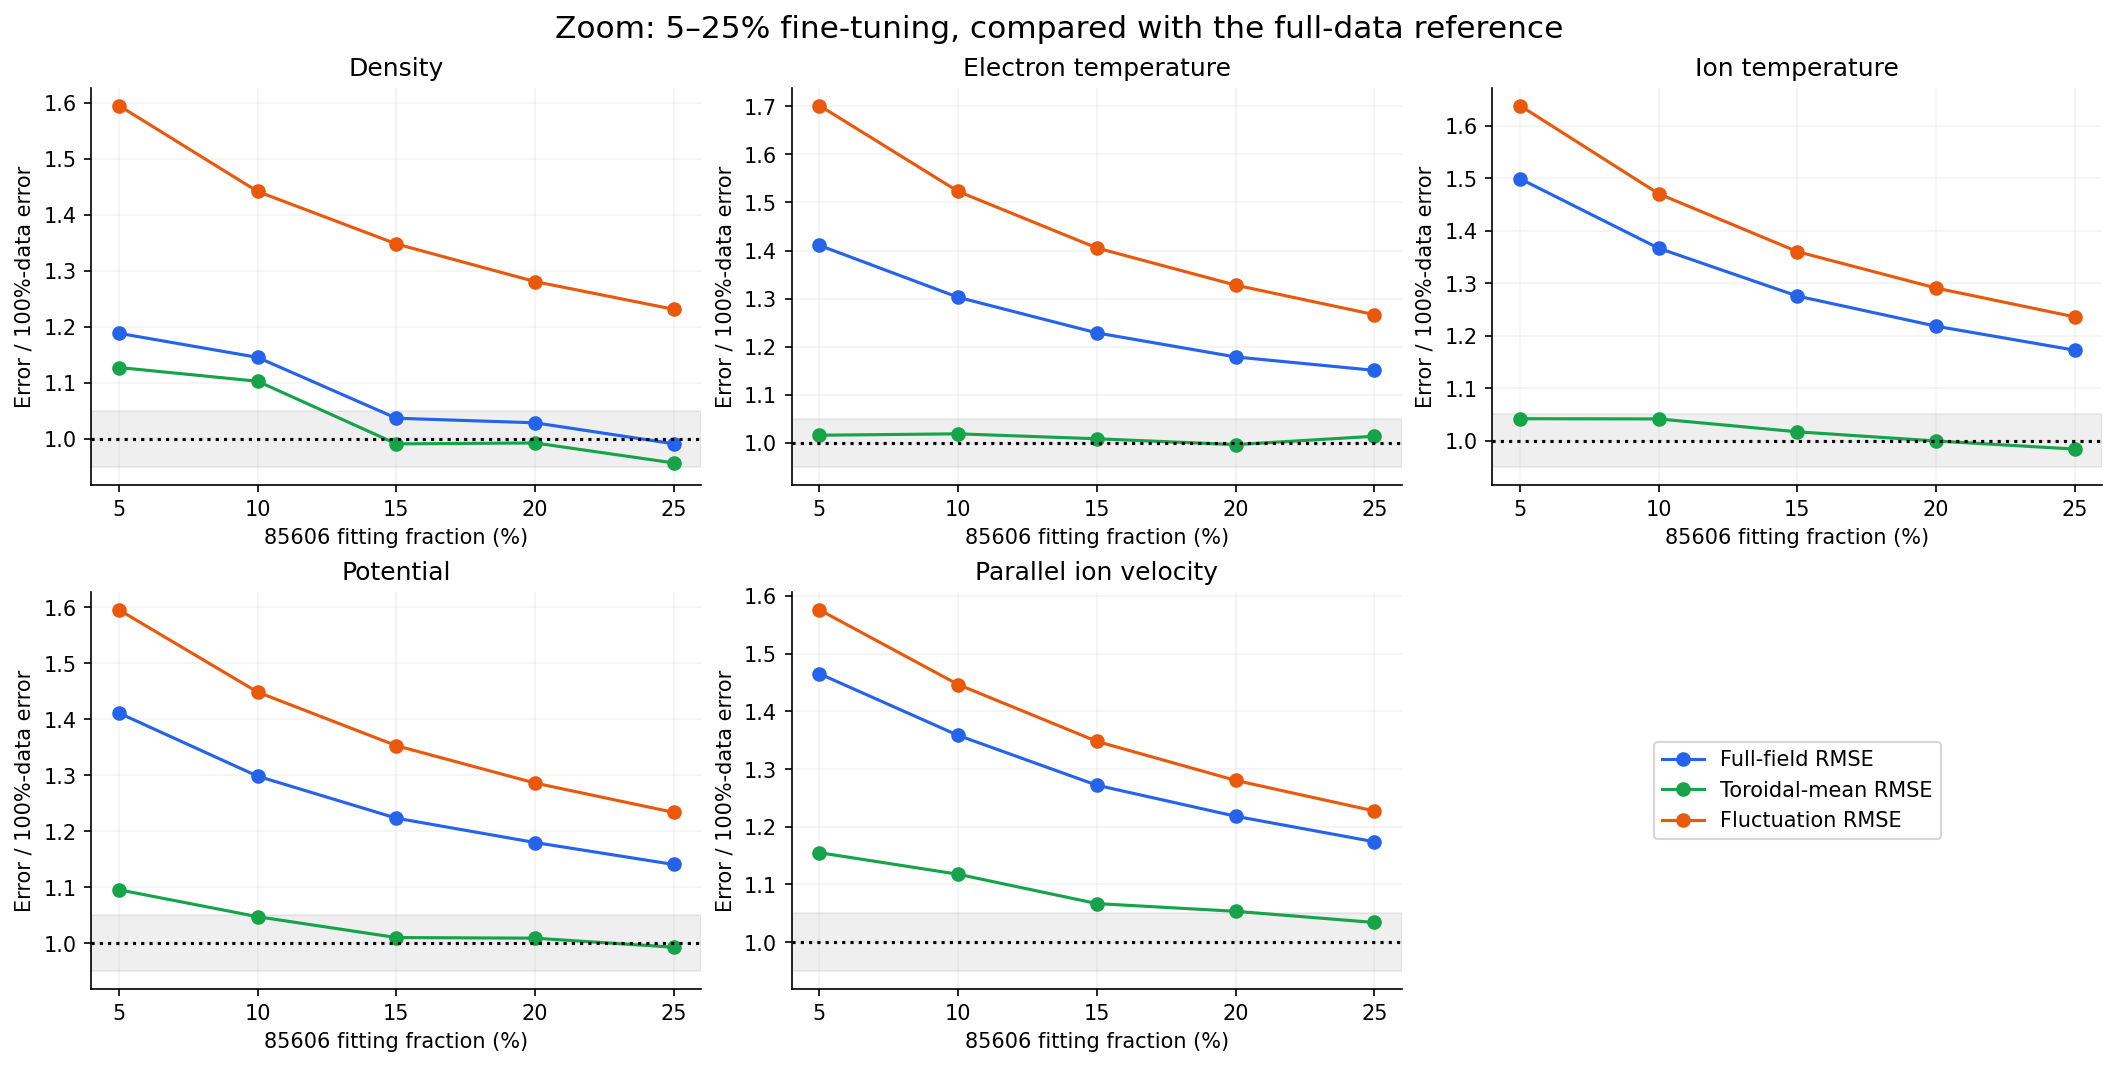
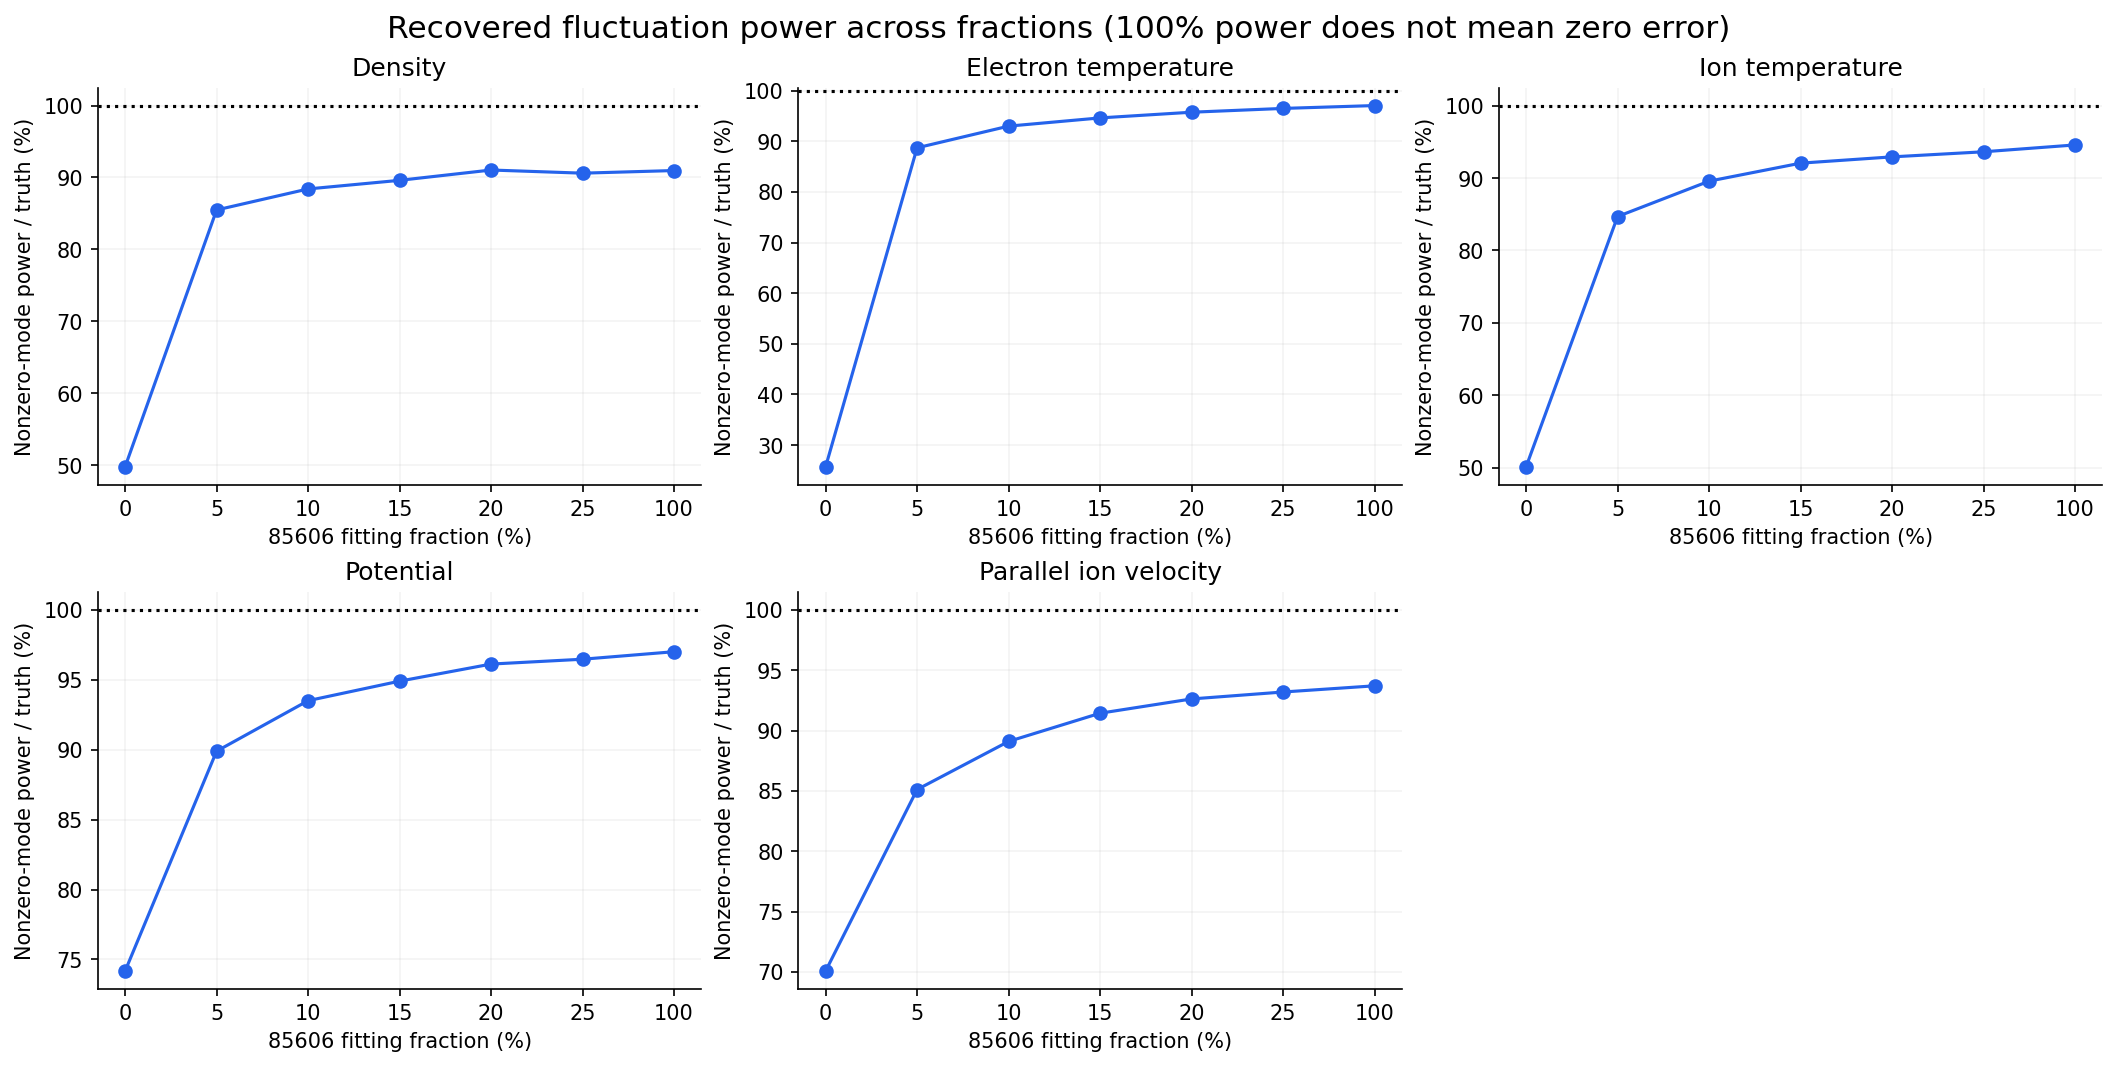
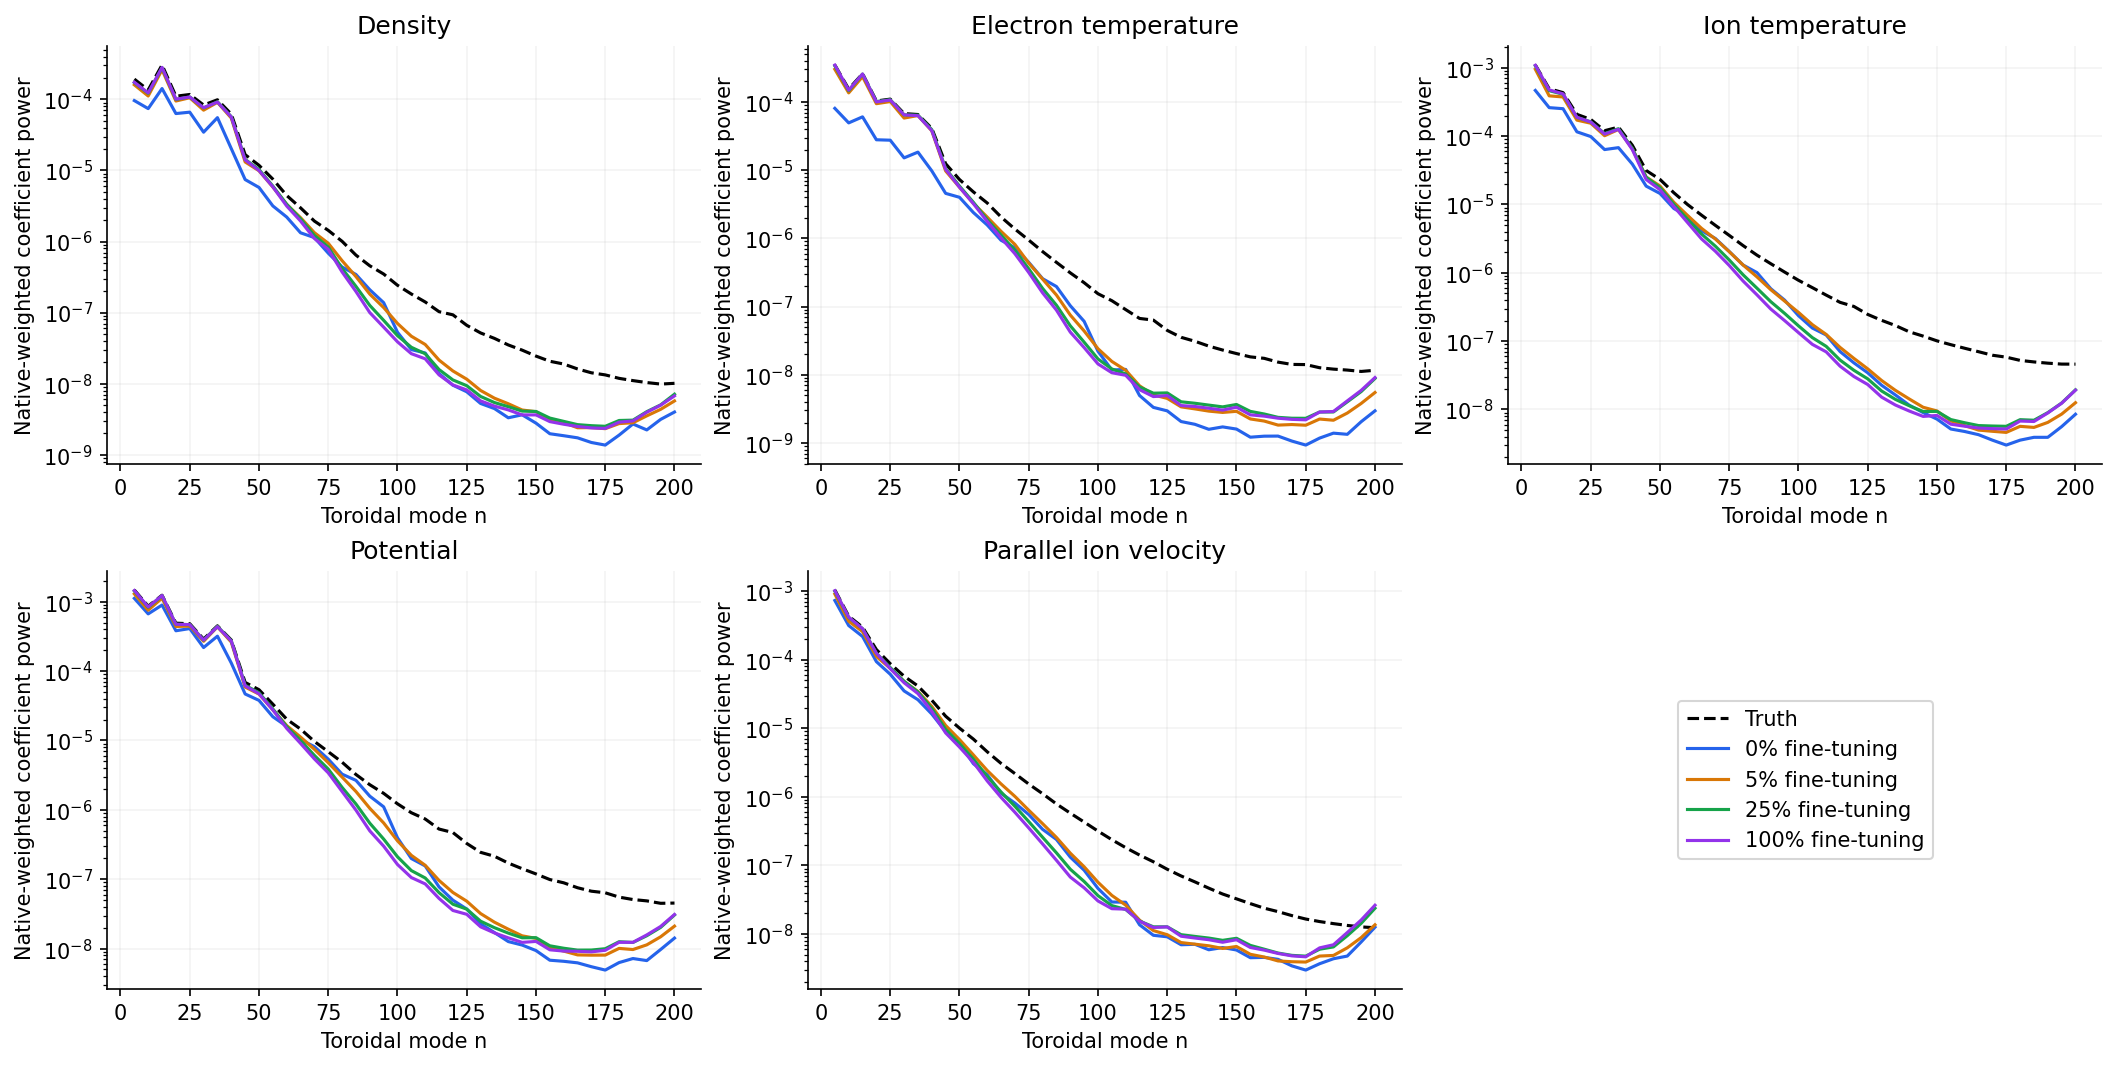
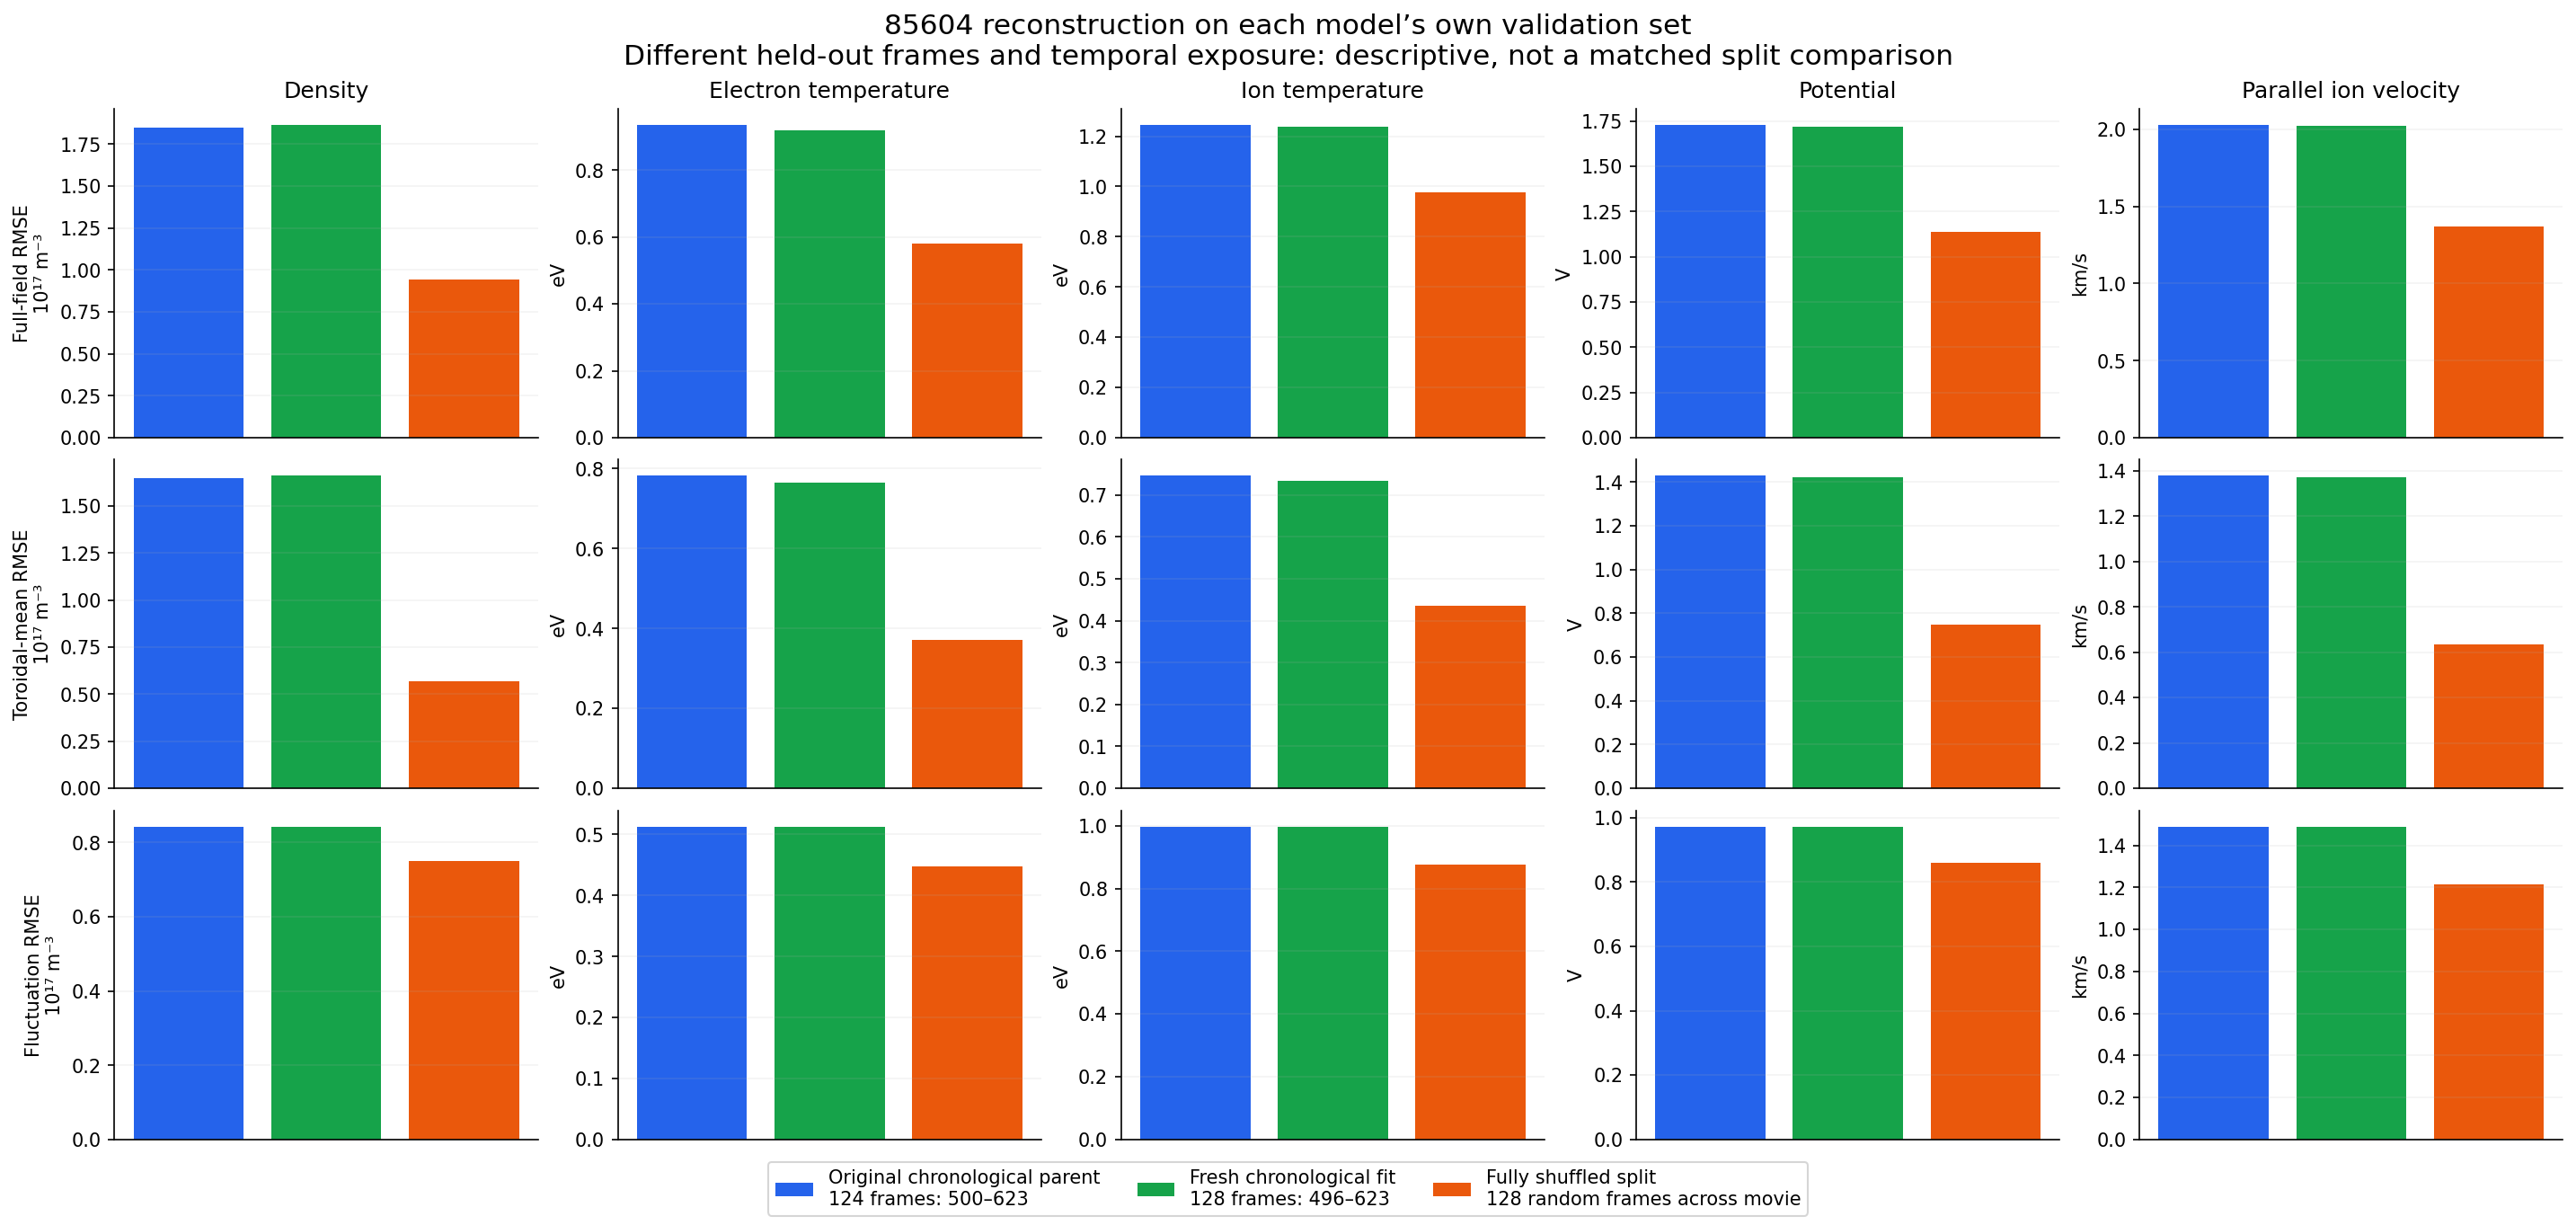
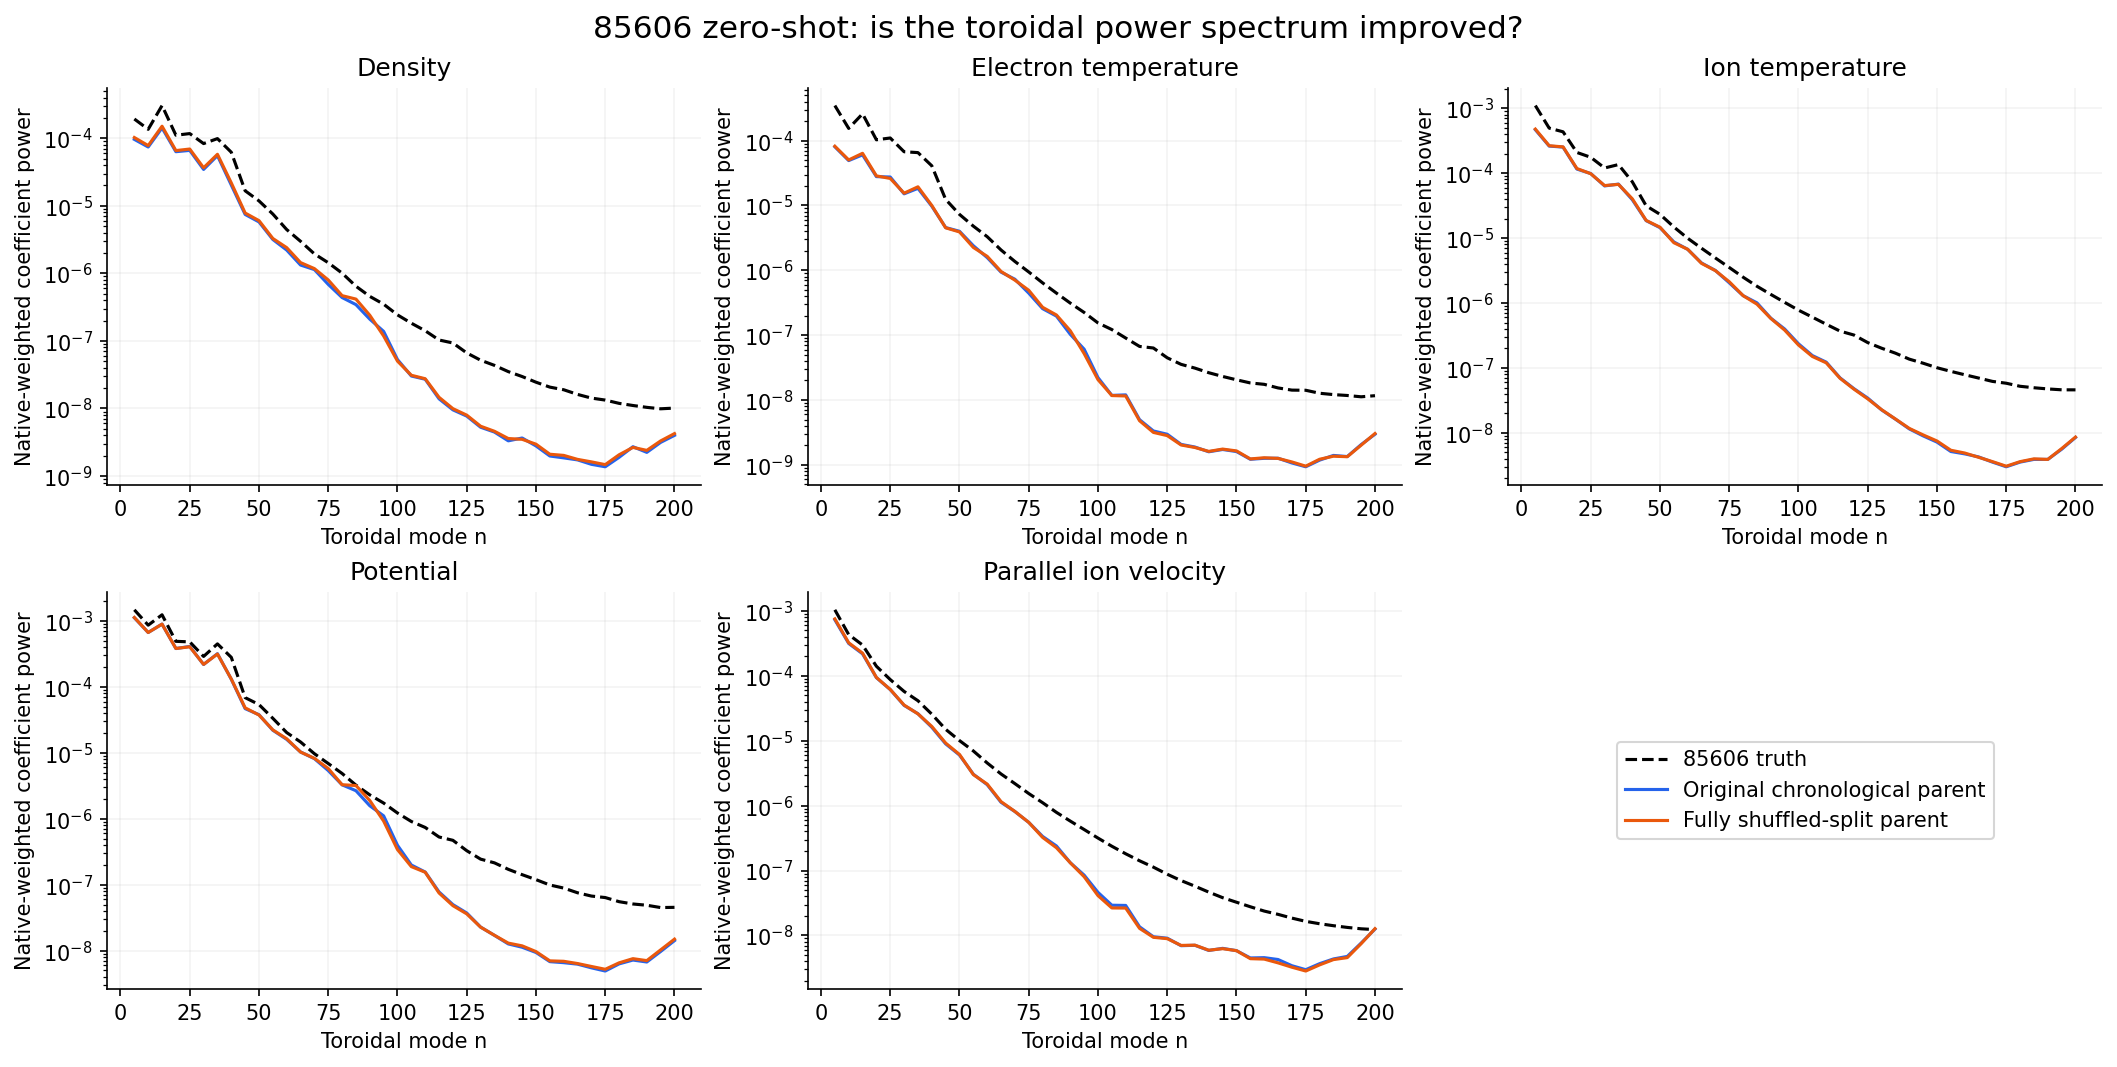
Small target-data fractions help. At 25%, fluctuation and transport scores have not all reached the 100% reference.
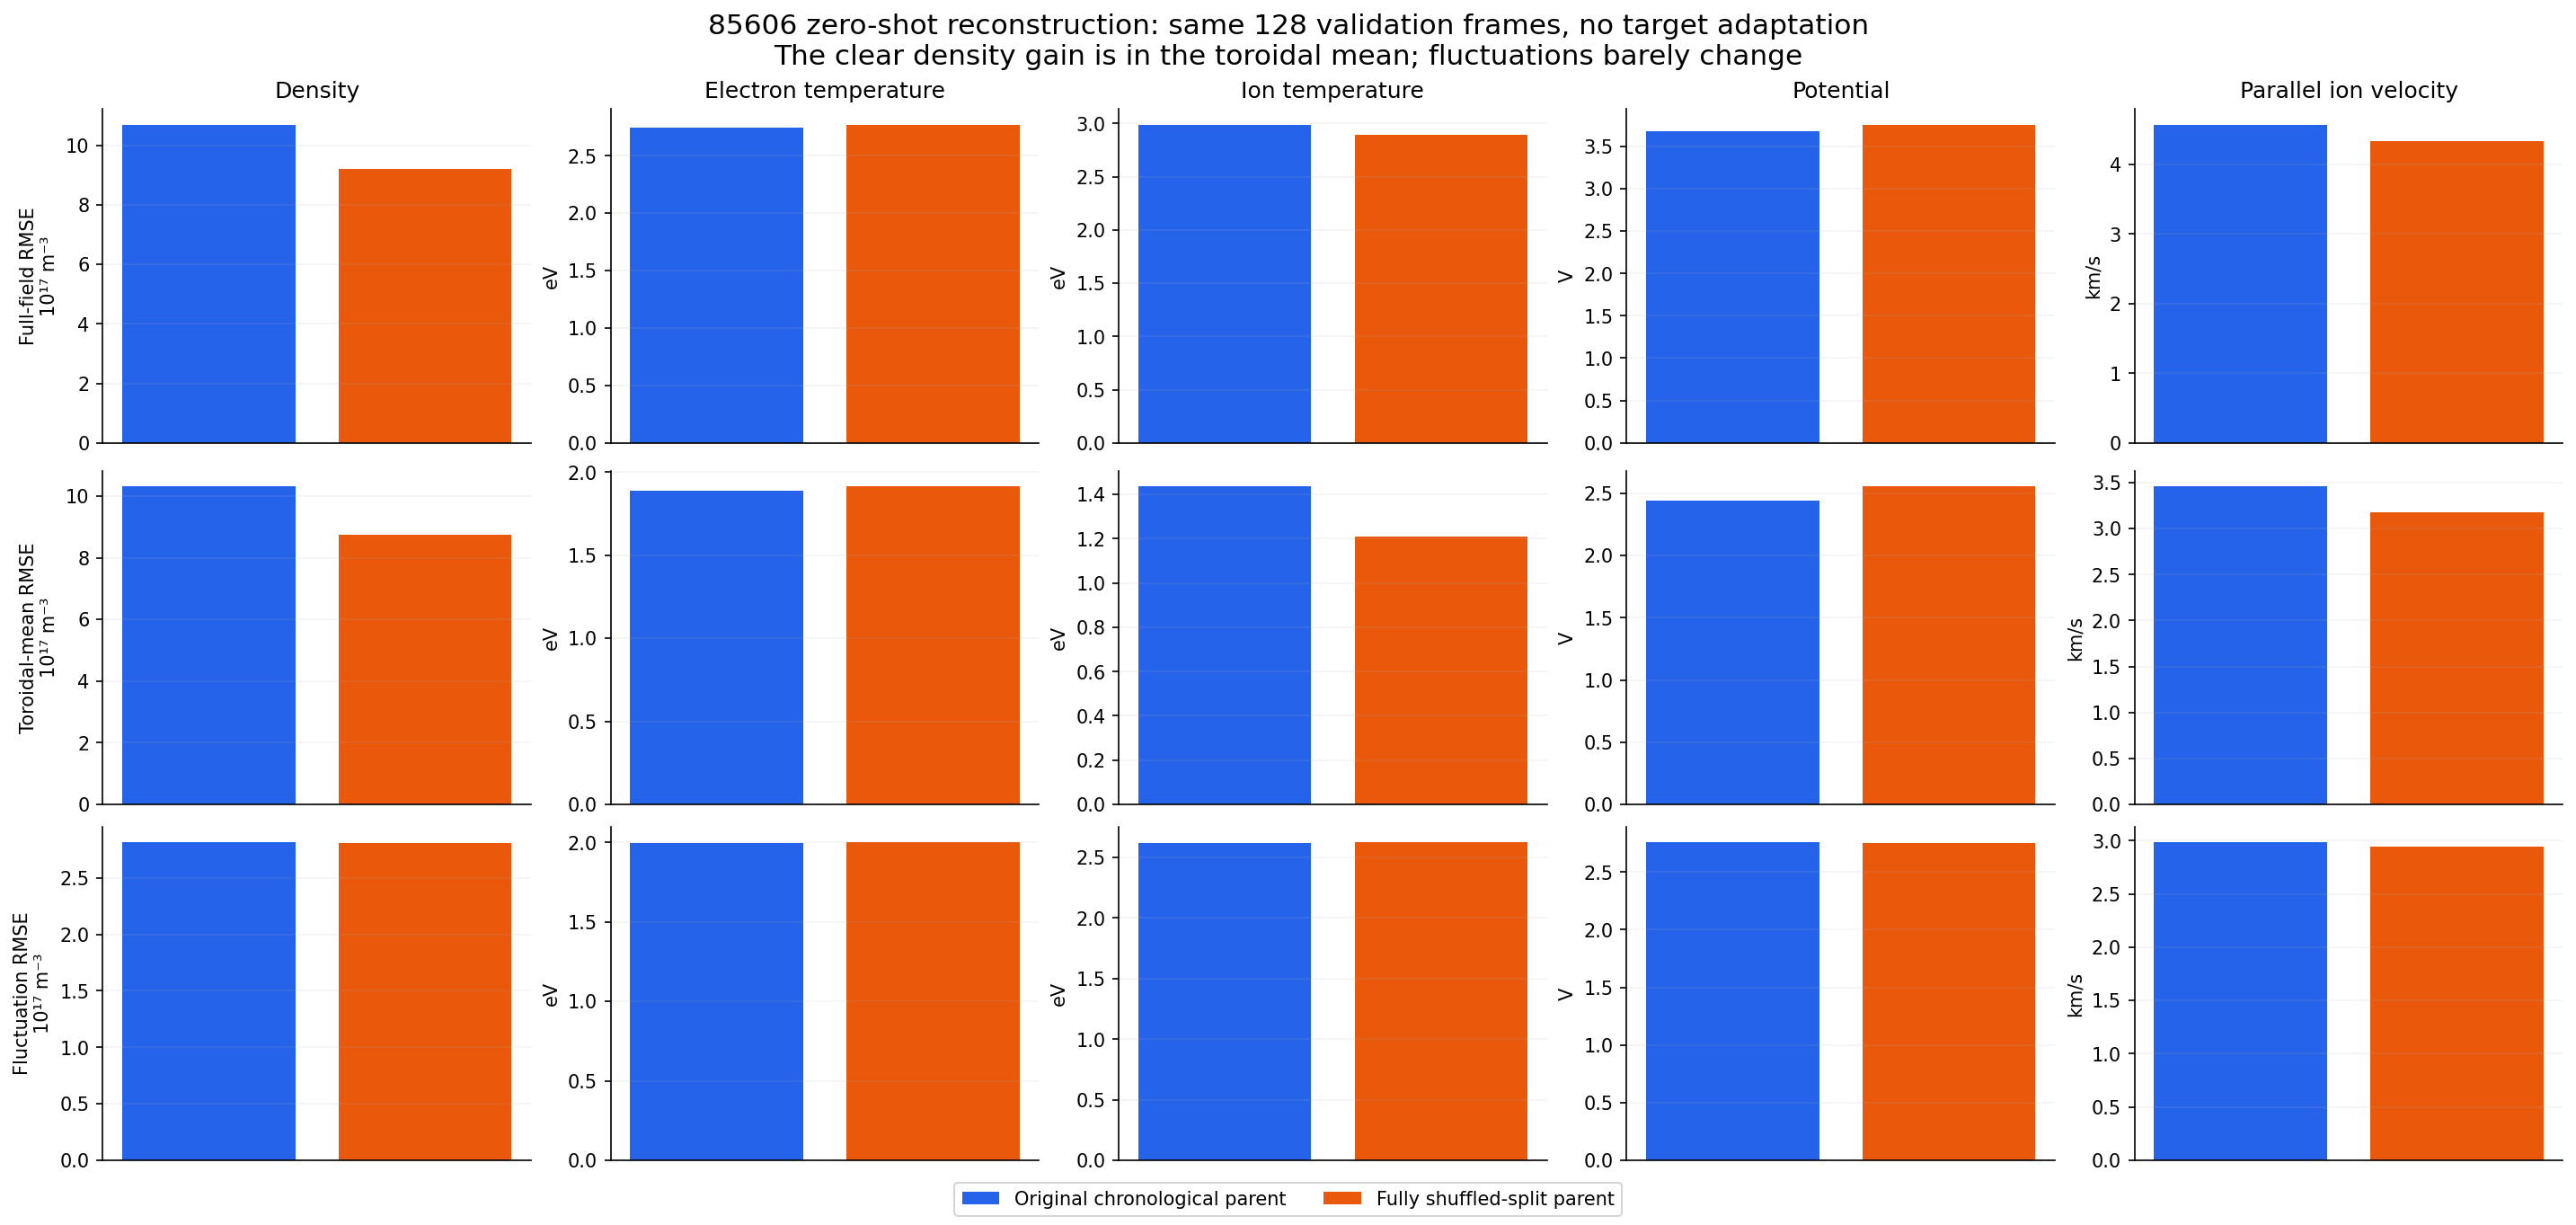
All five fields across 85606 fine-tuning fractions. PNGLocal and integrated particle / internal-energy transport versus target-data fraction. PNGChronological versus shuffled-split compressors on common 85606 validation. PNGMore figures from the earlier reports (5)Which components remain worse at 5–25%? PNGFluctuation power recovered across fractions PNGPower by mode at selected fractions PNGShuffled versus original on 85604 PNGDoes shuffling fix target-shot spectral content? PNG
Local relationships between fields
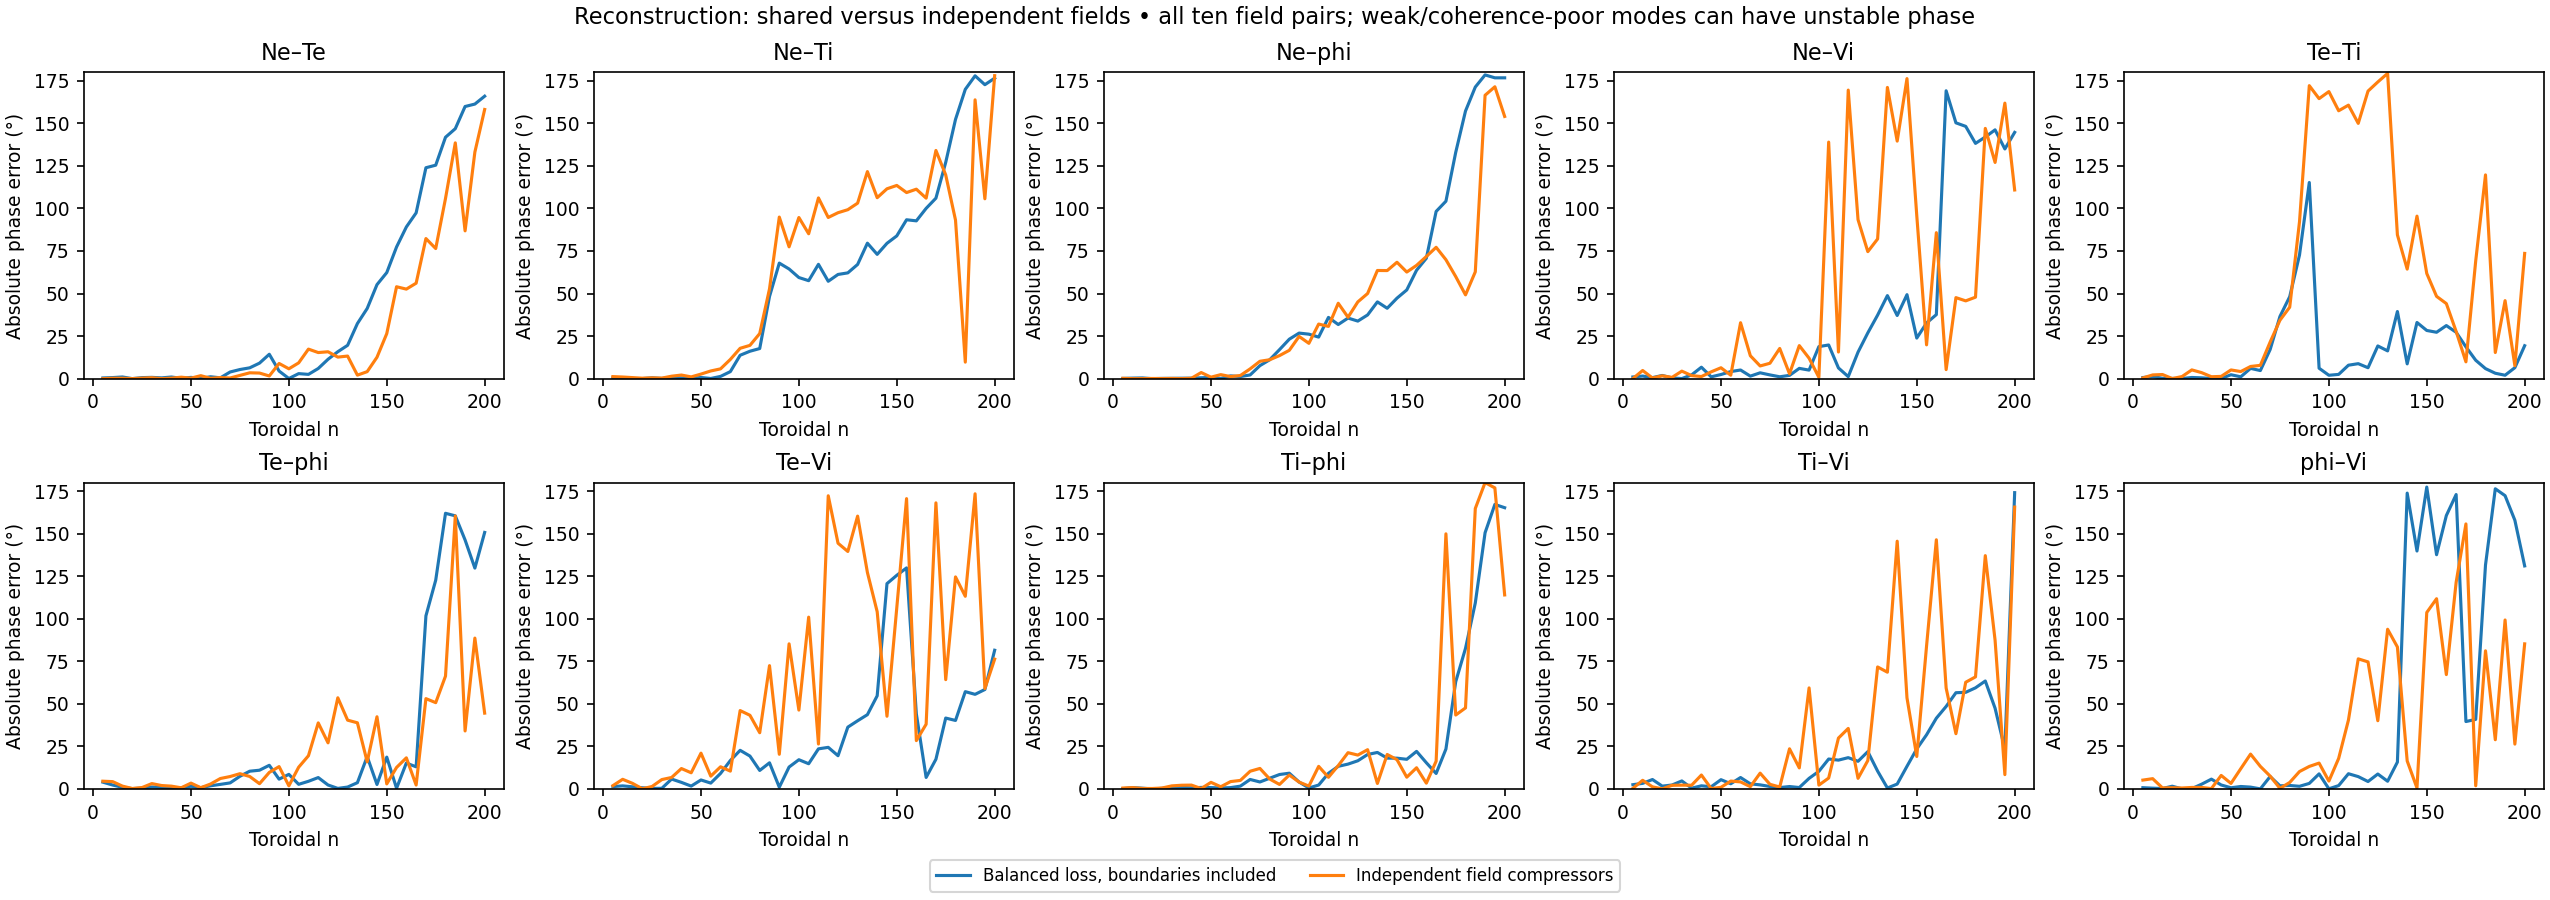
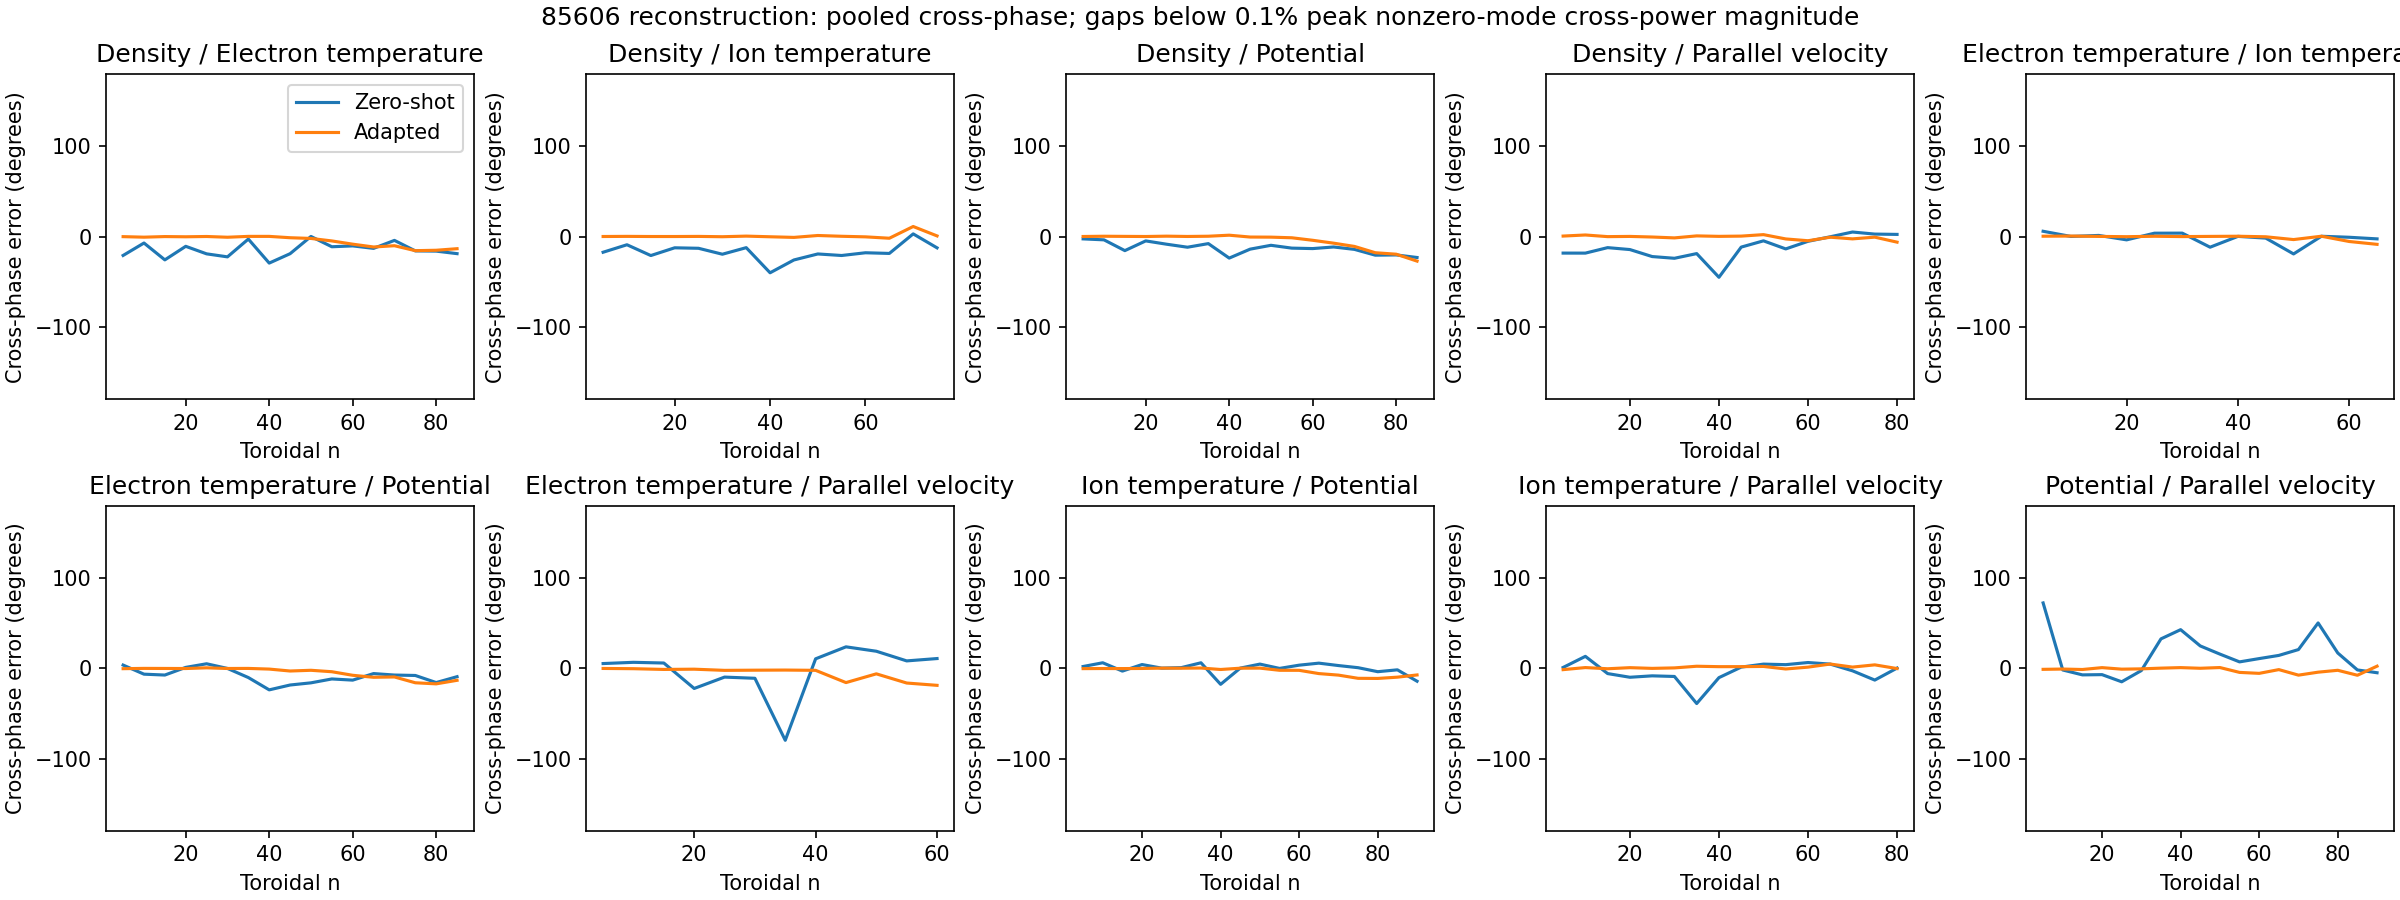
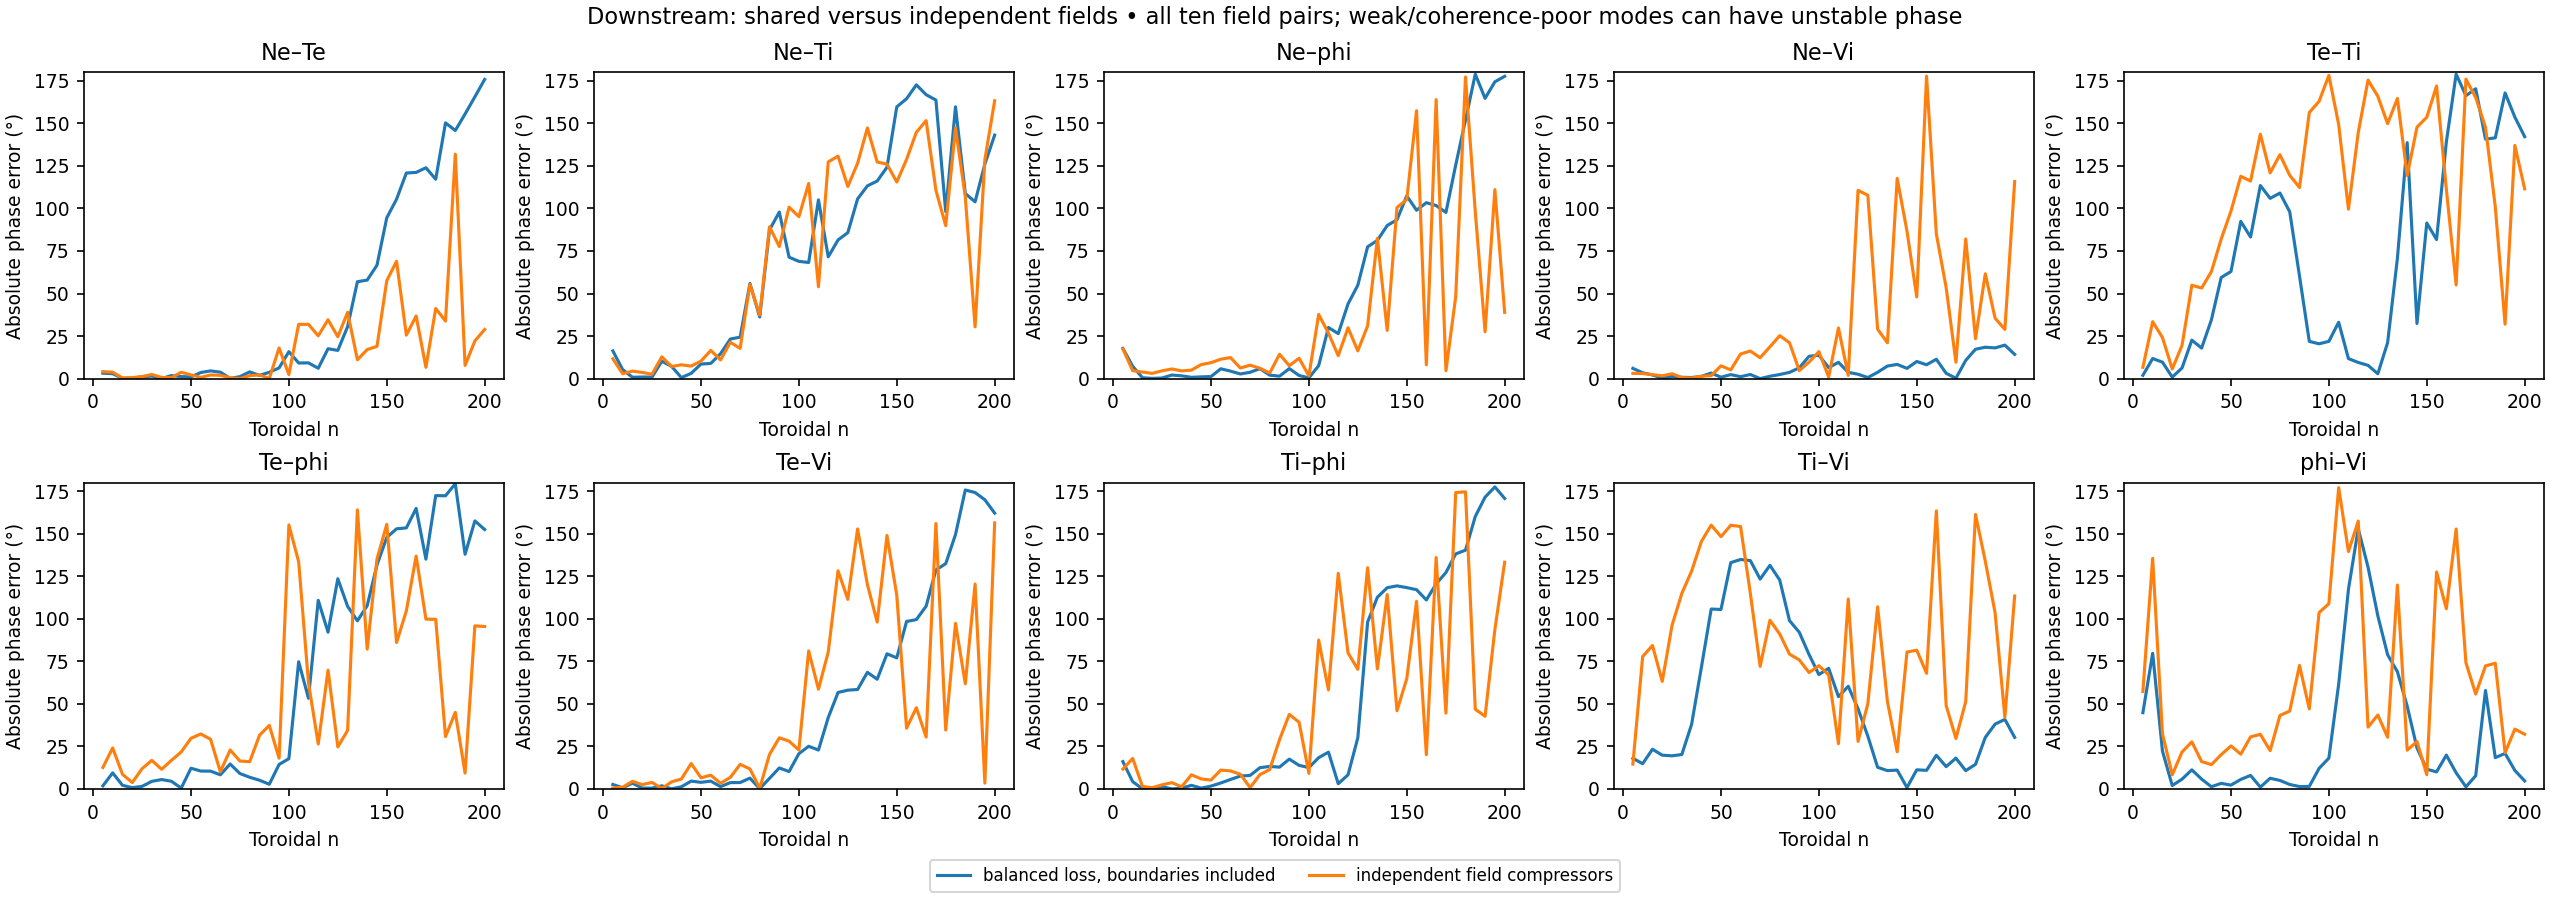
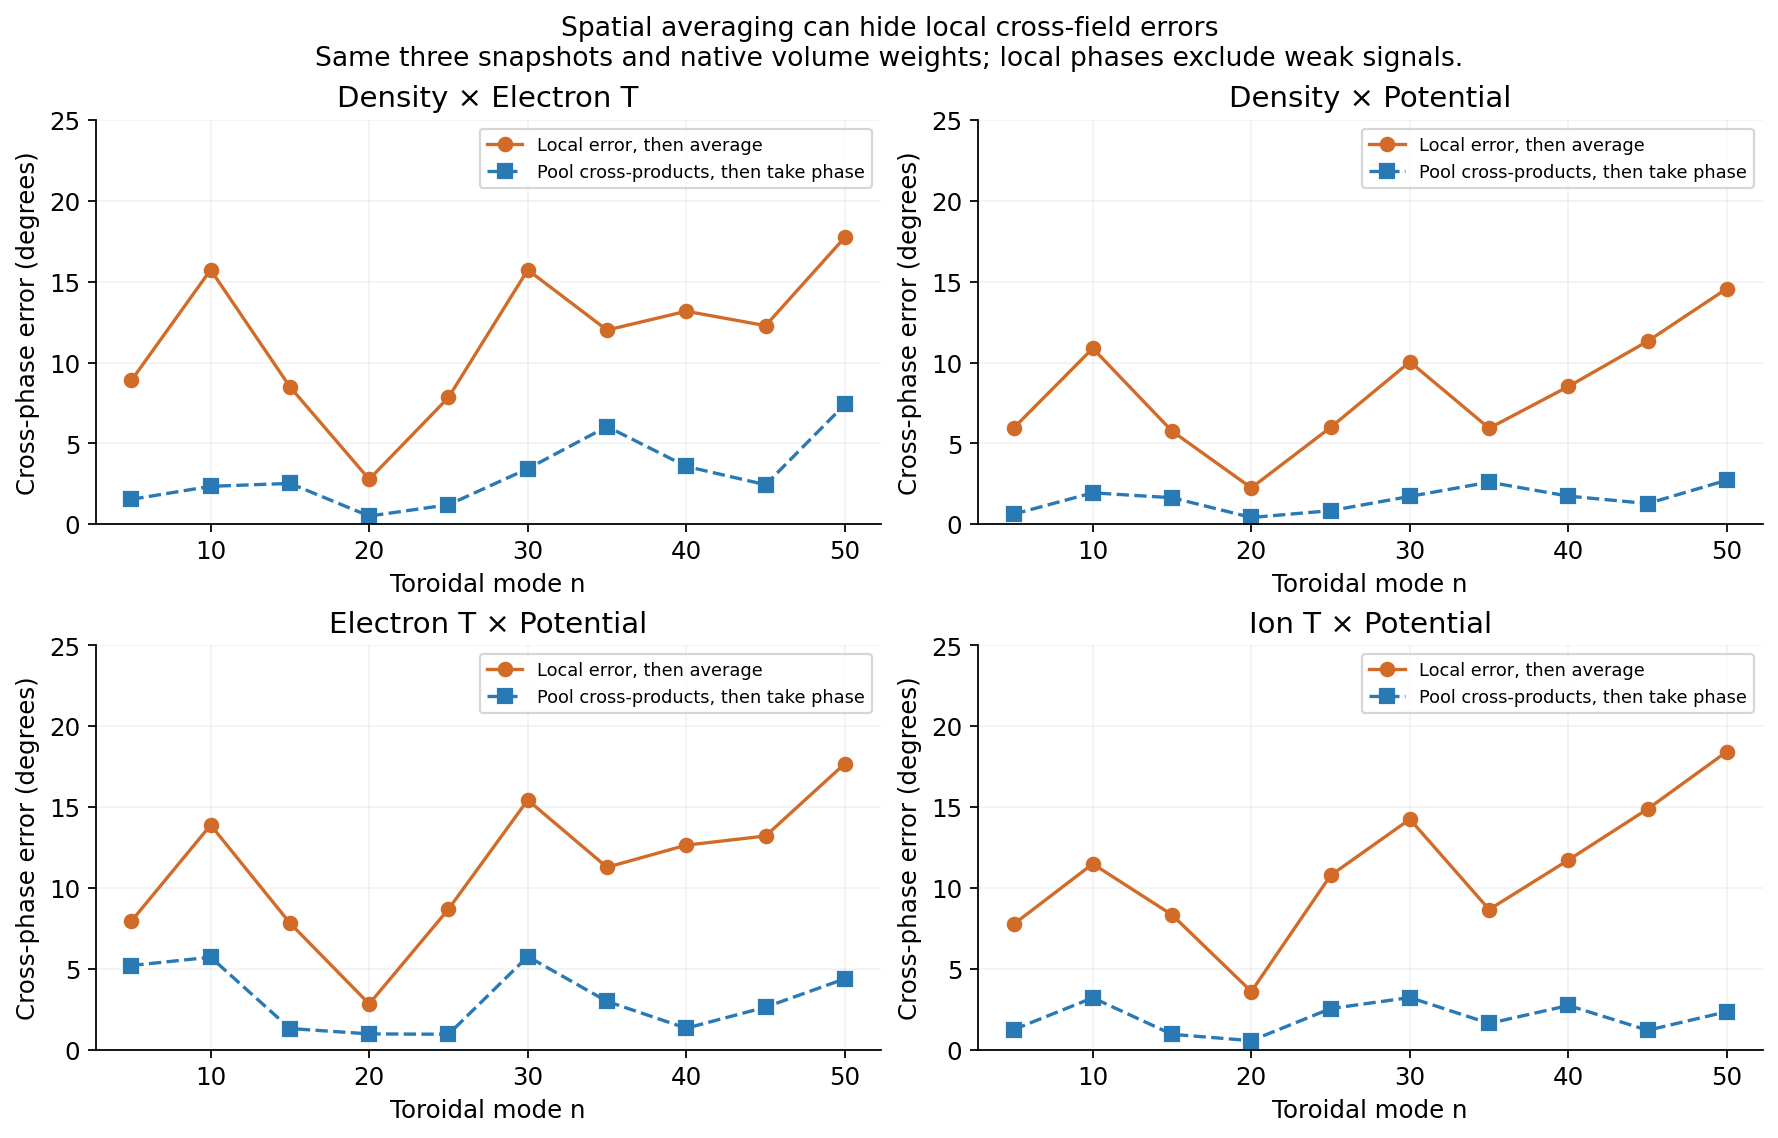
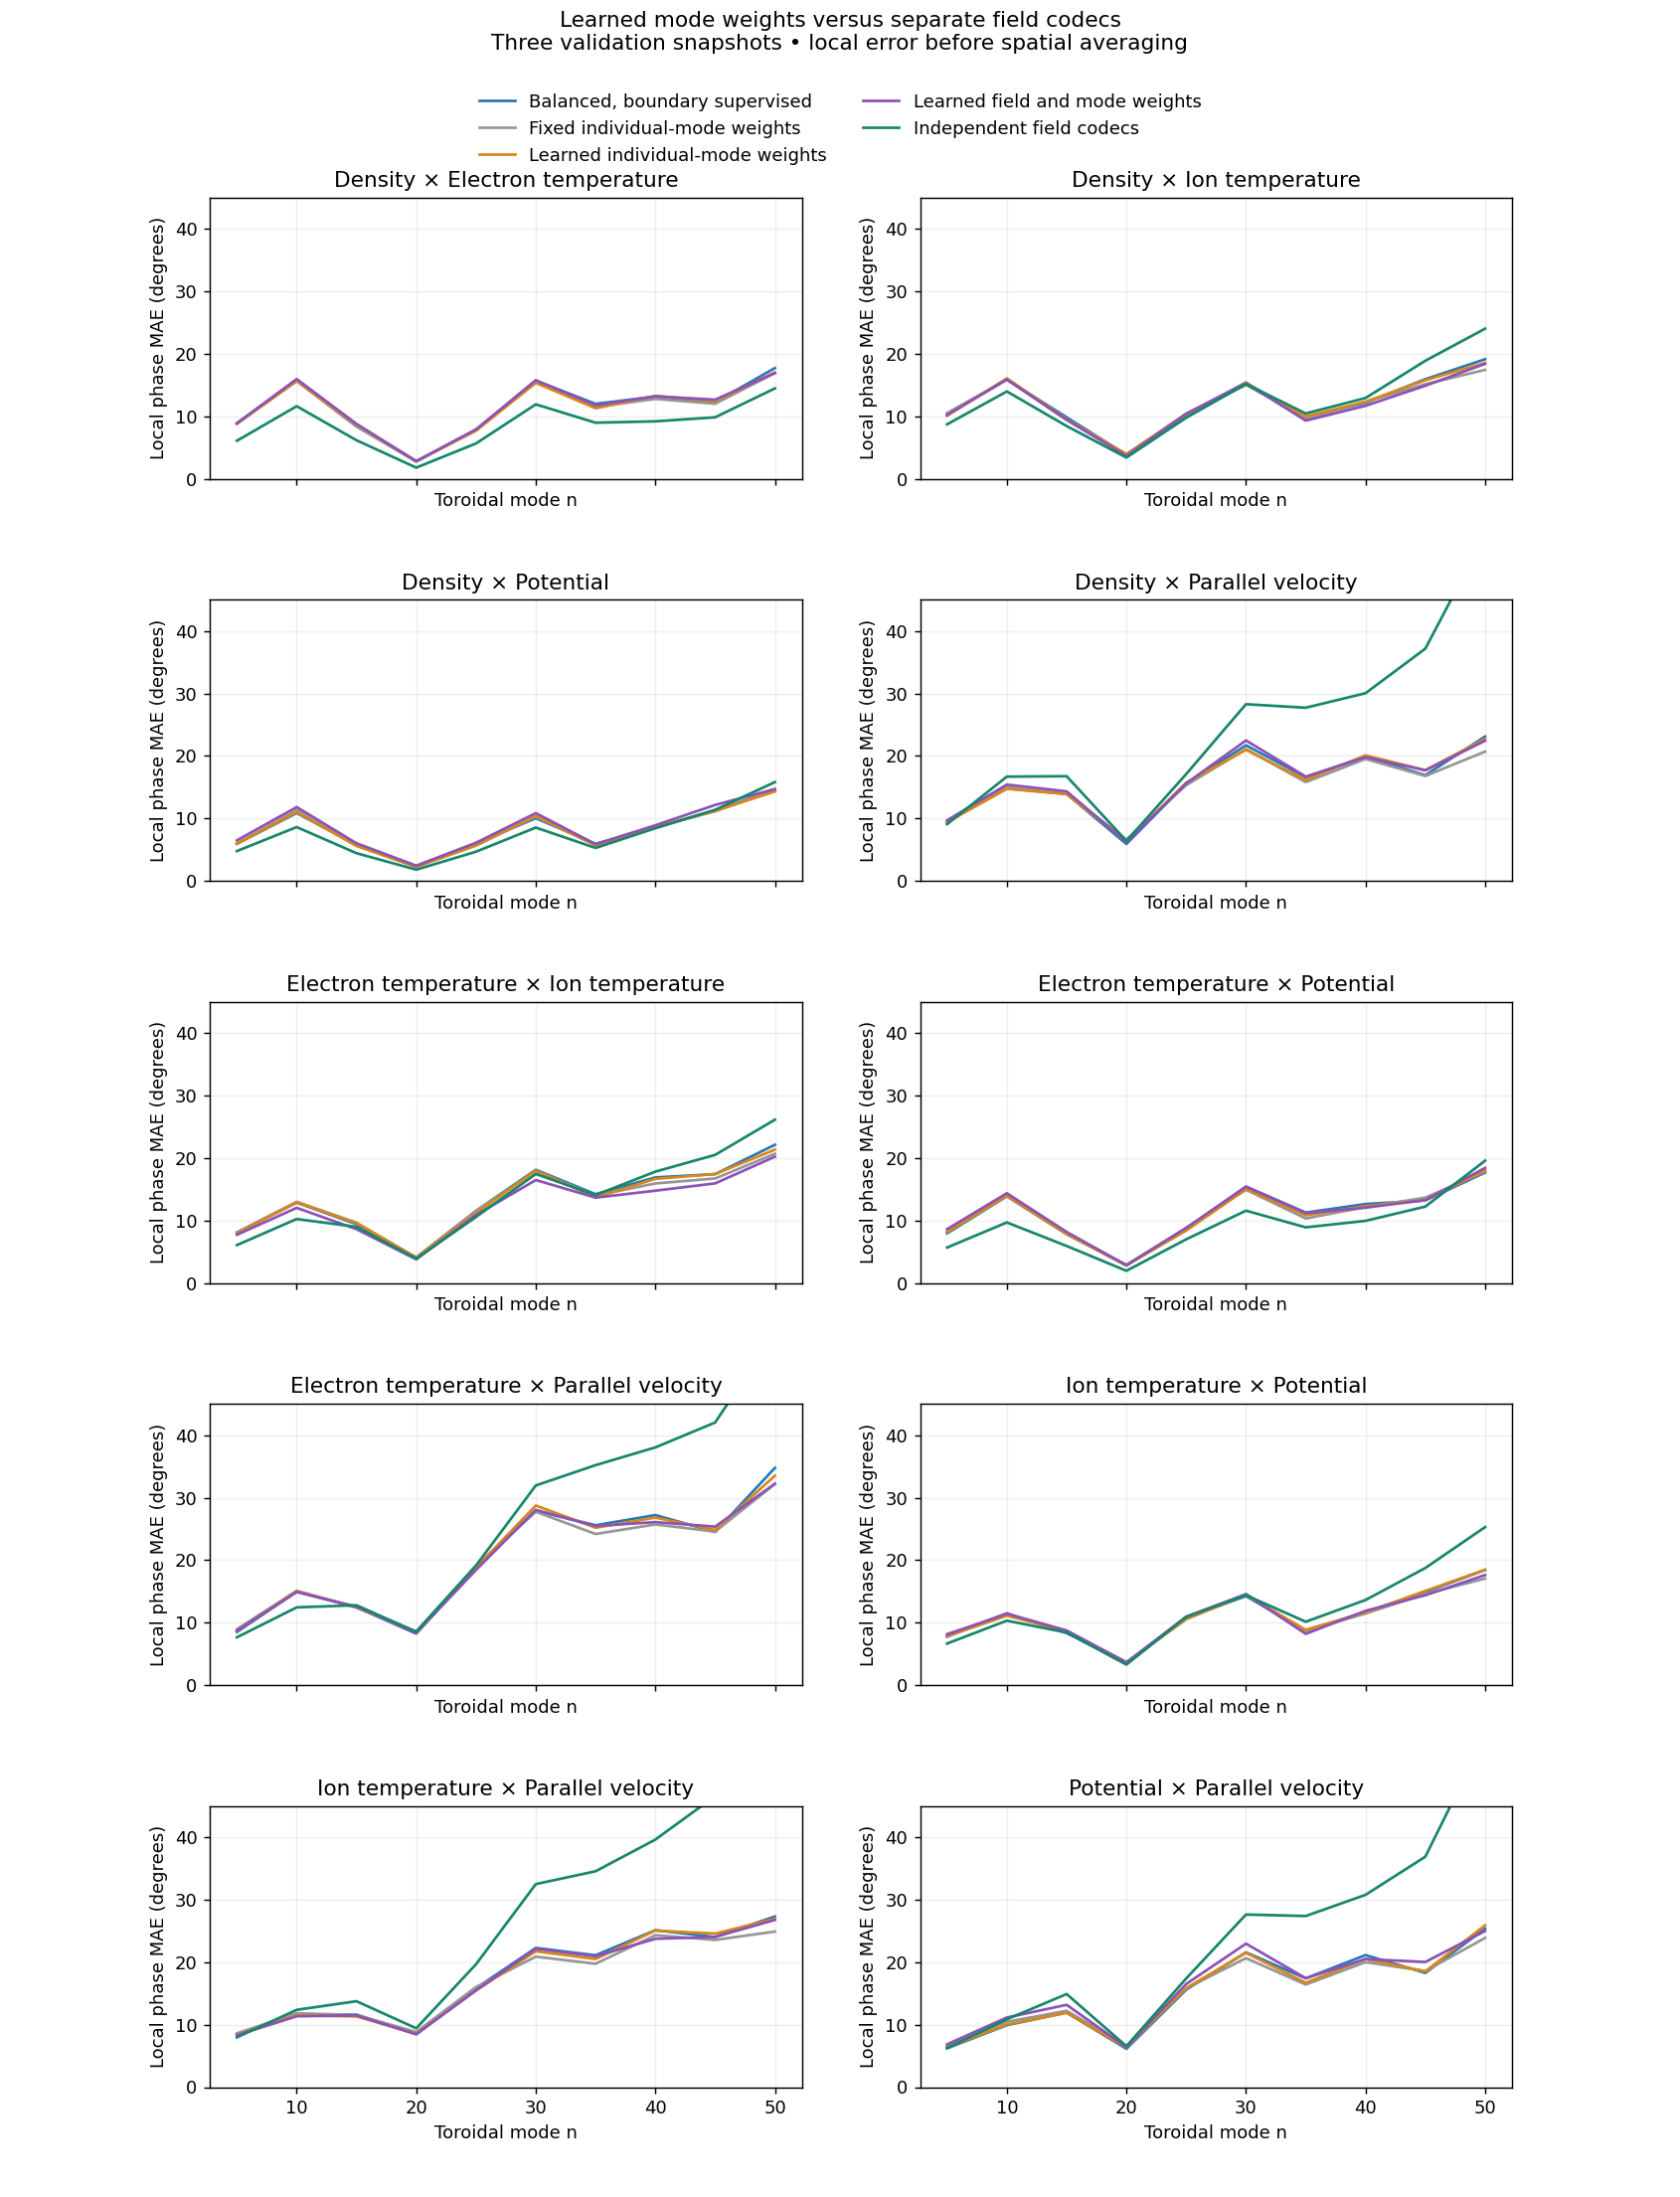
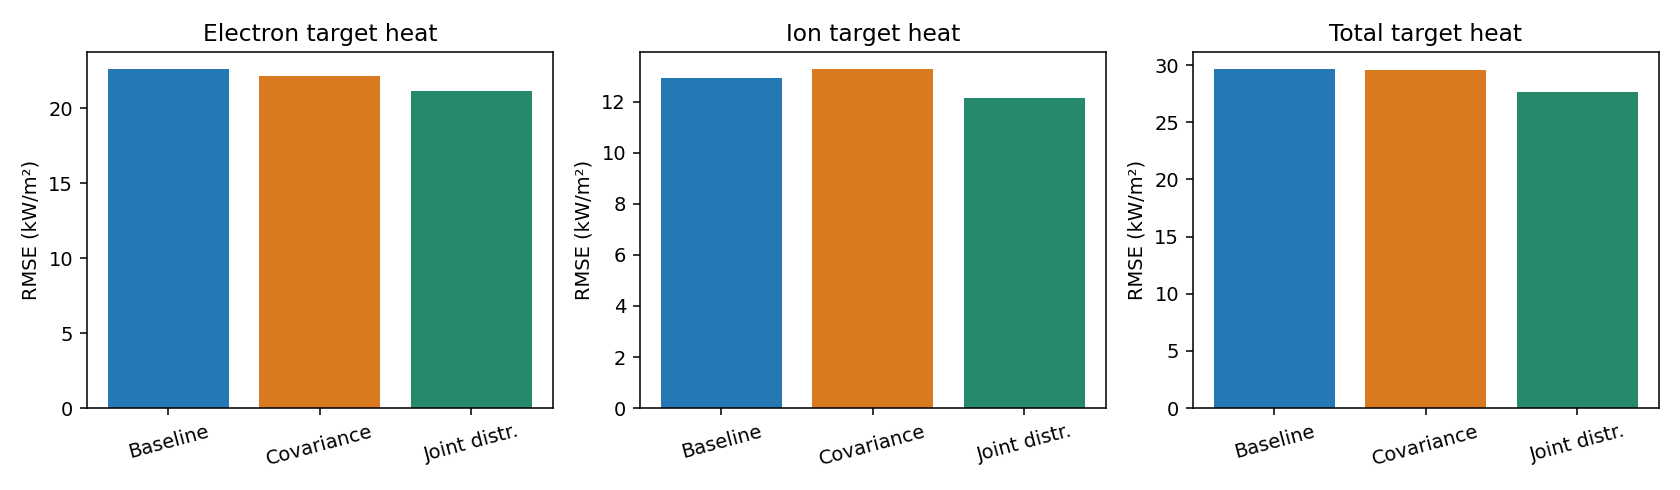
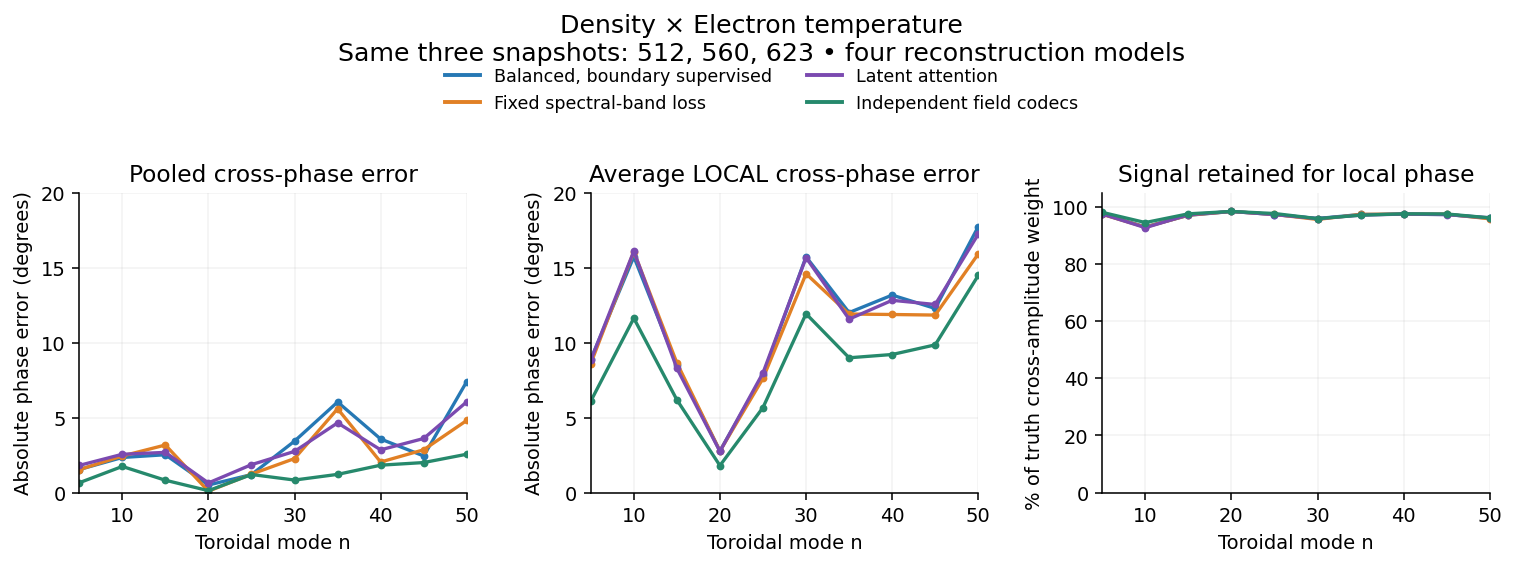
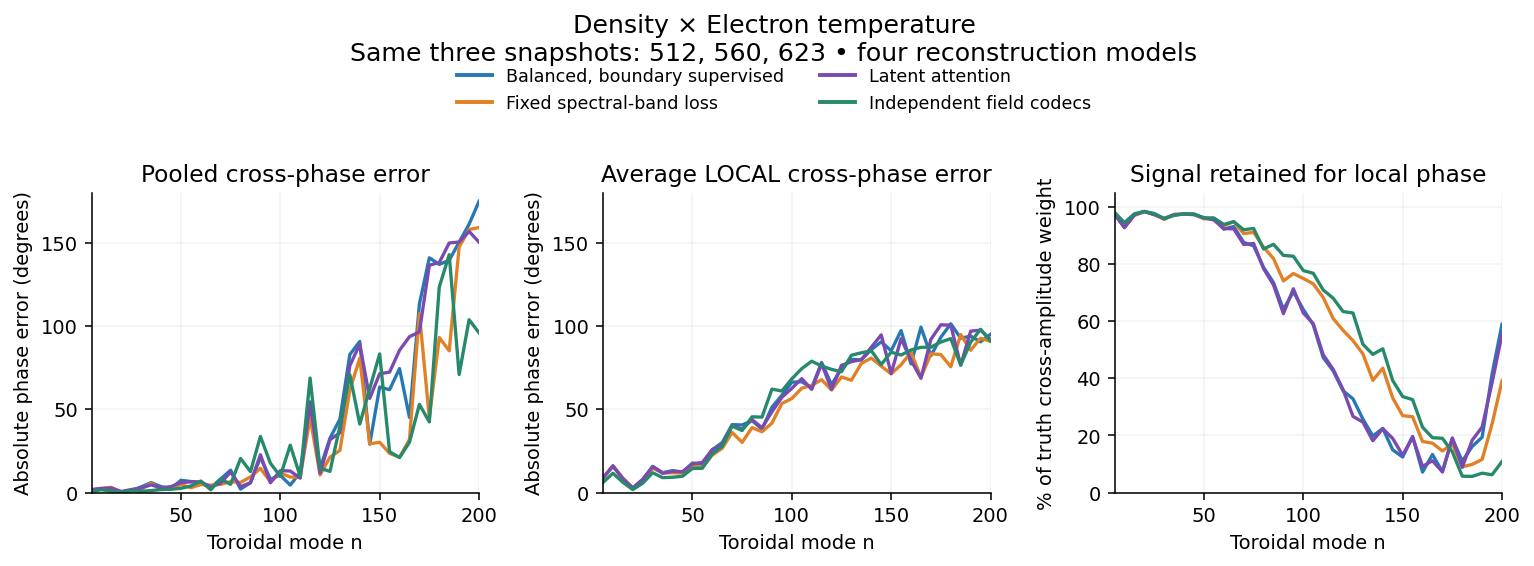
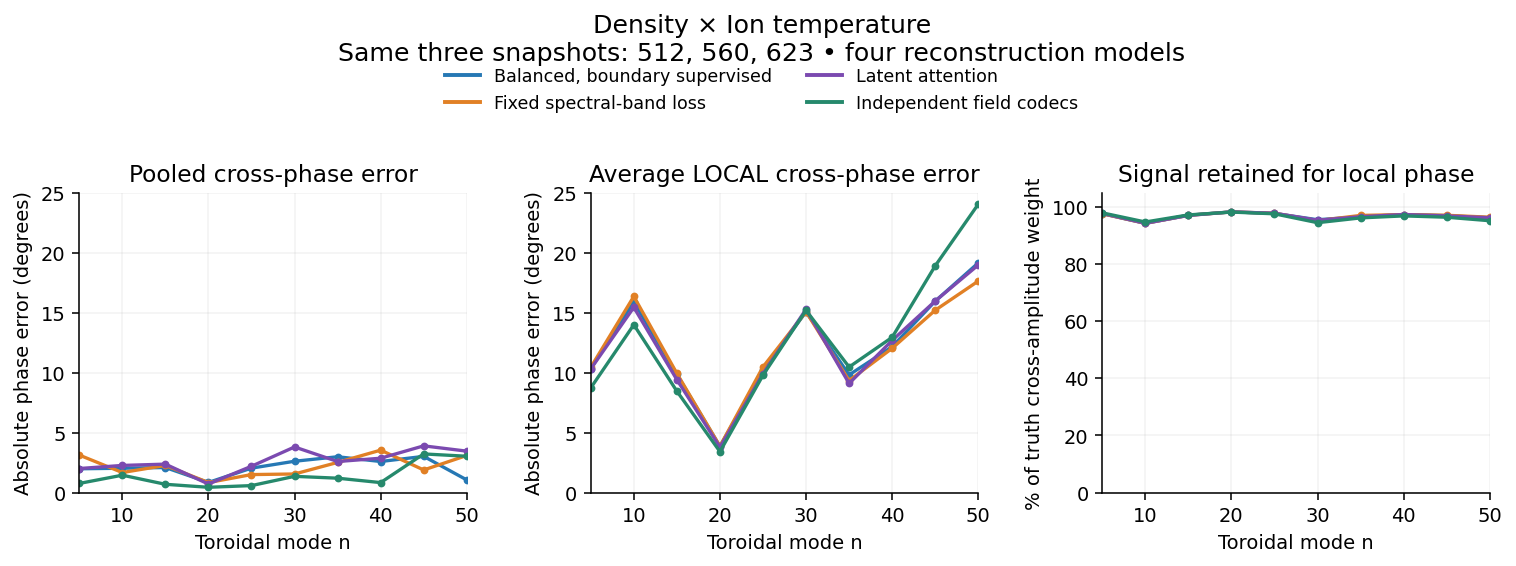
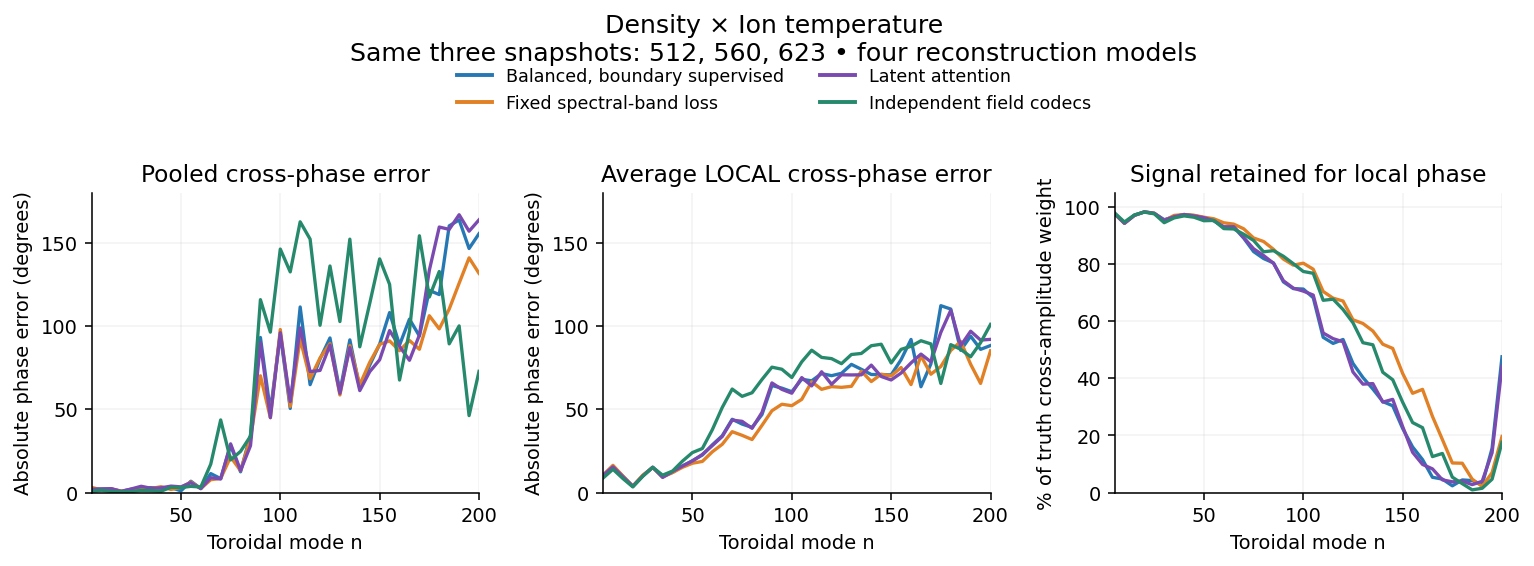
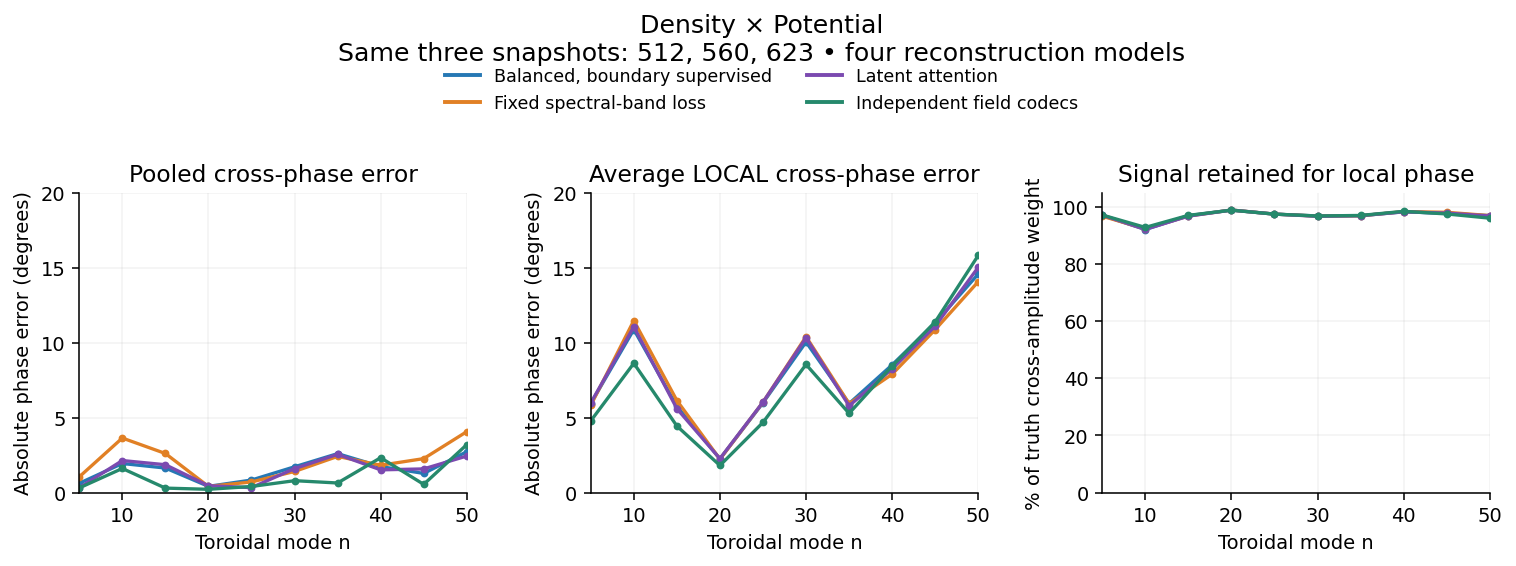
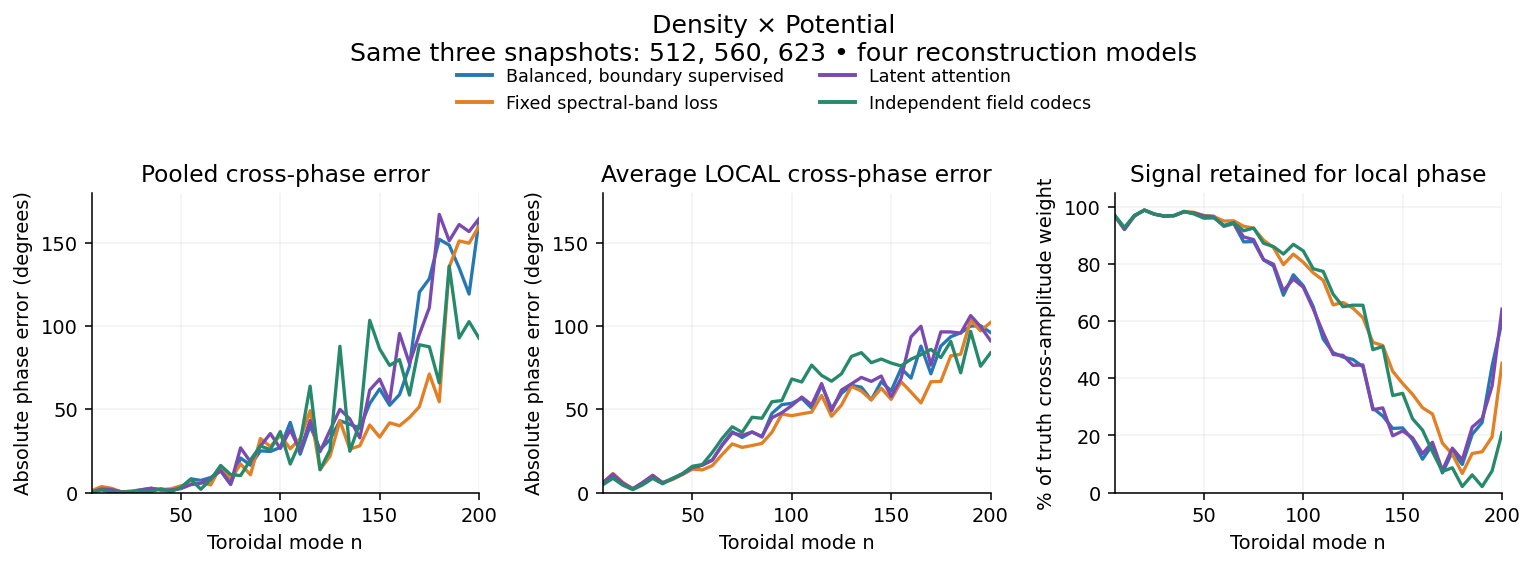
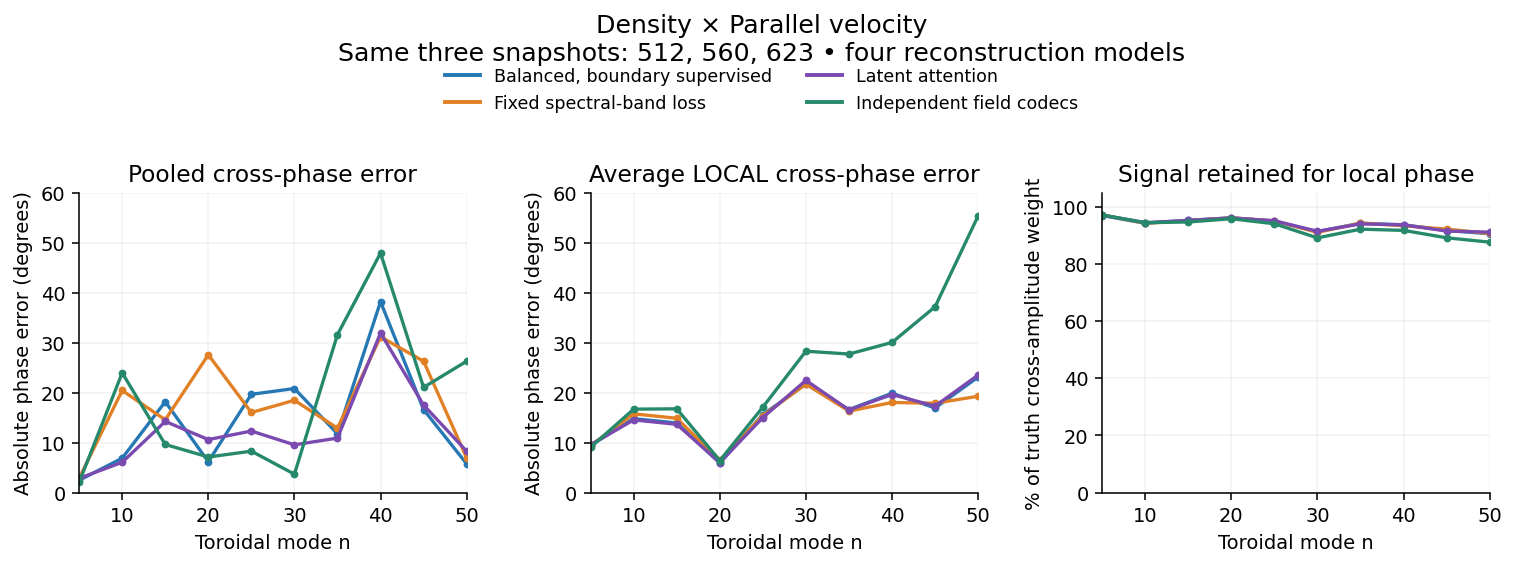
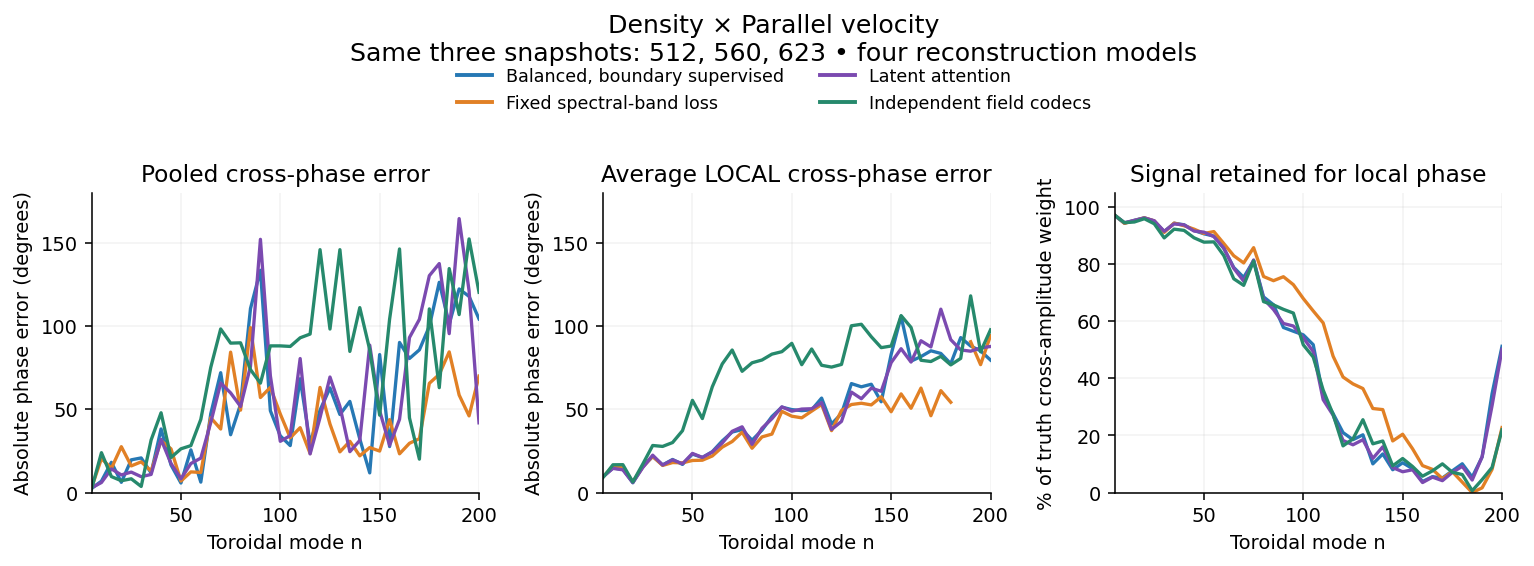
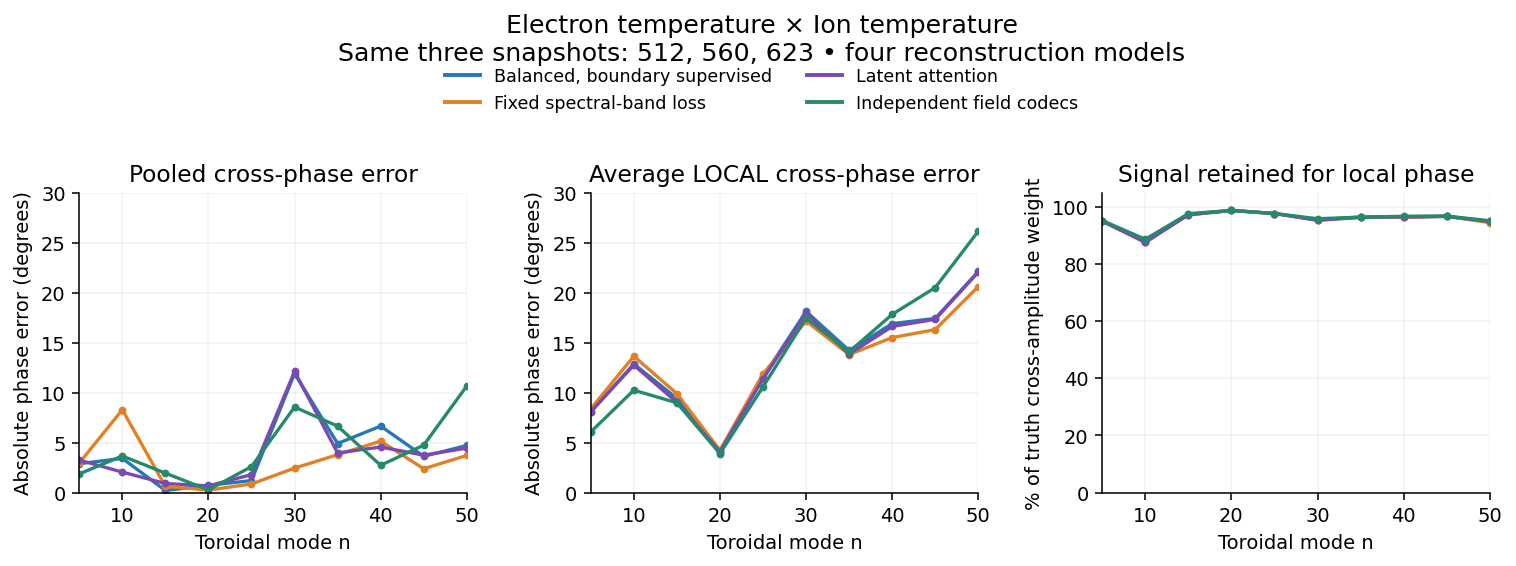
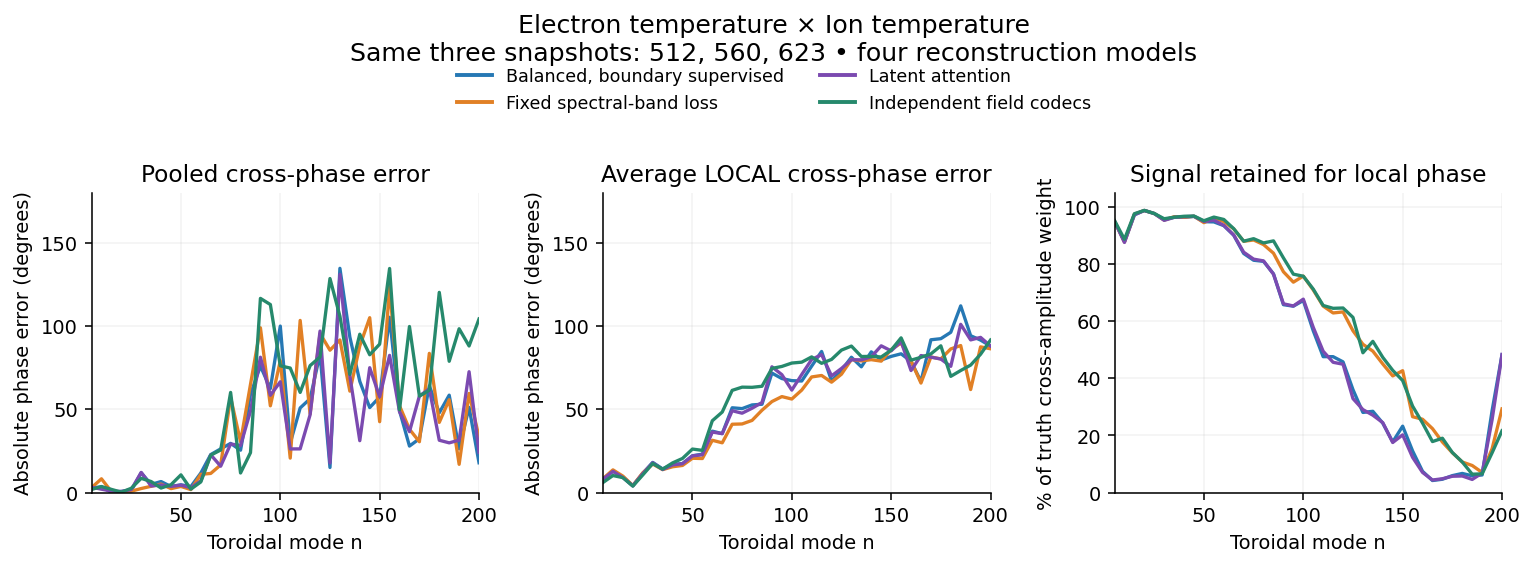
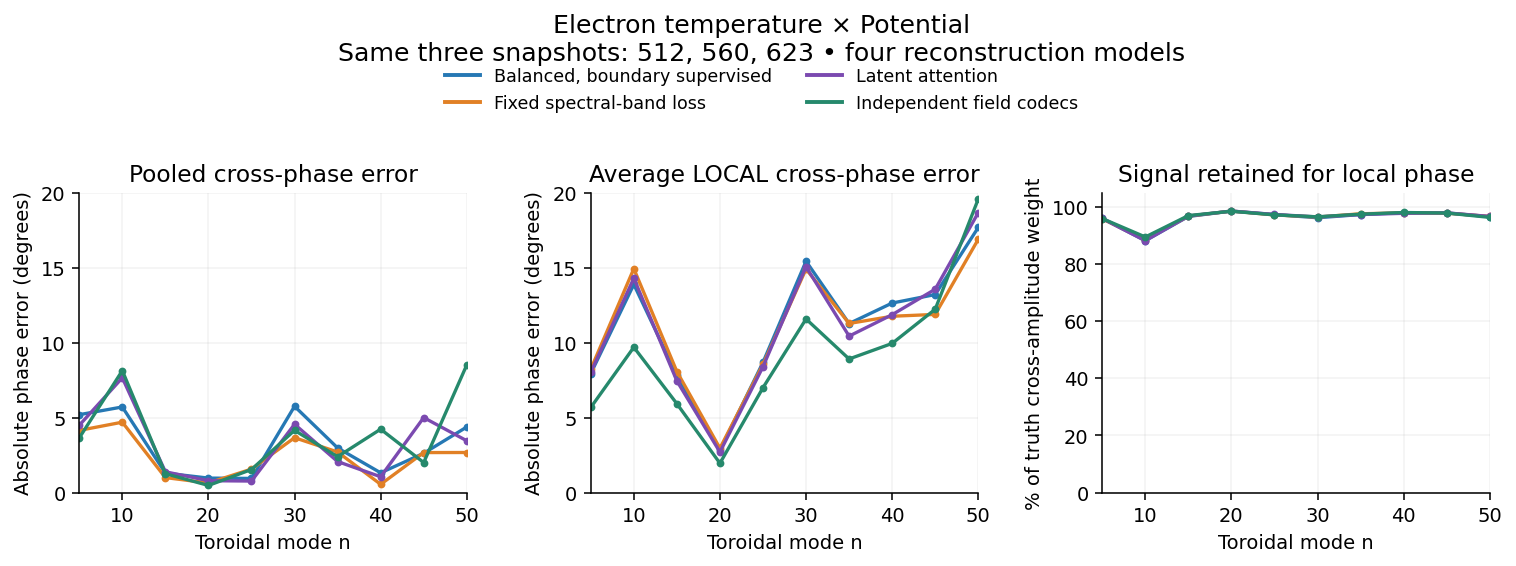
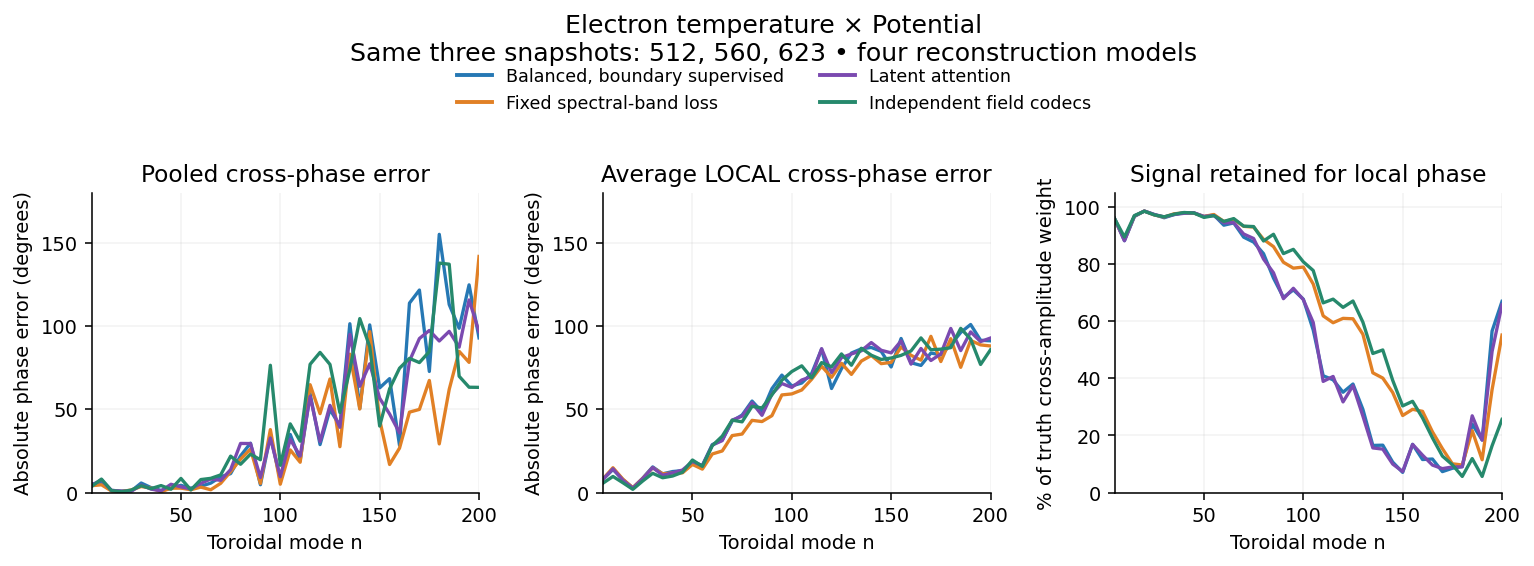
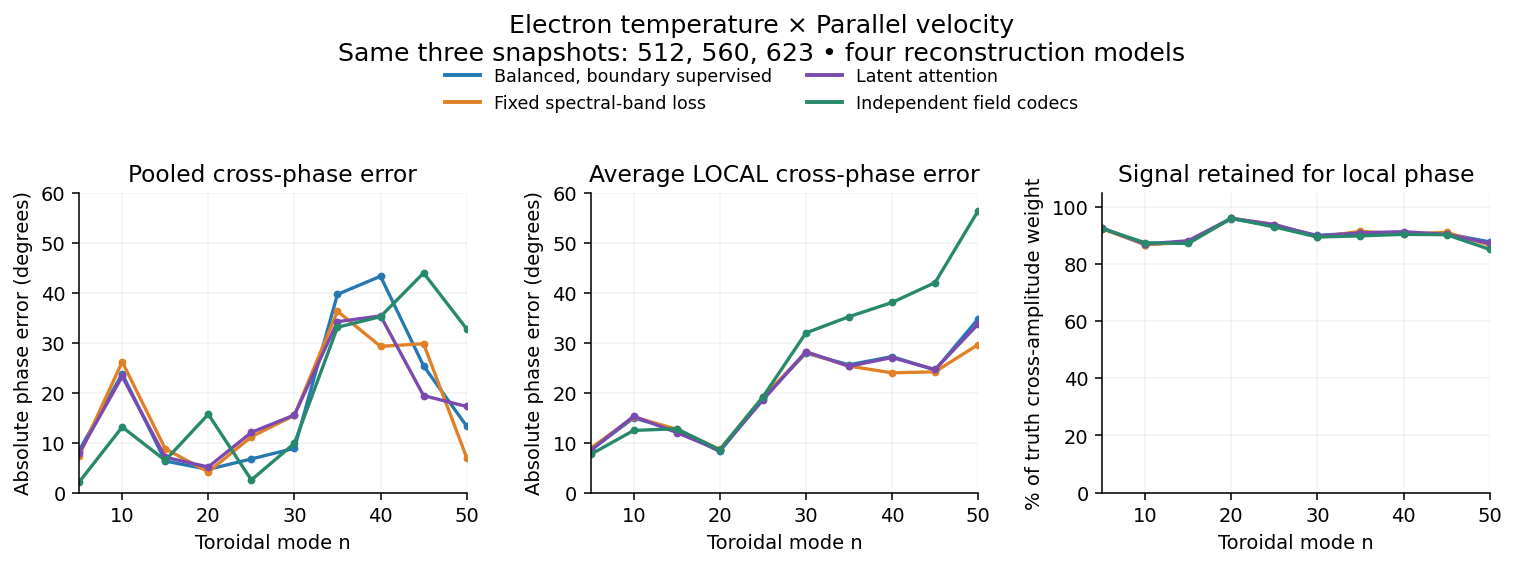
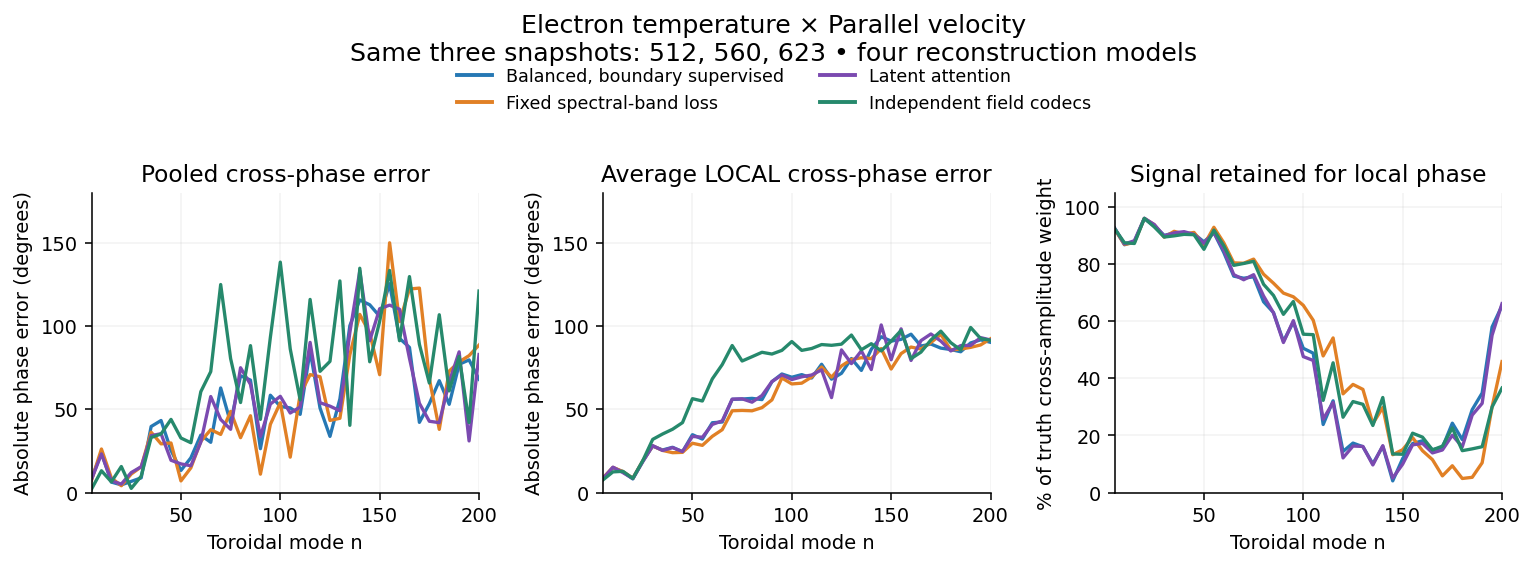
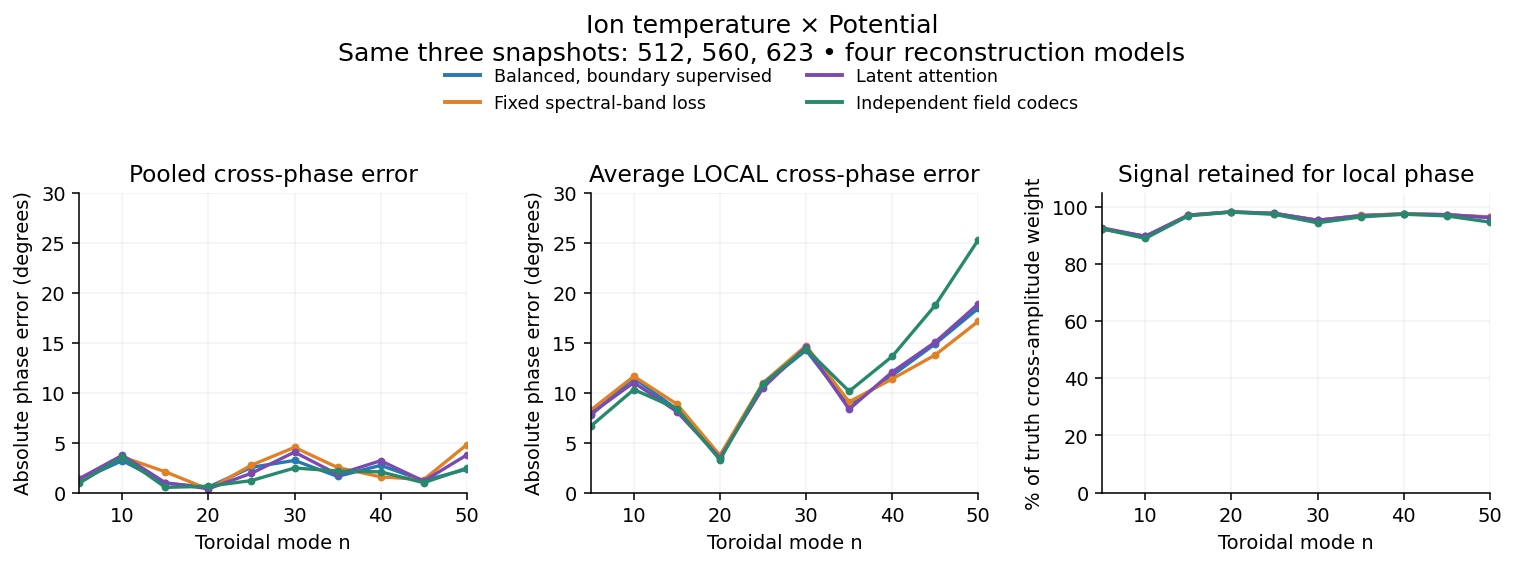
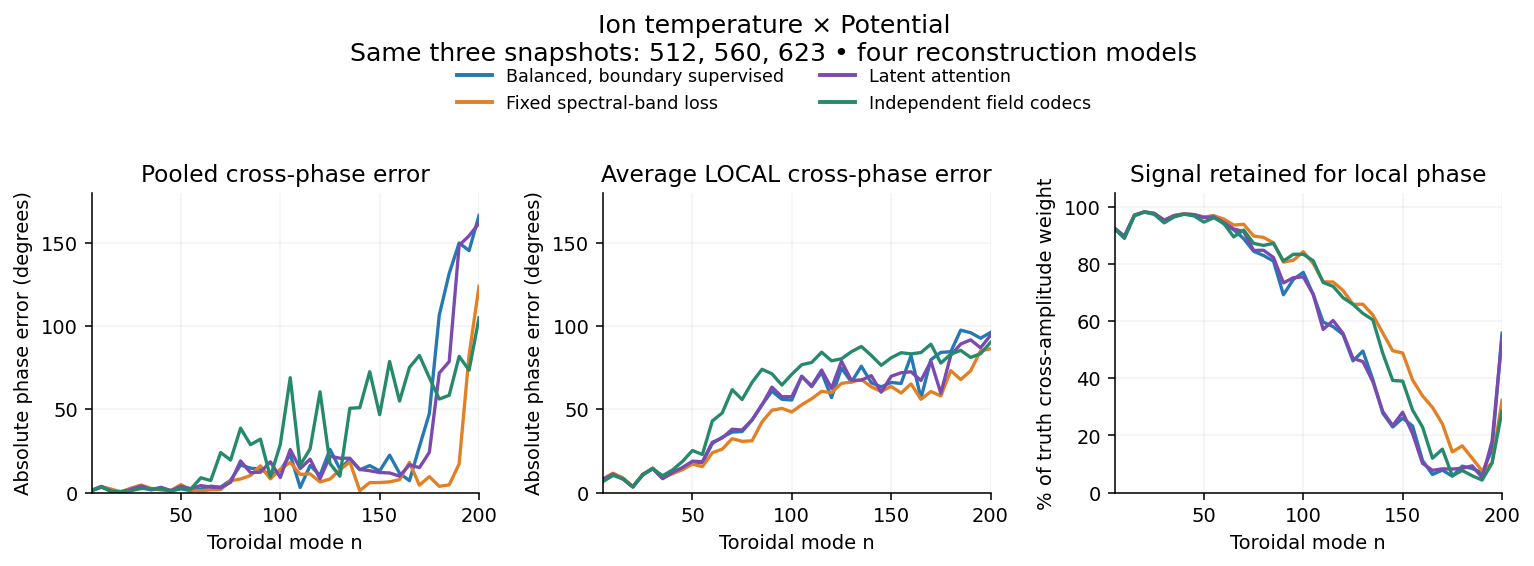
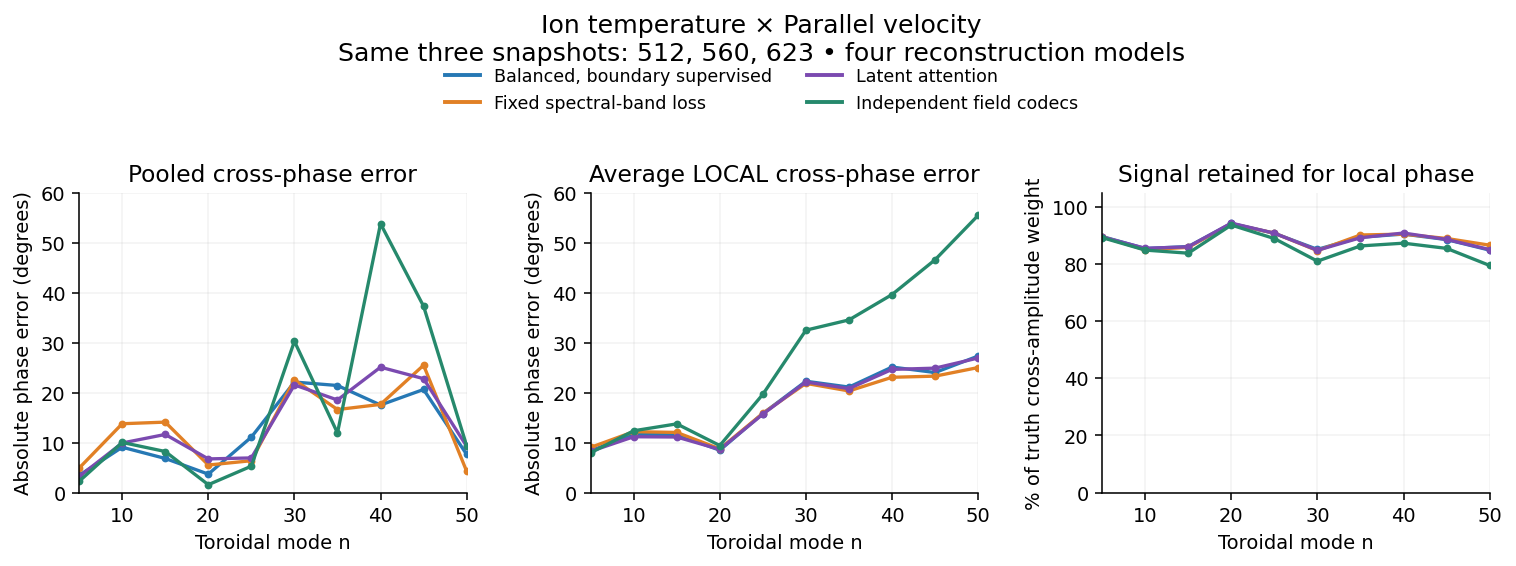
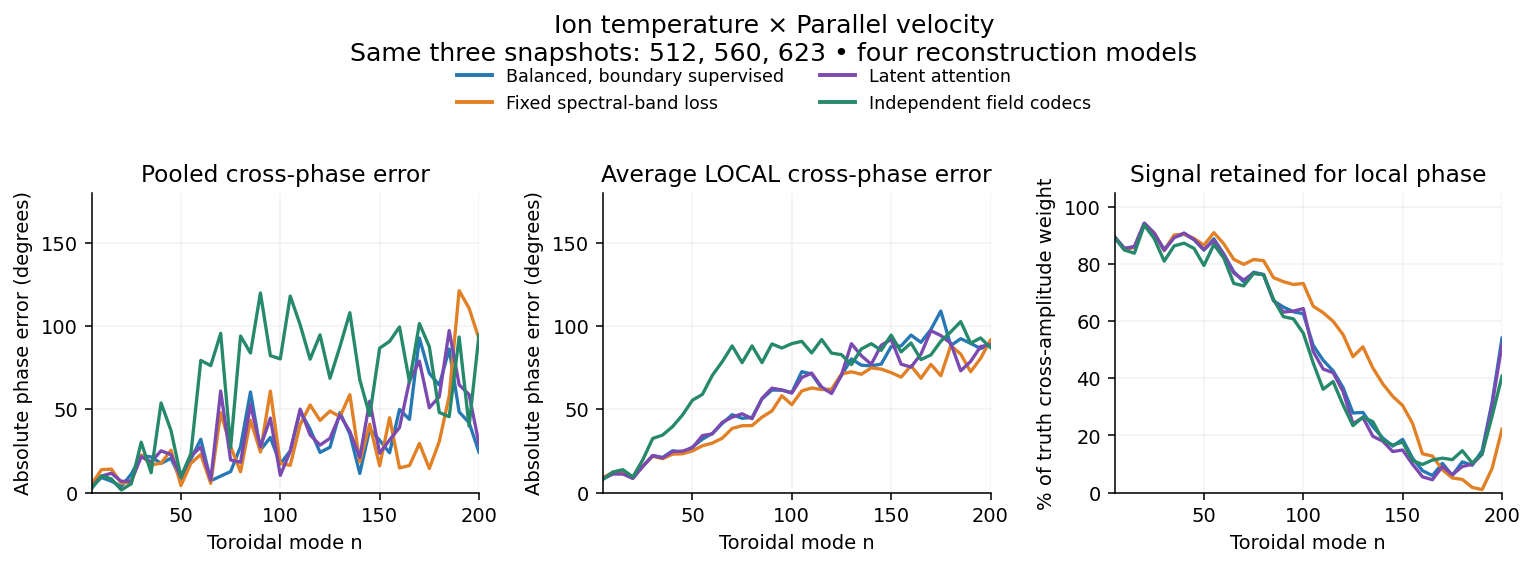
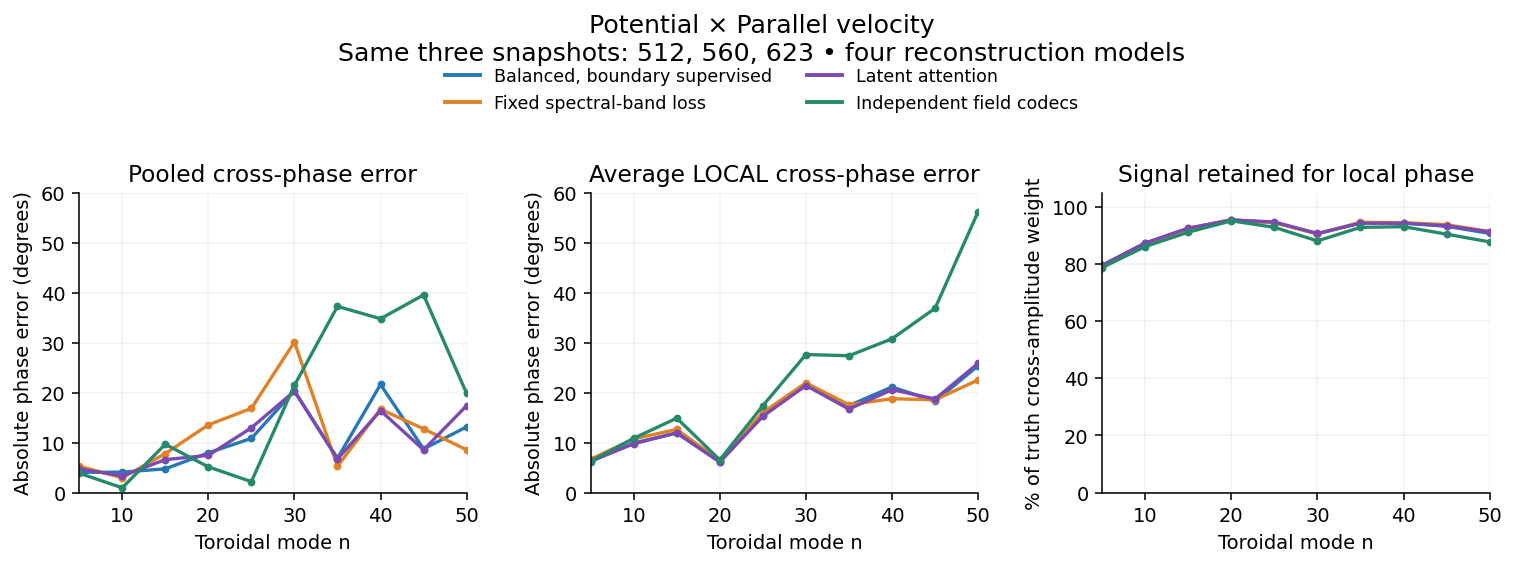
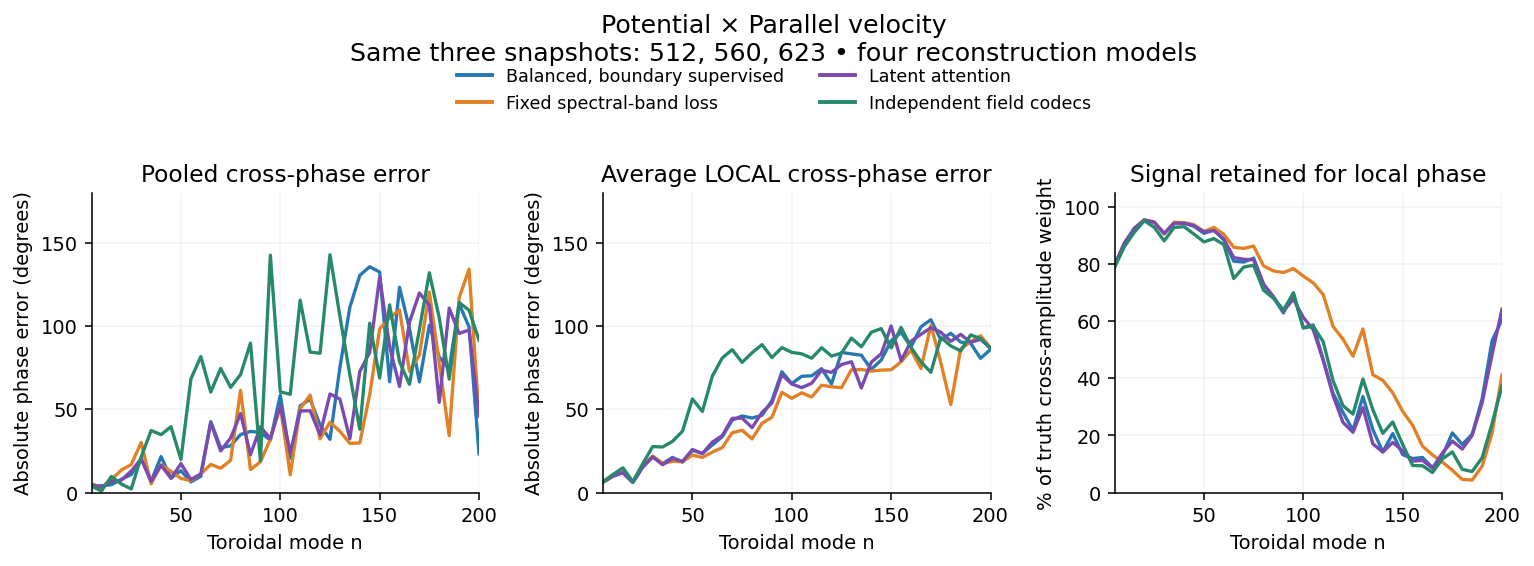
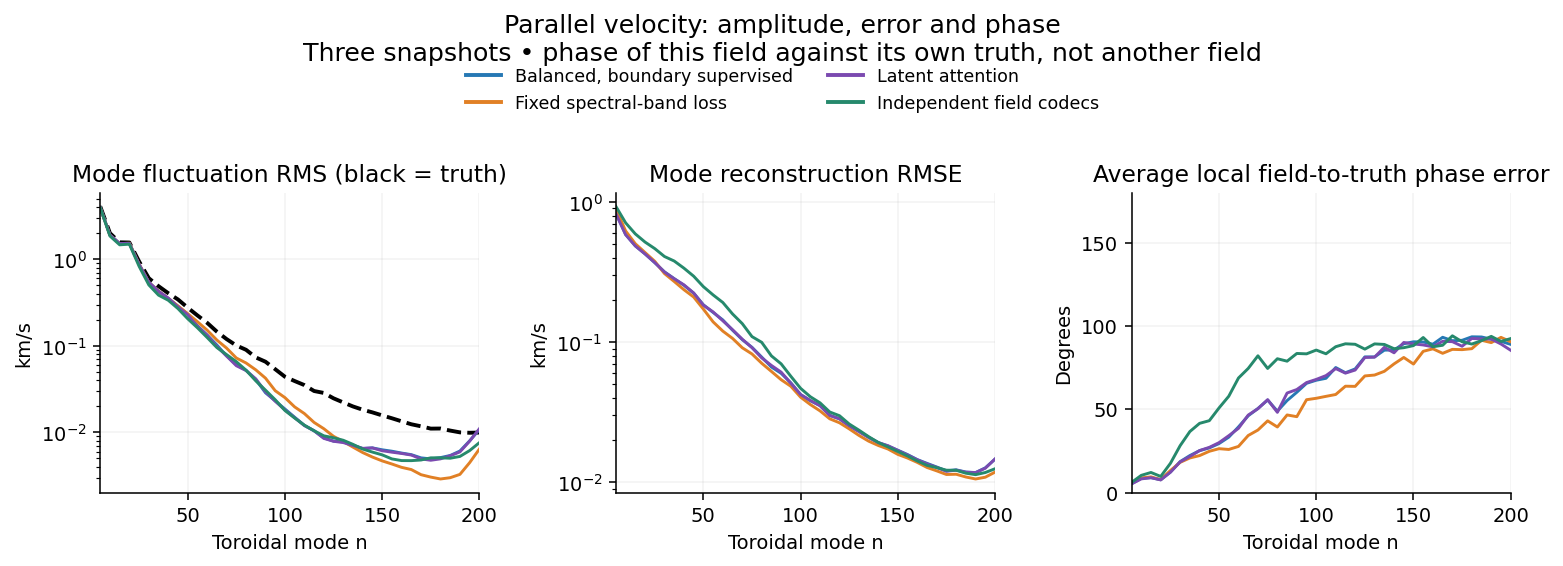
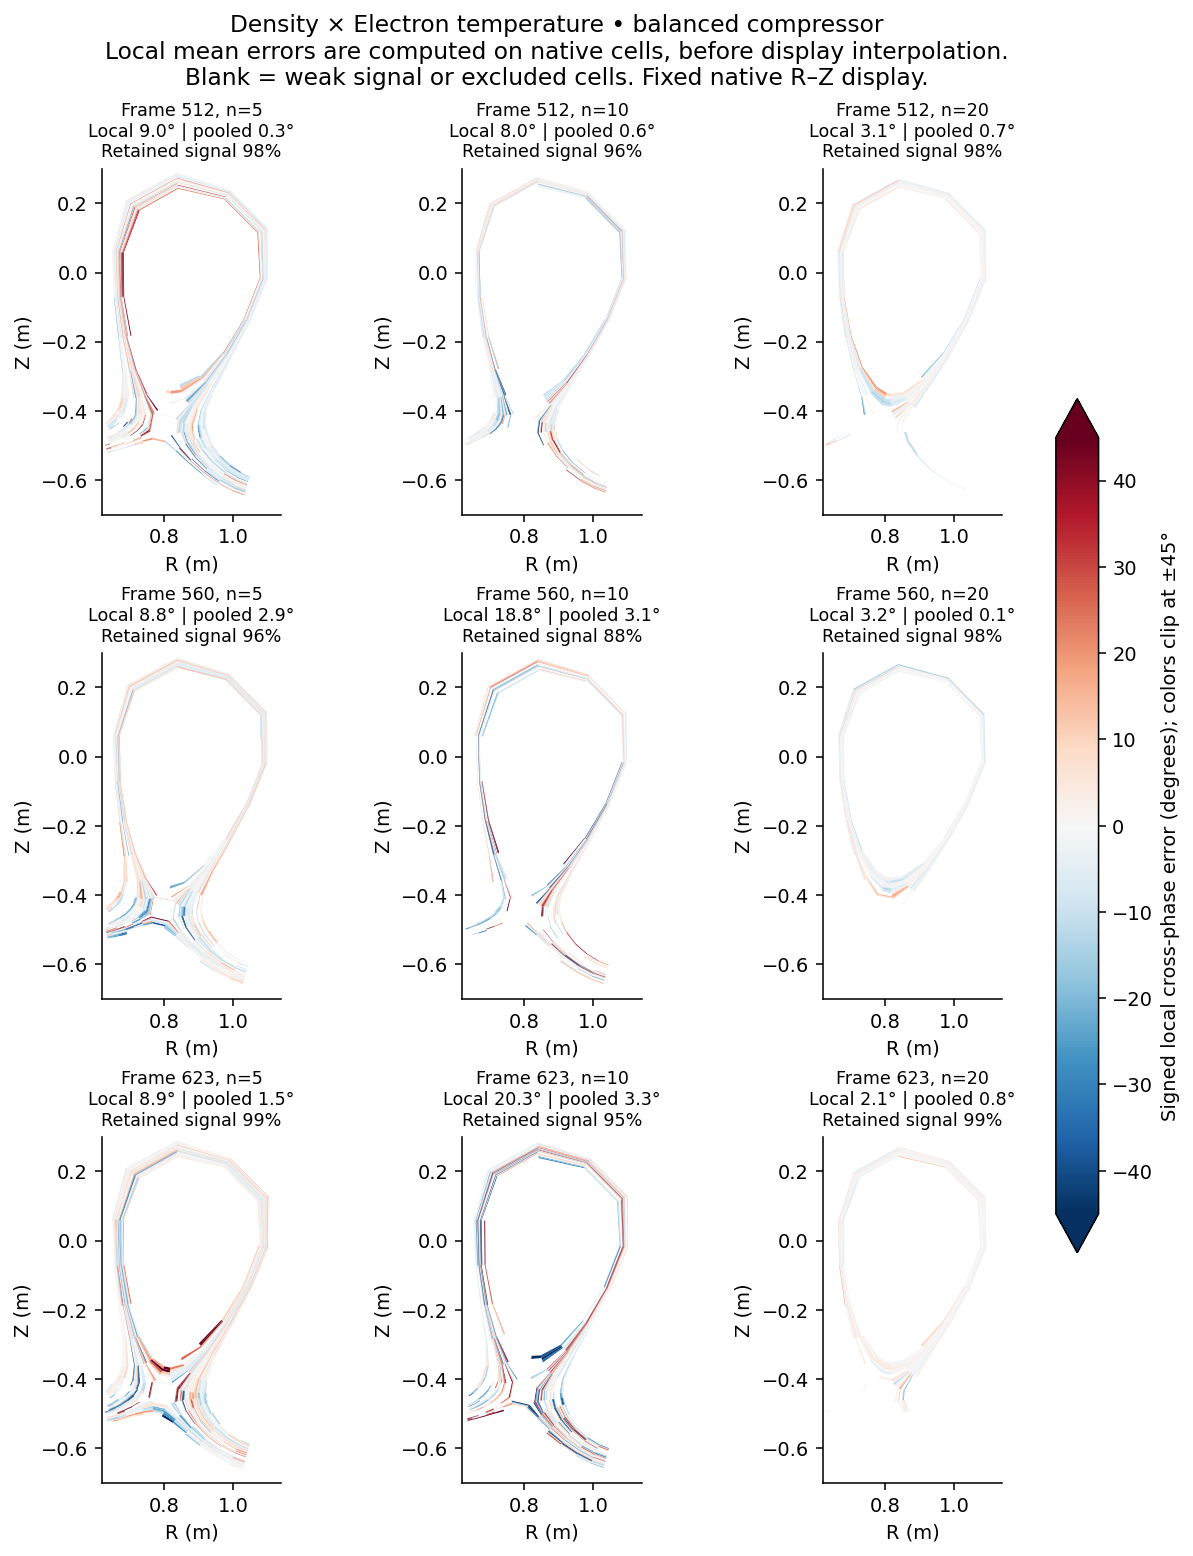
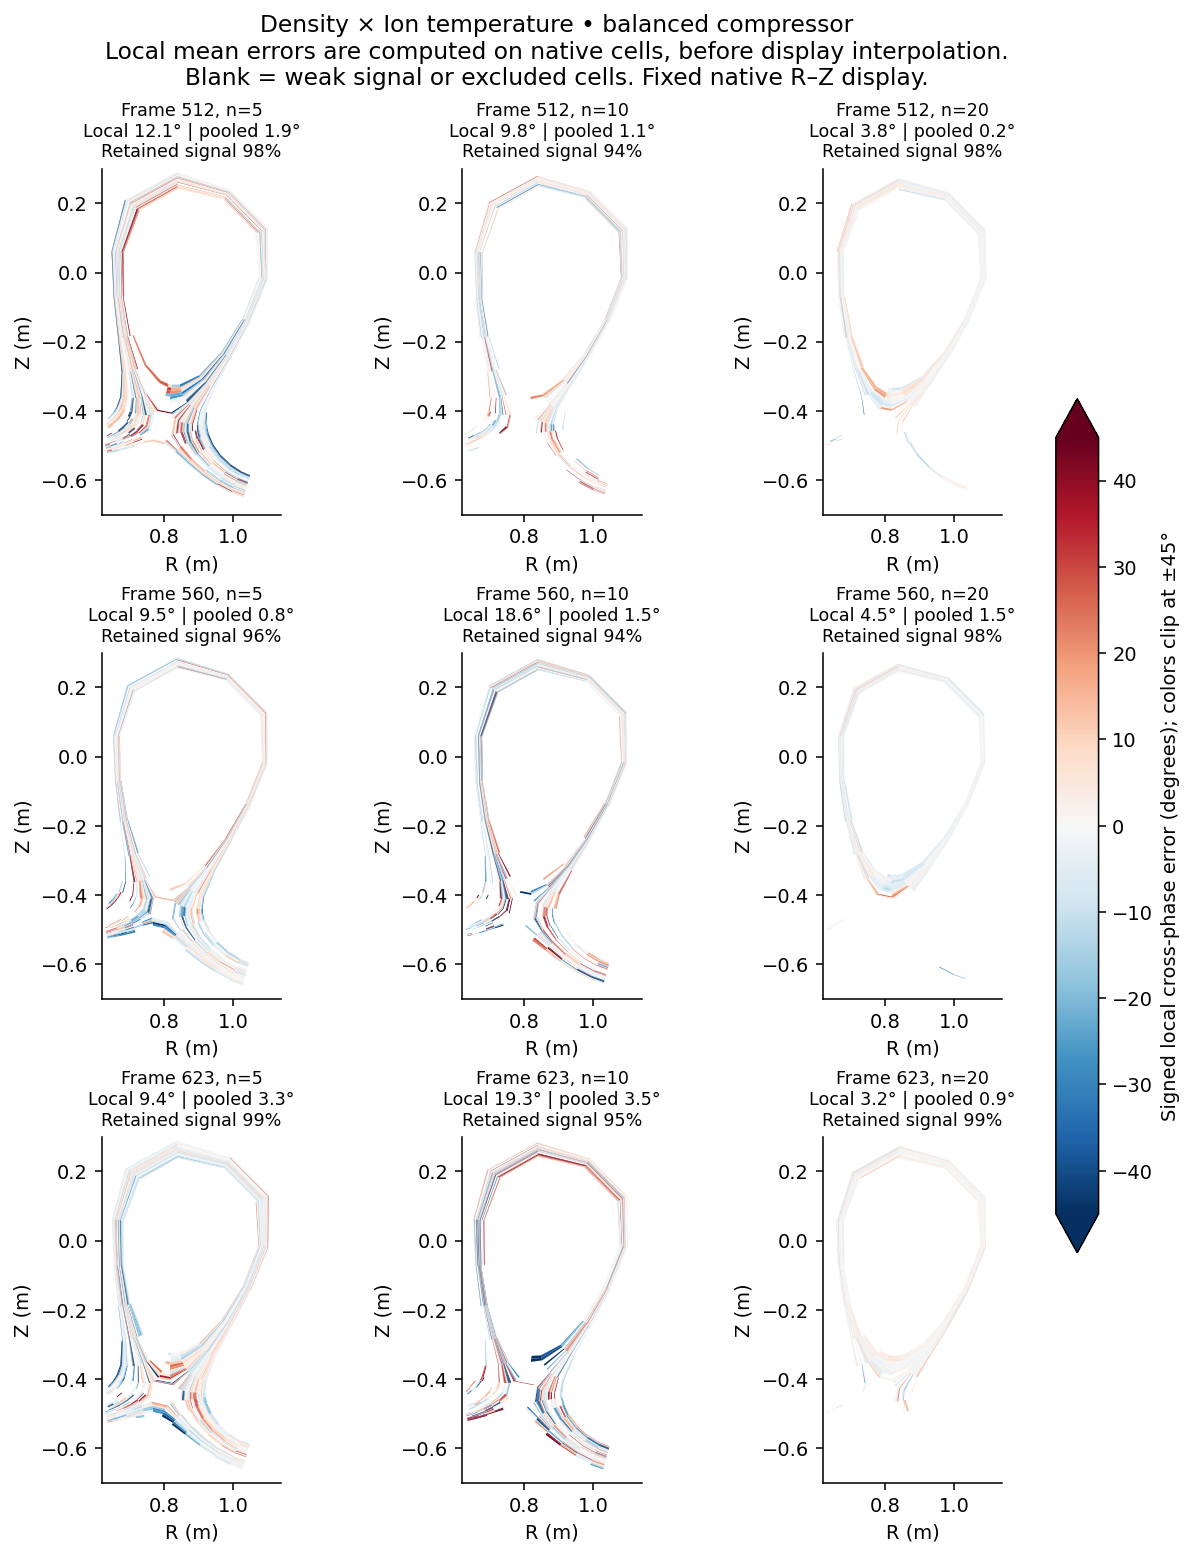
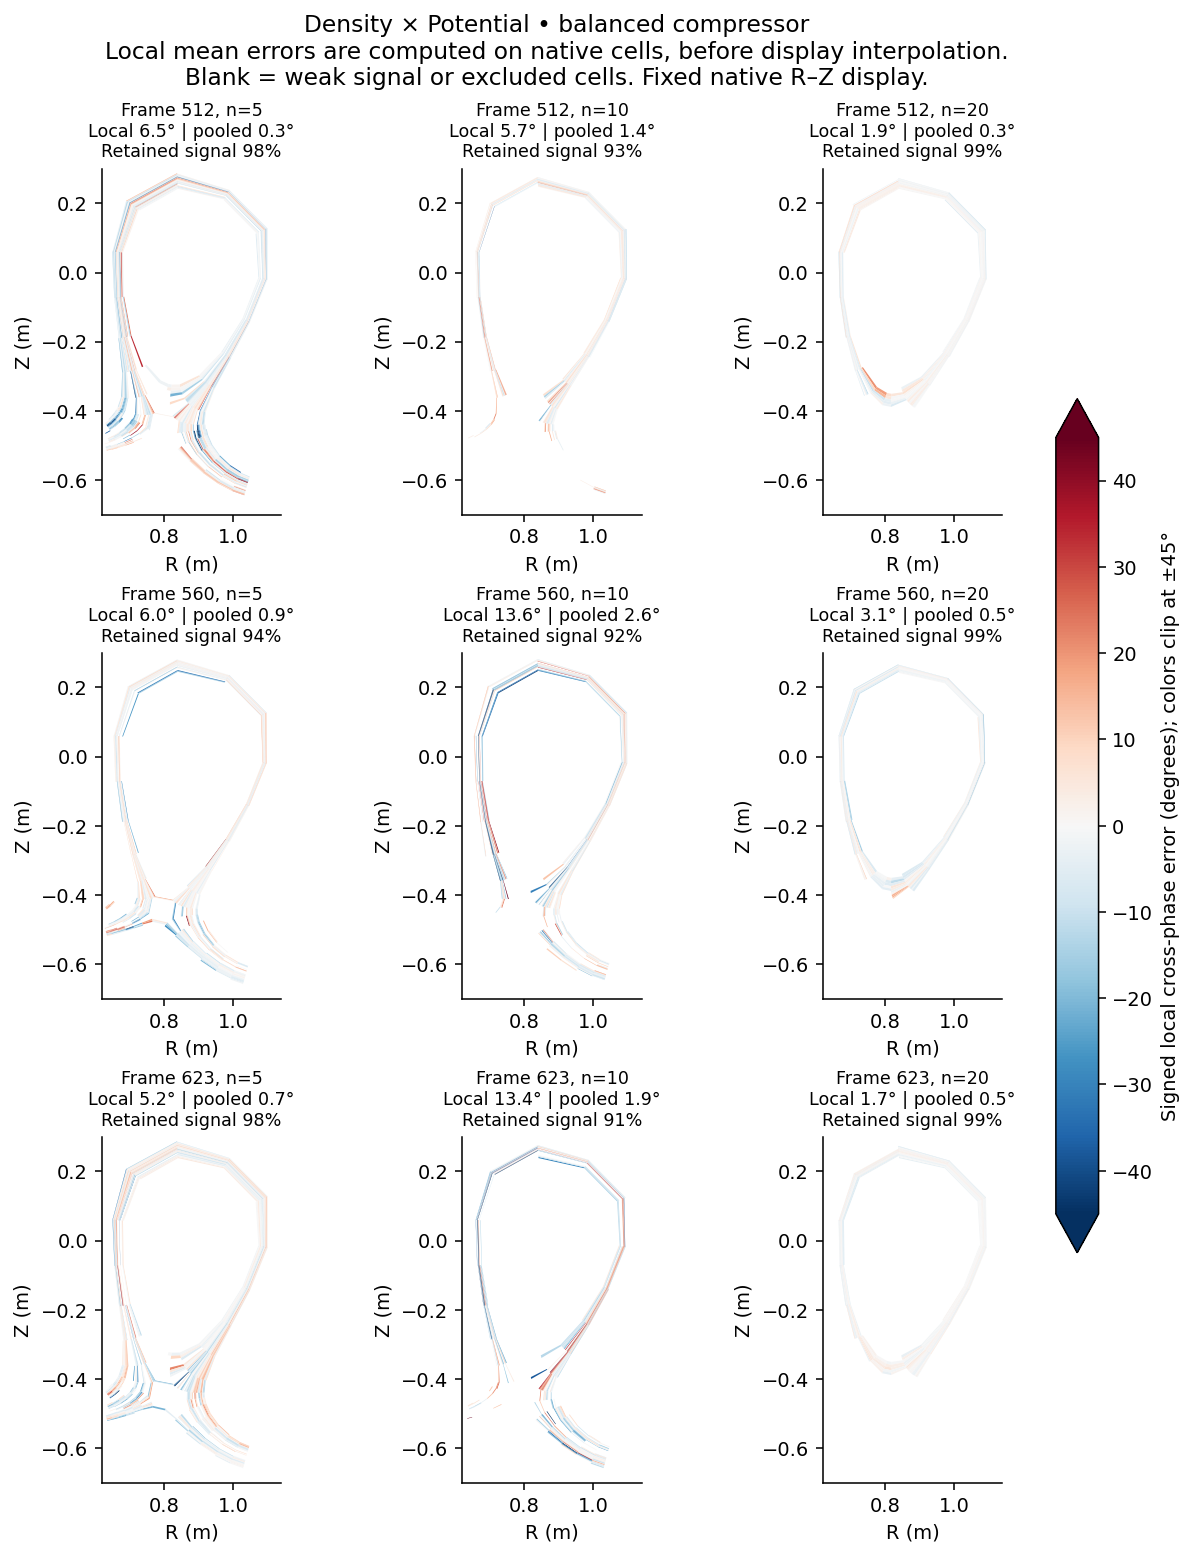
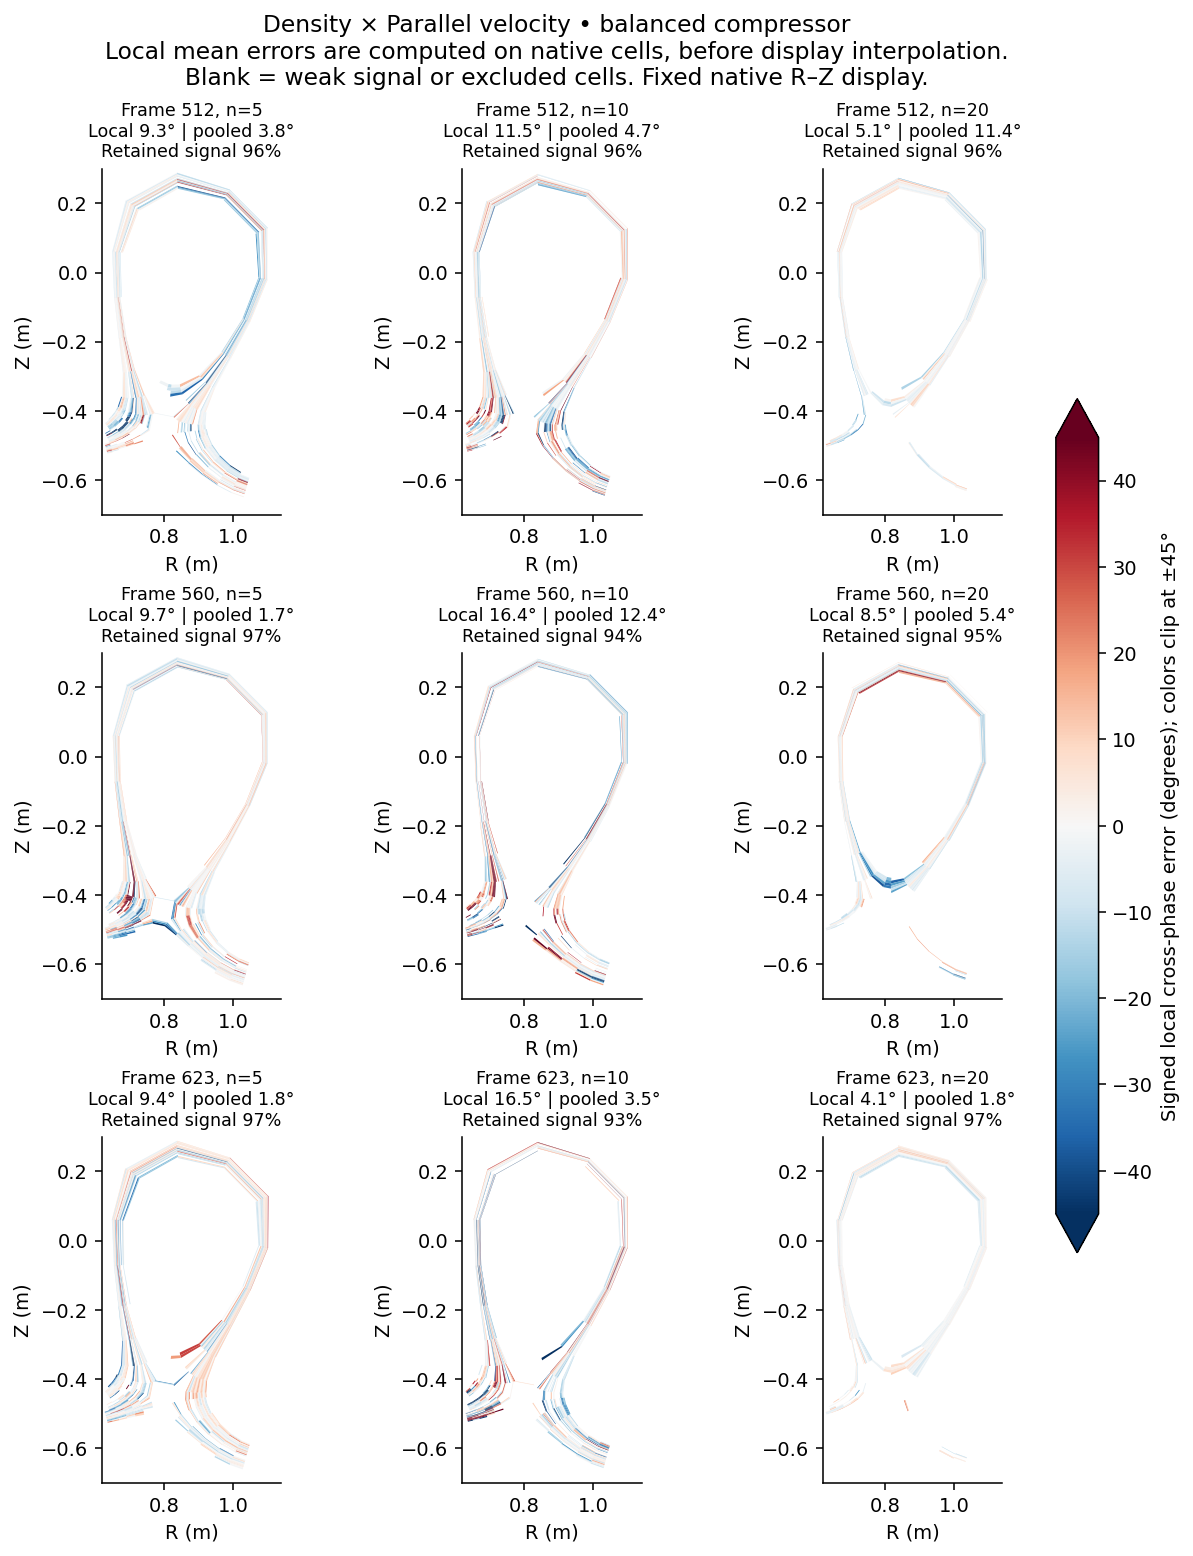
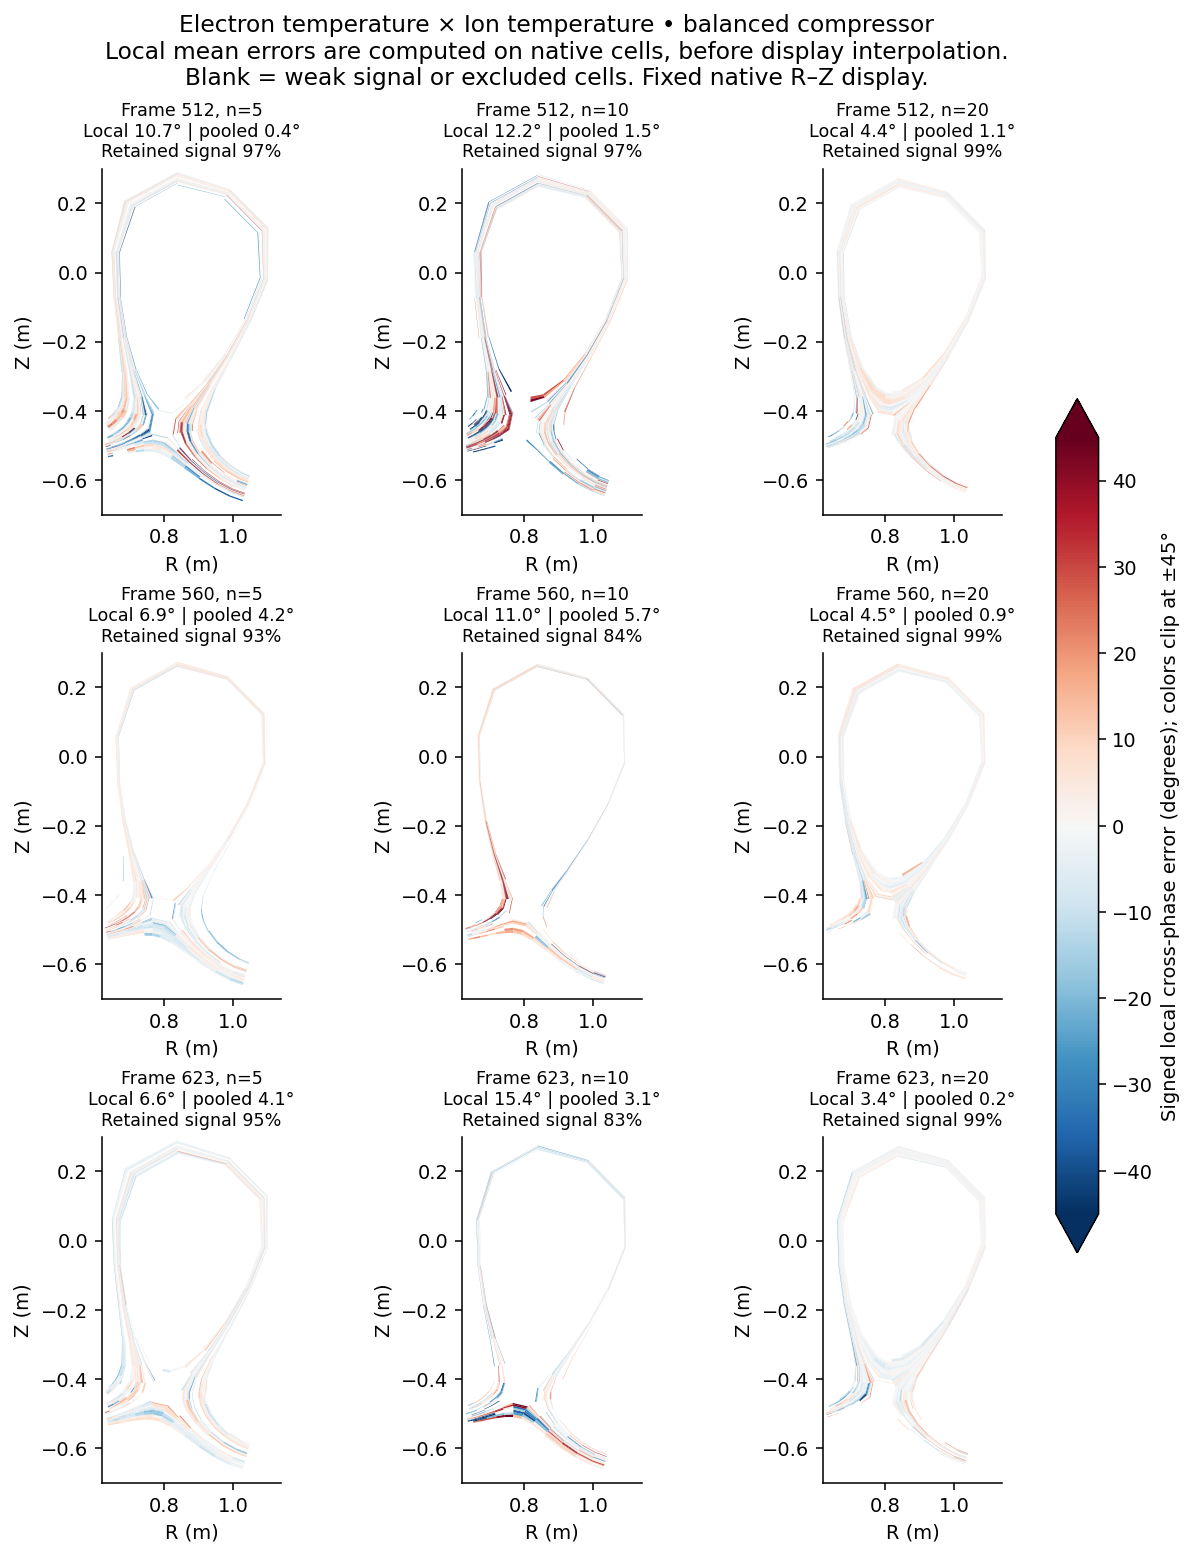
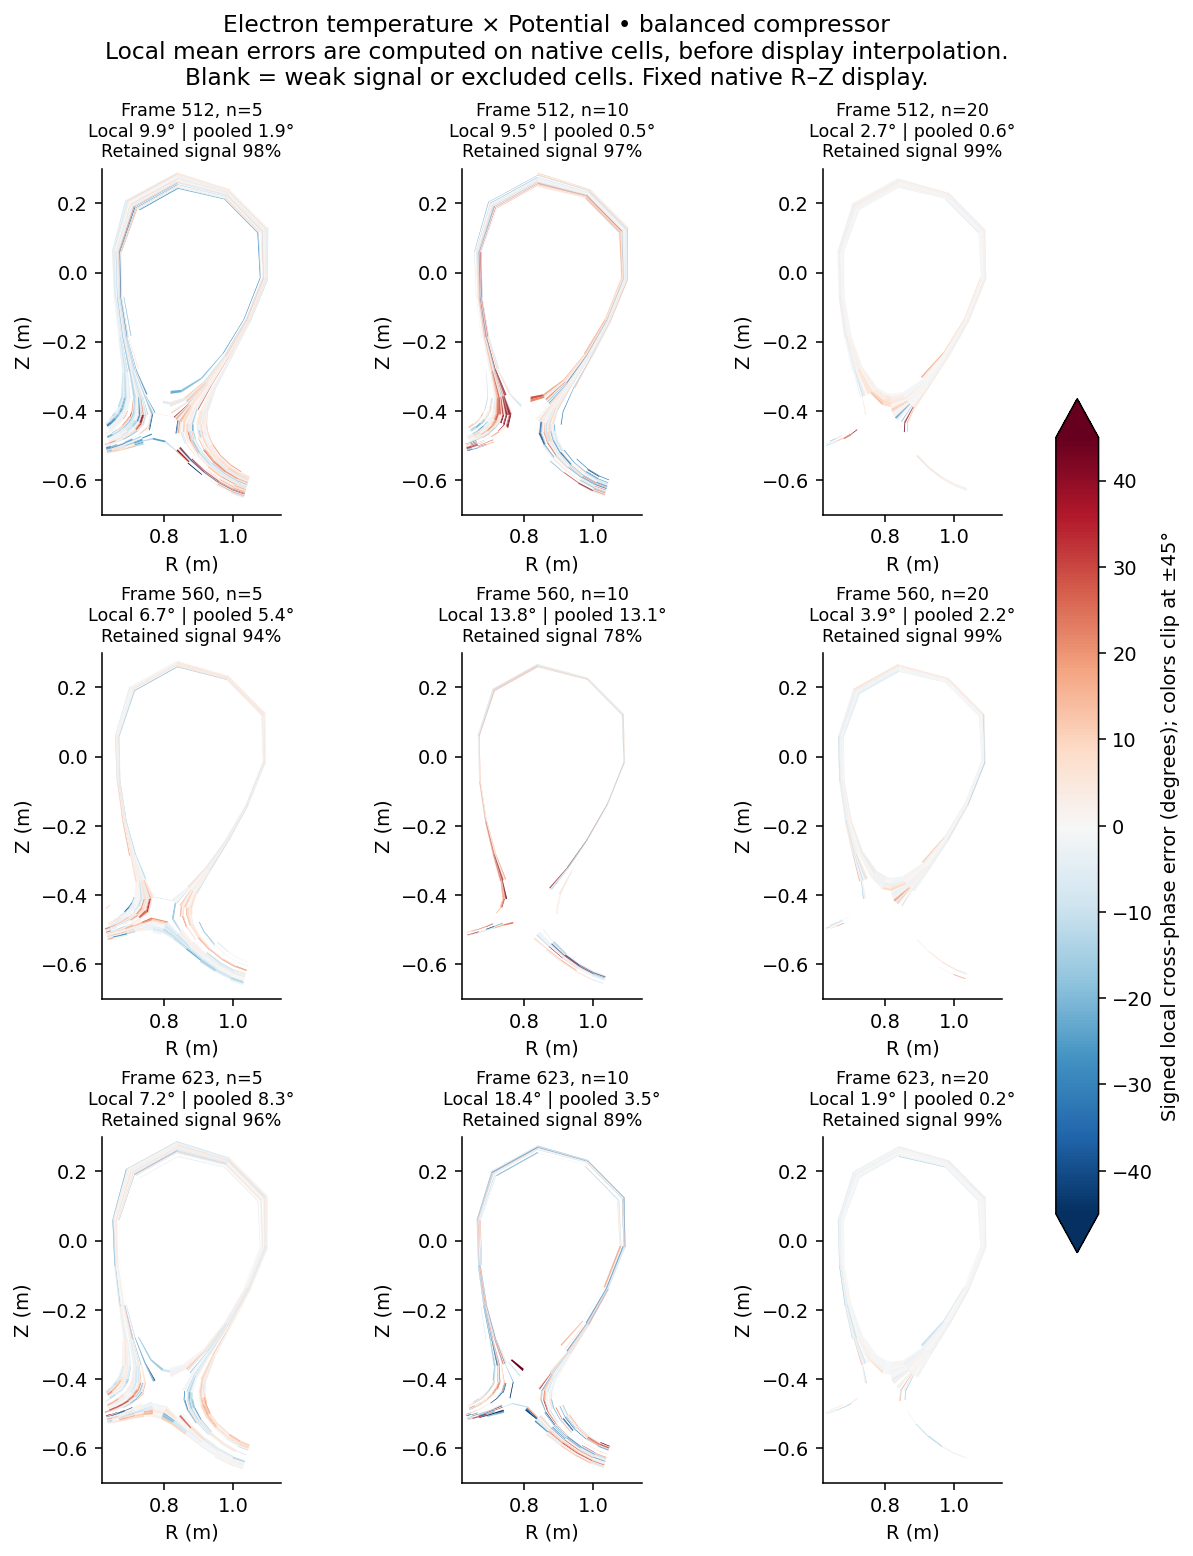
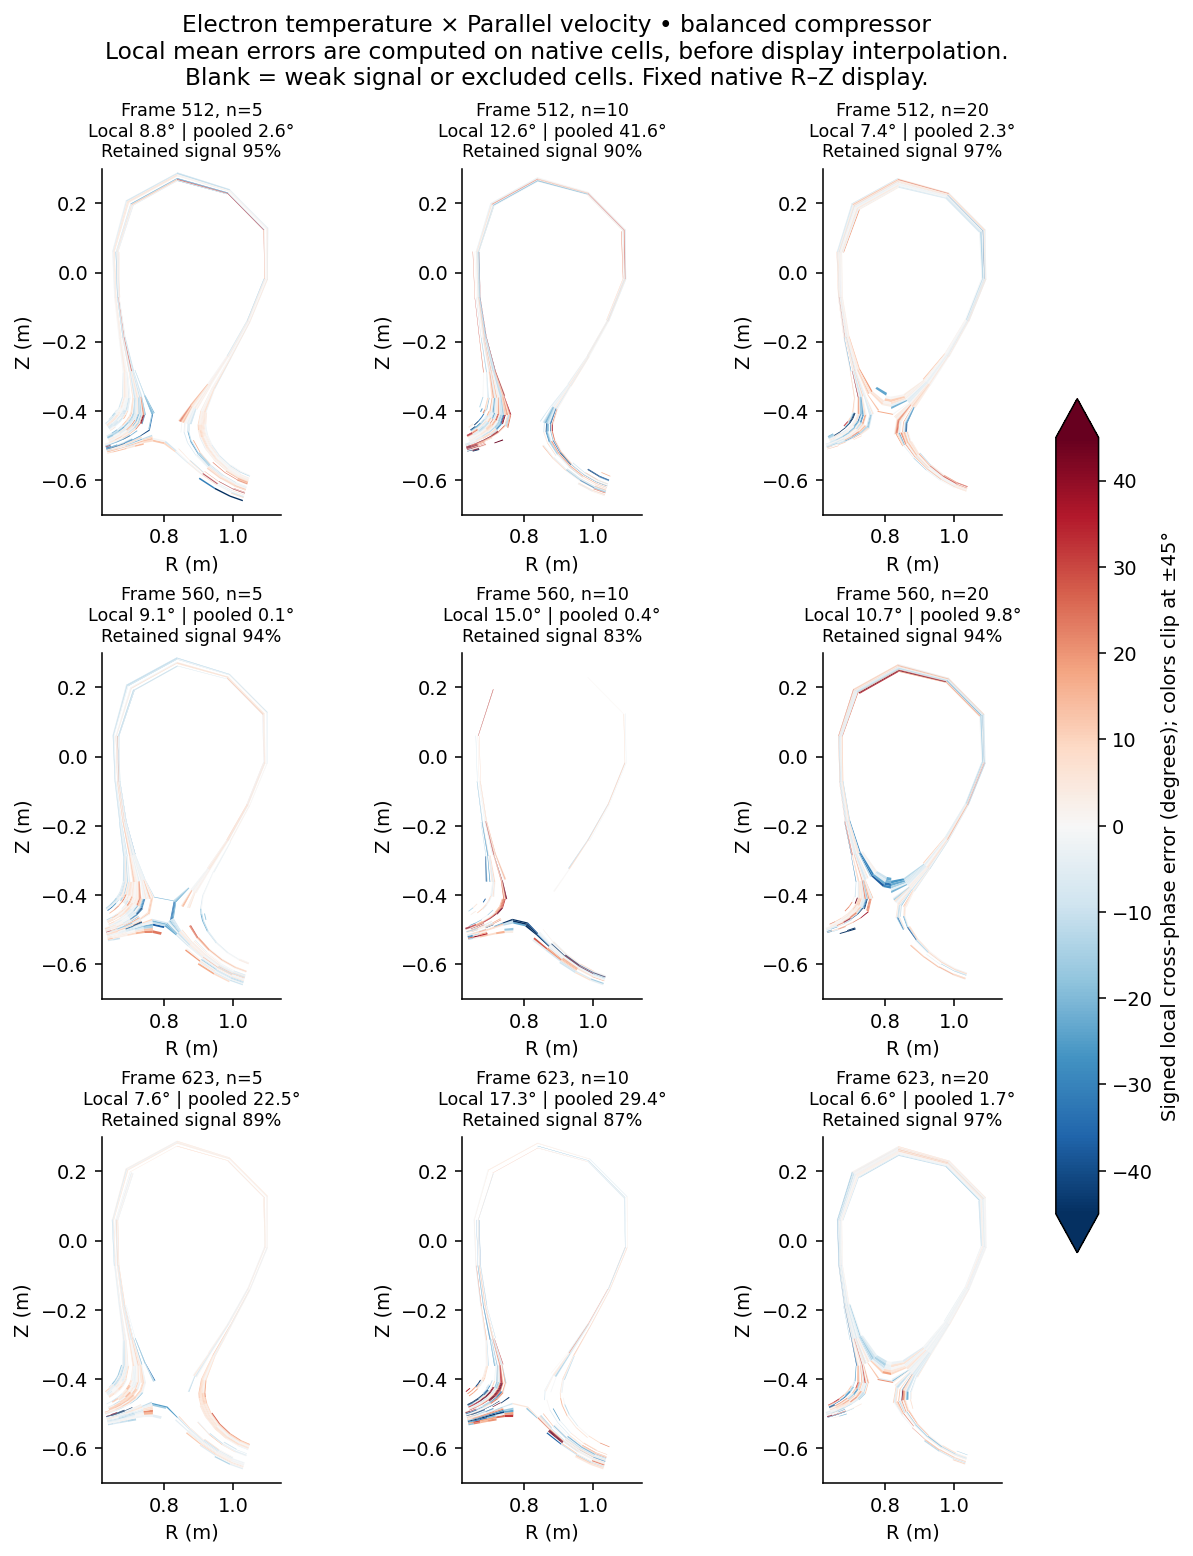
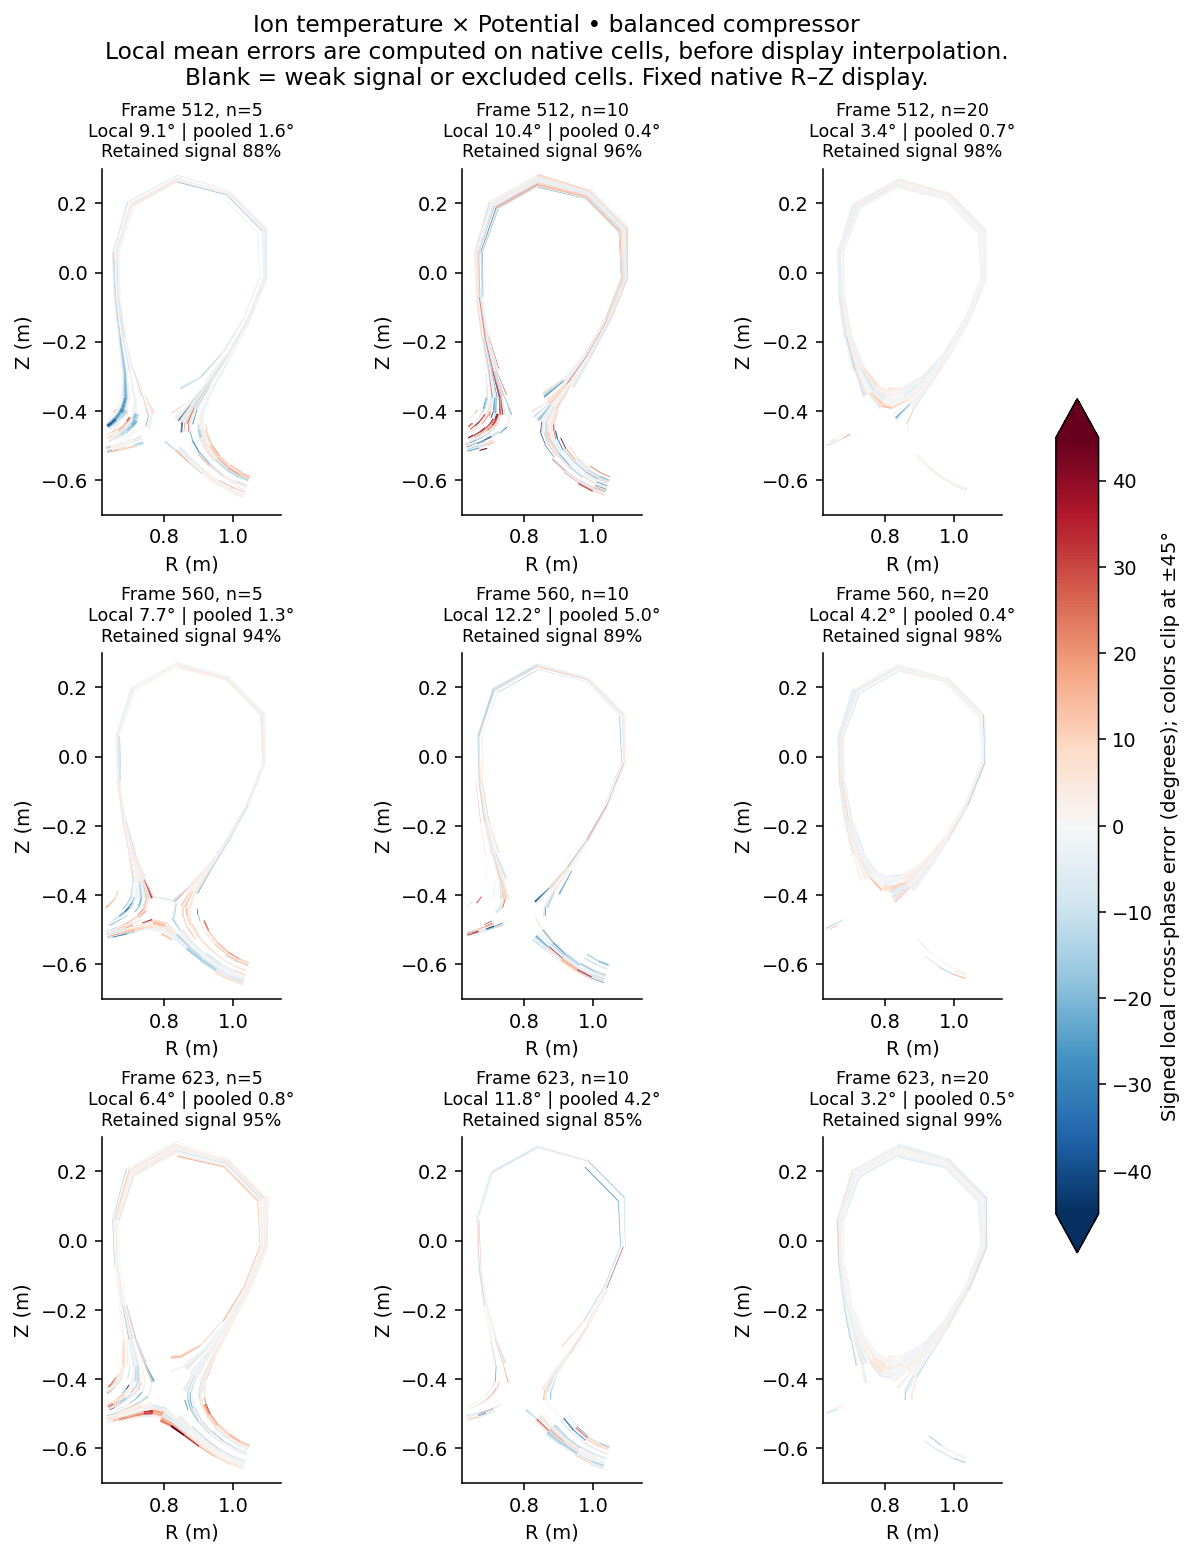
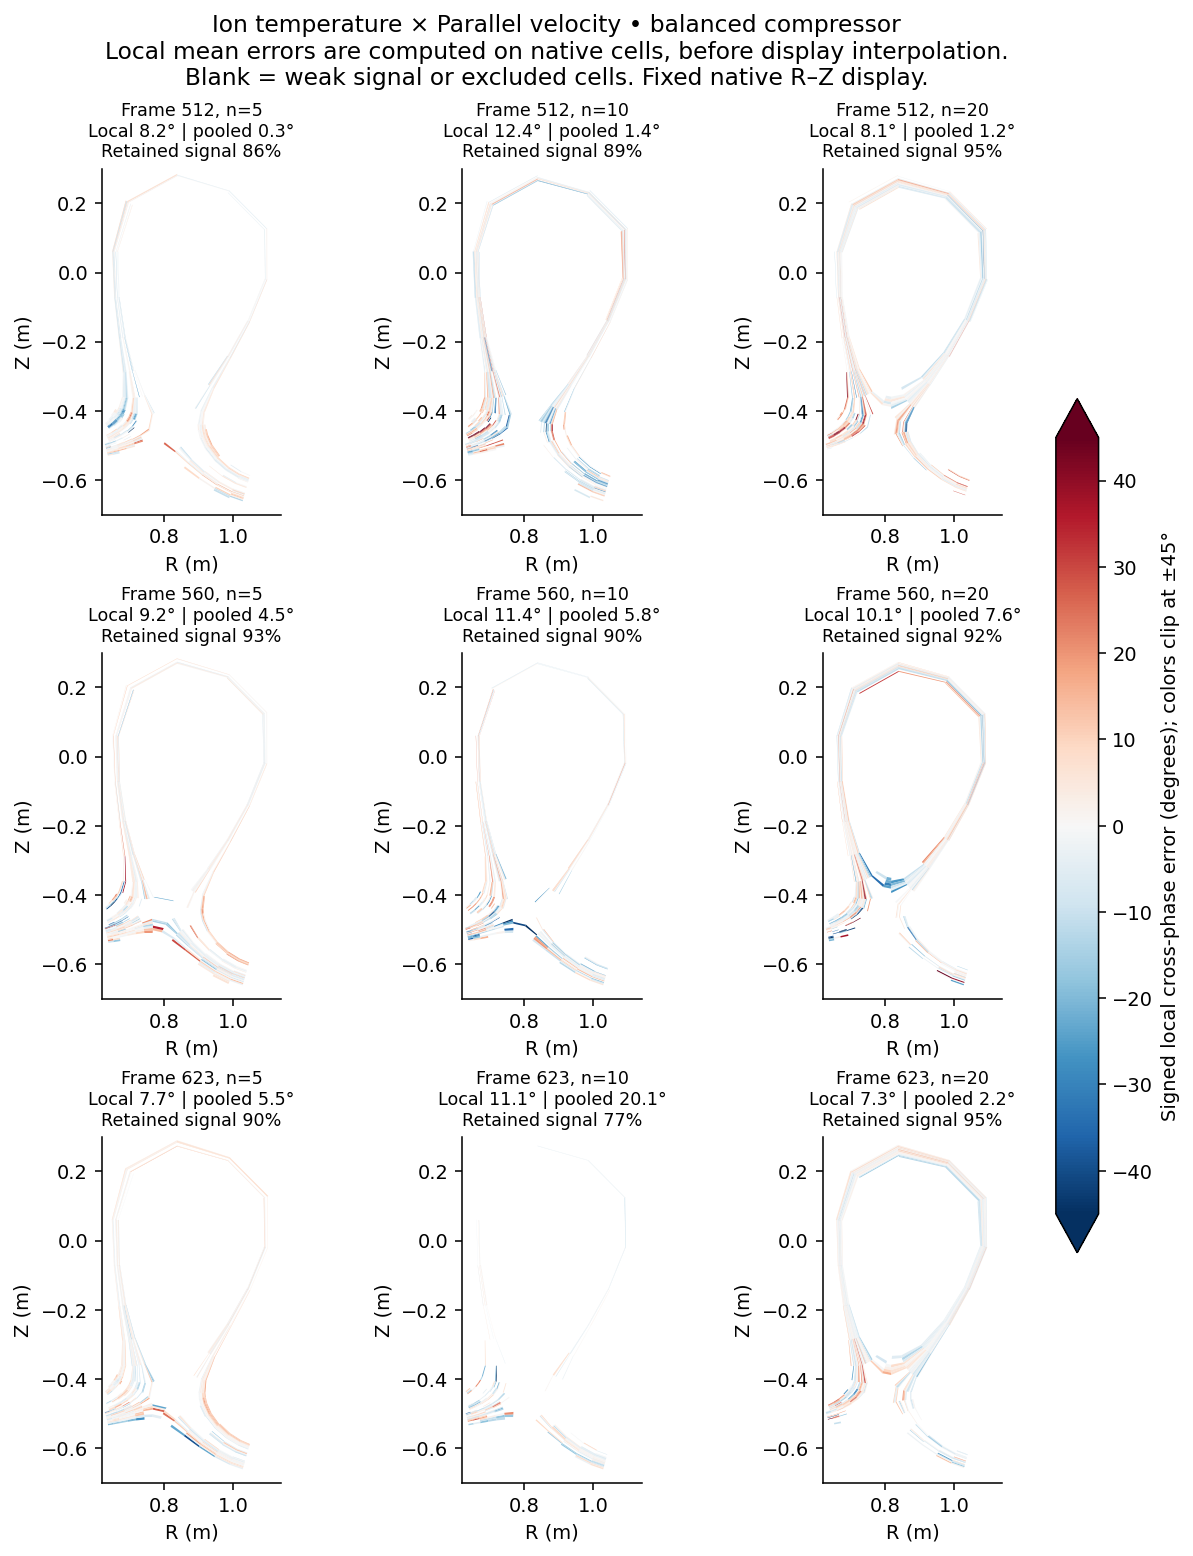
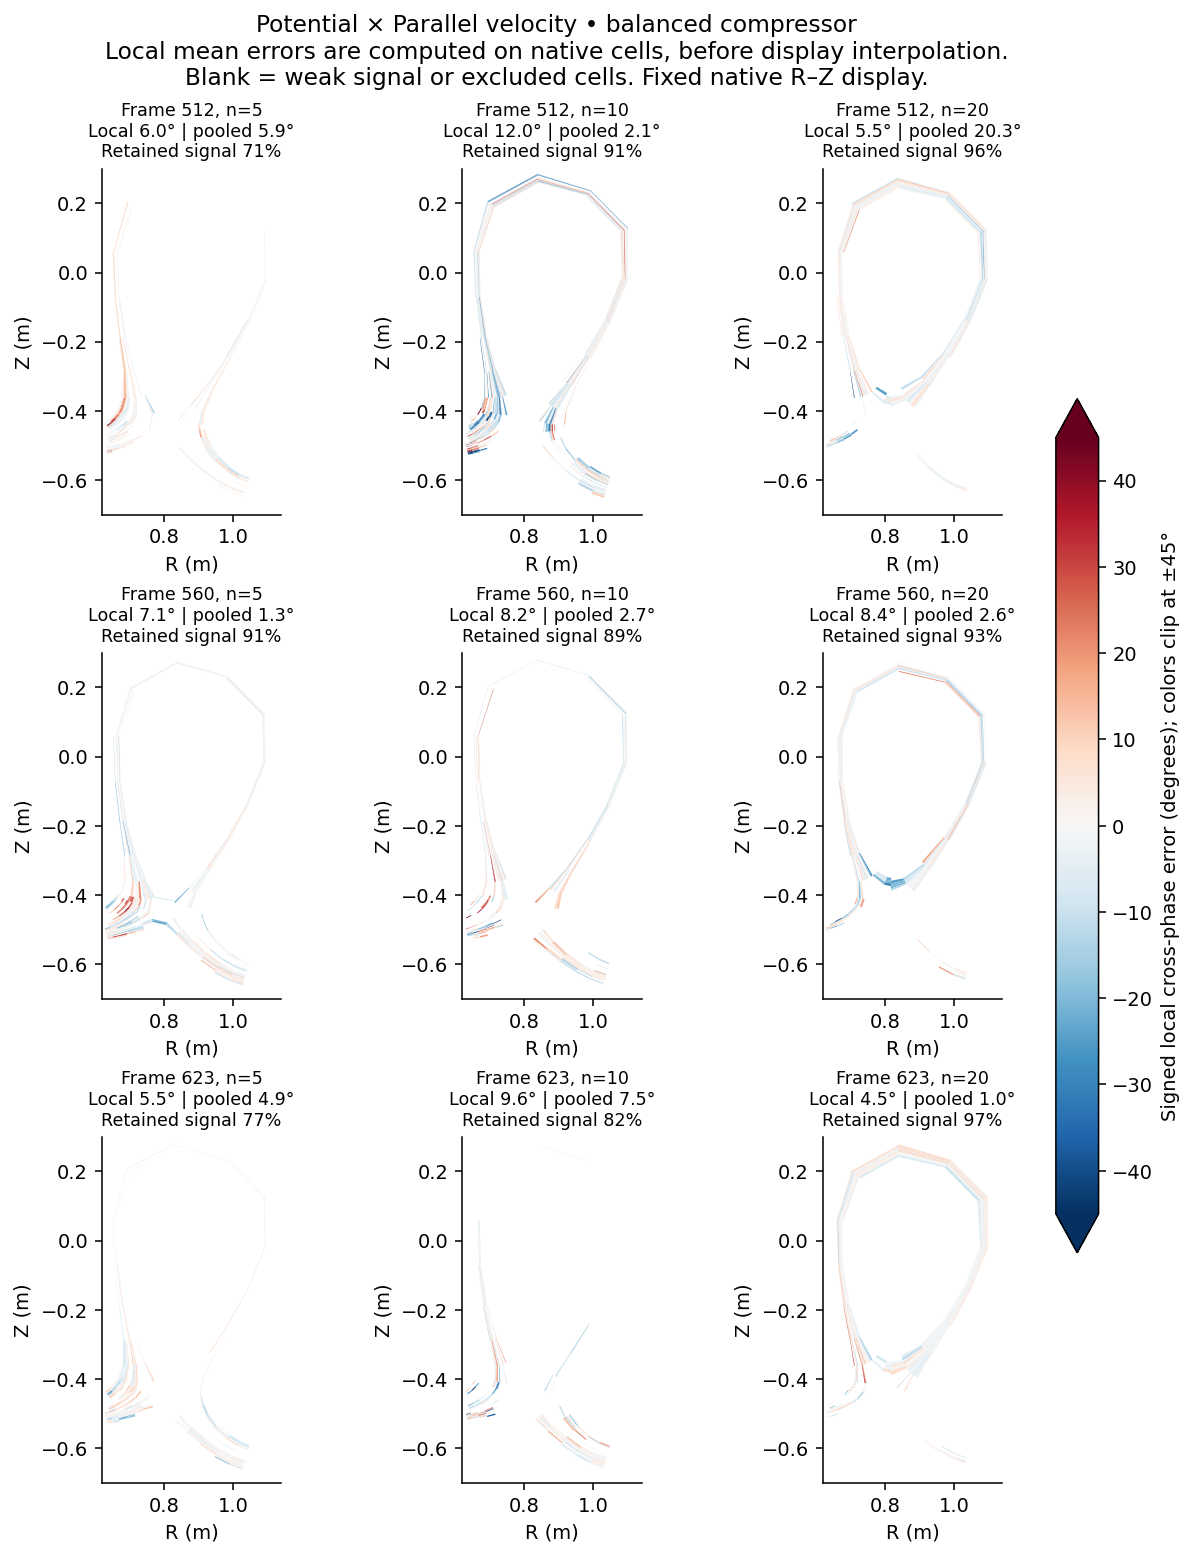
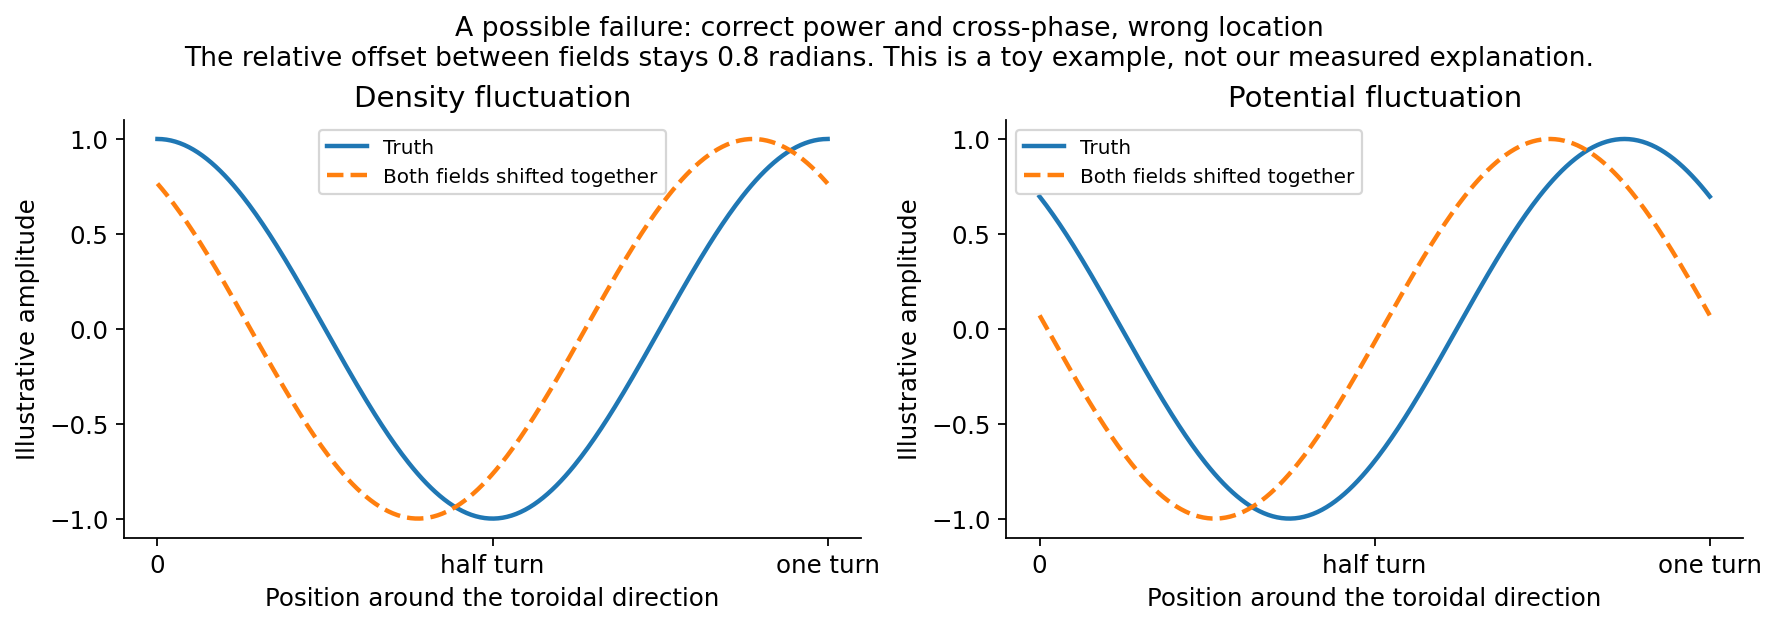
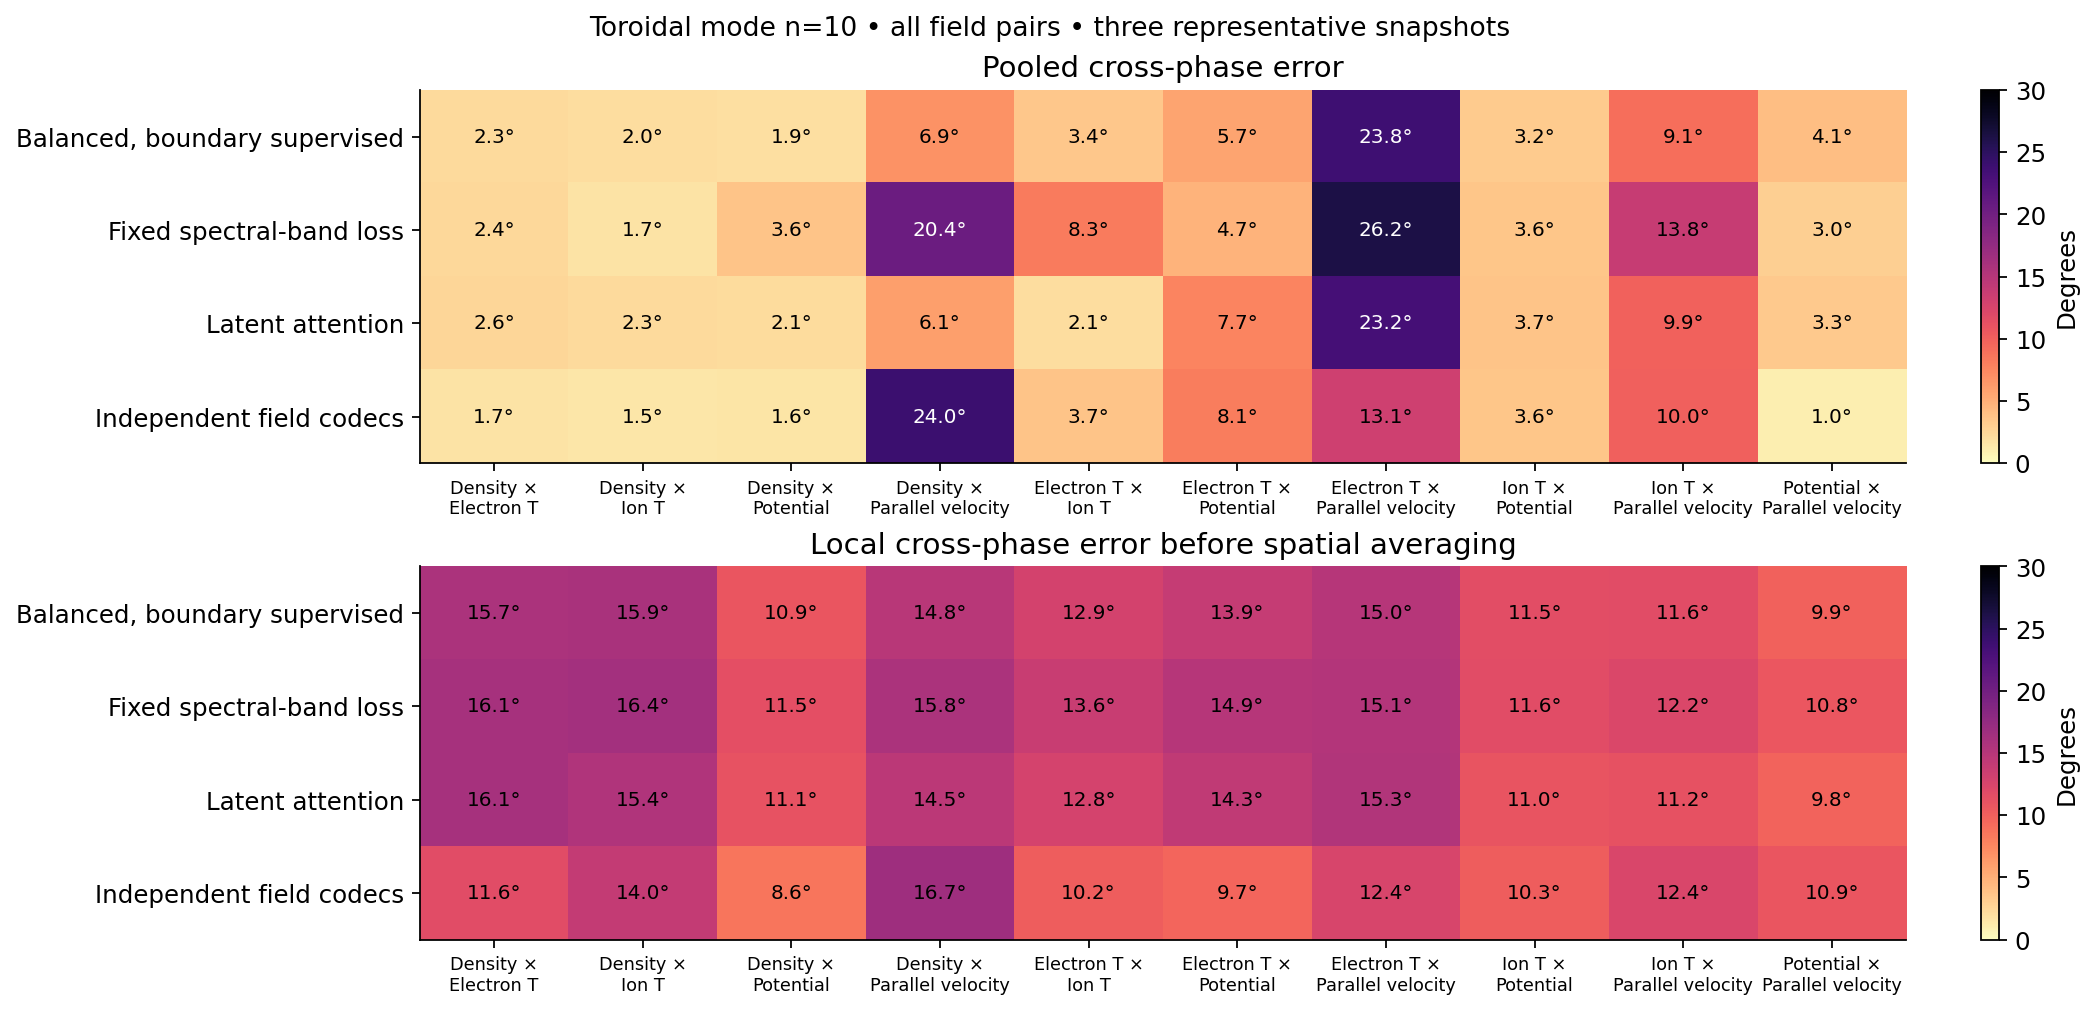
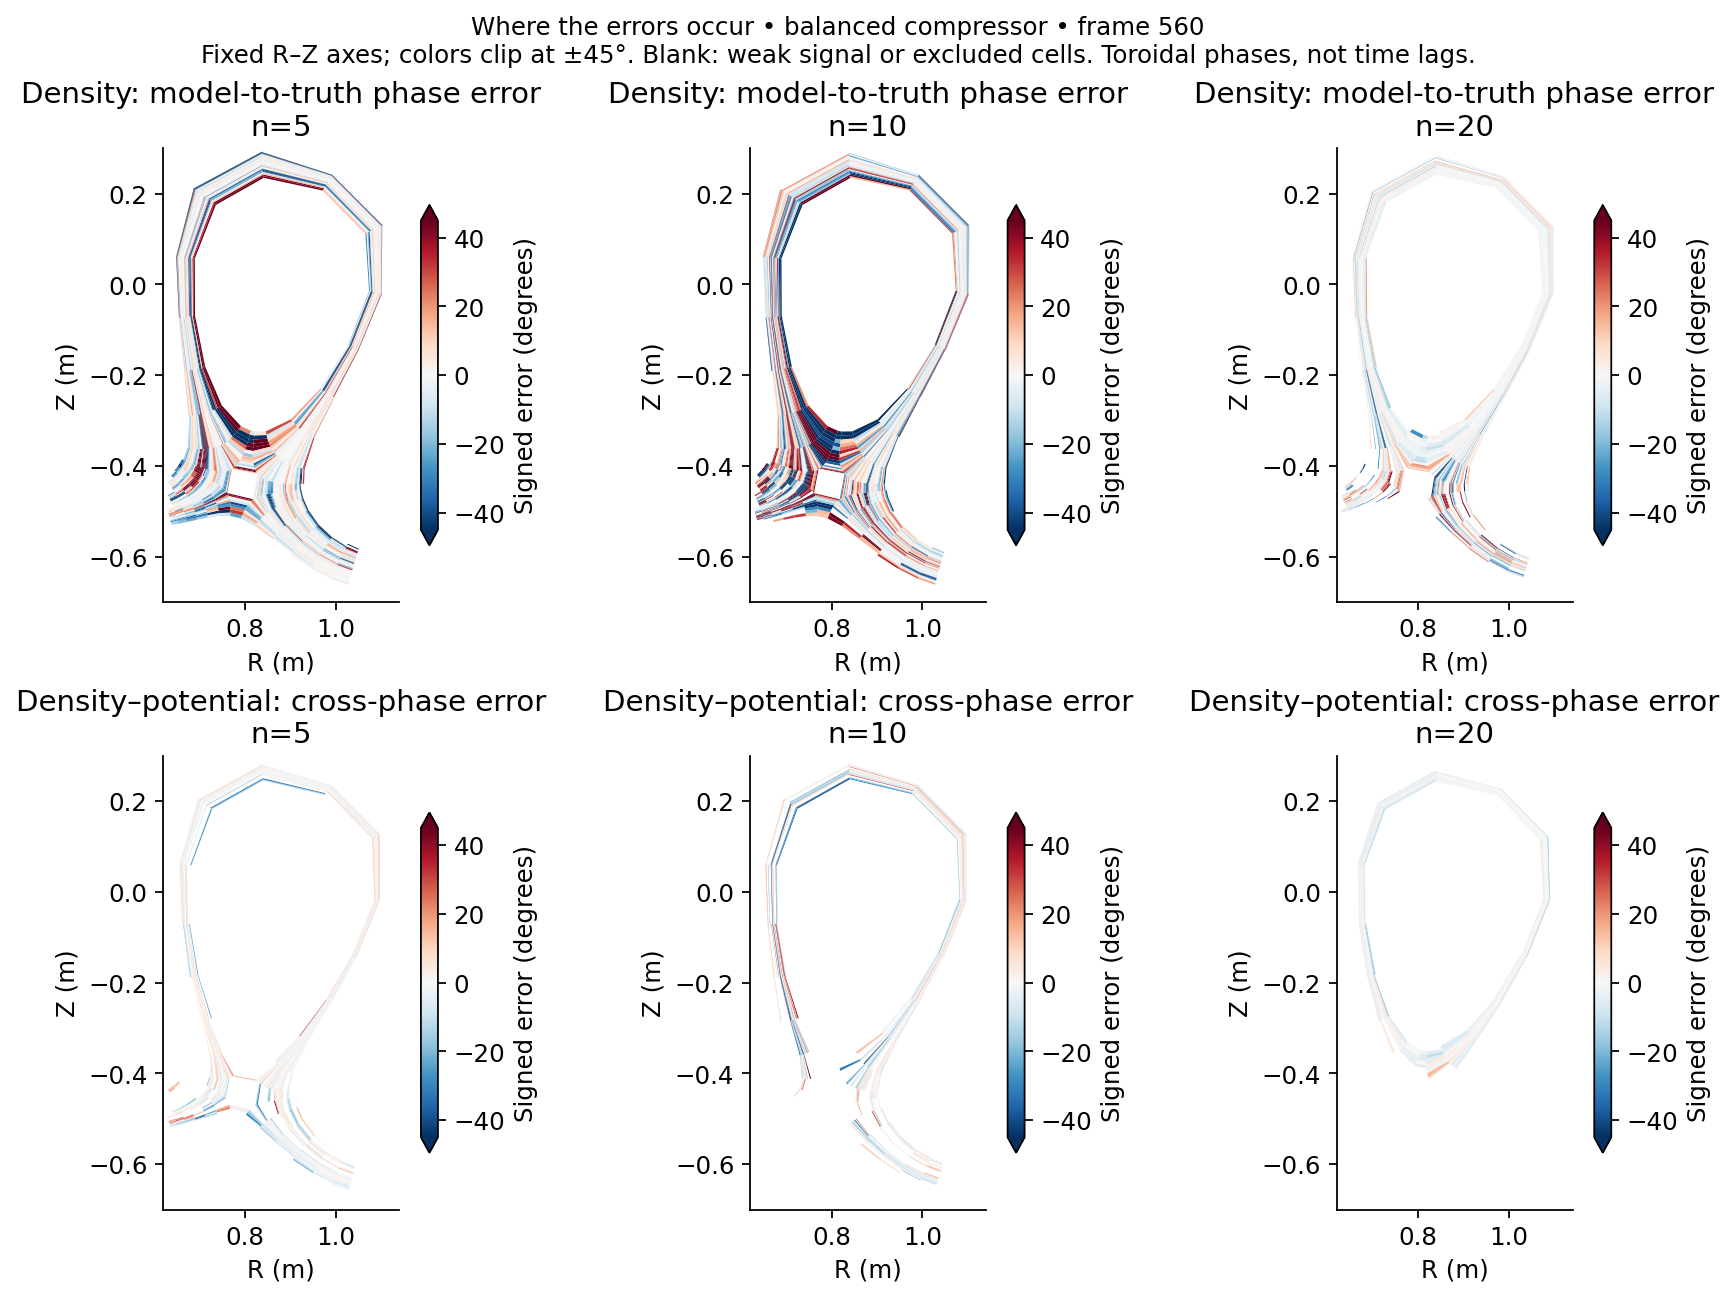
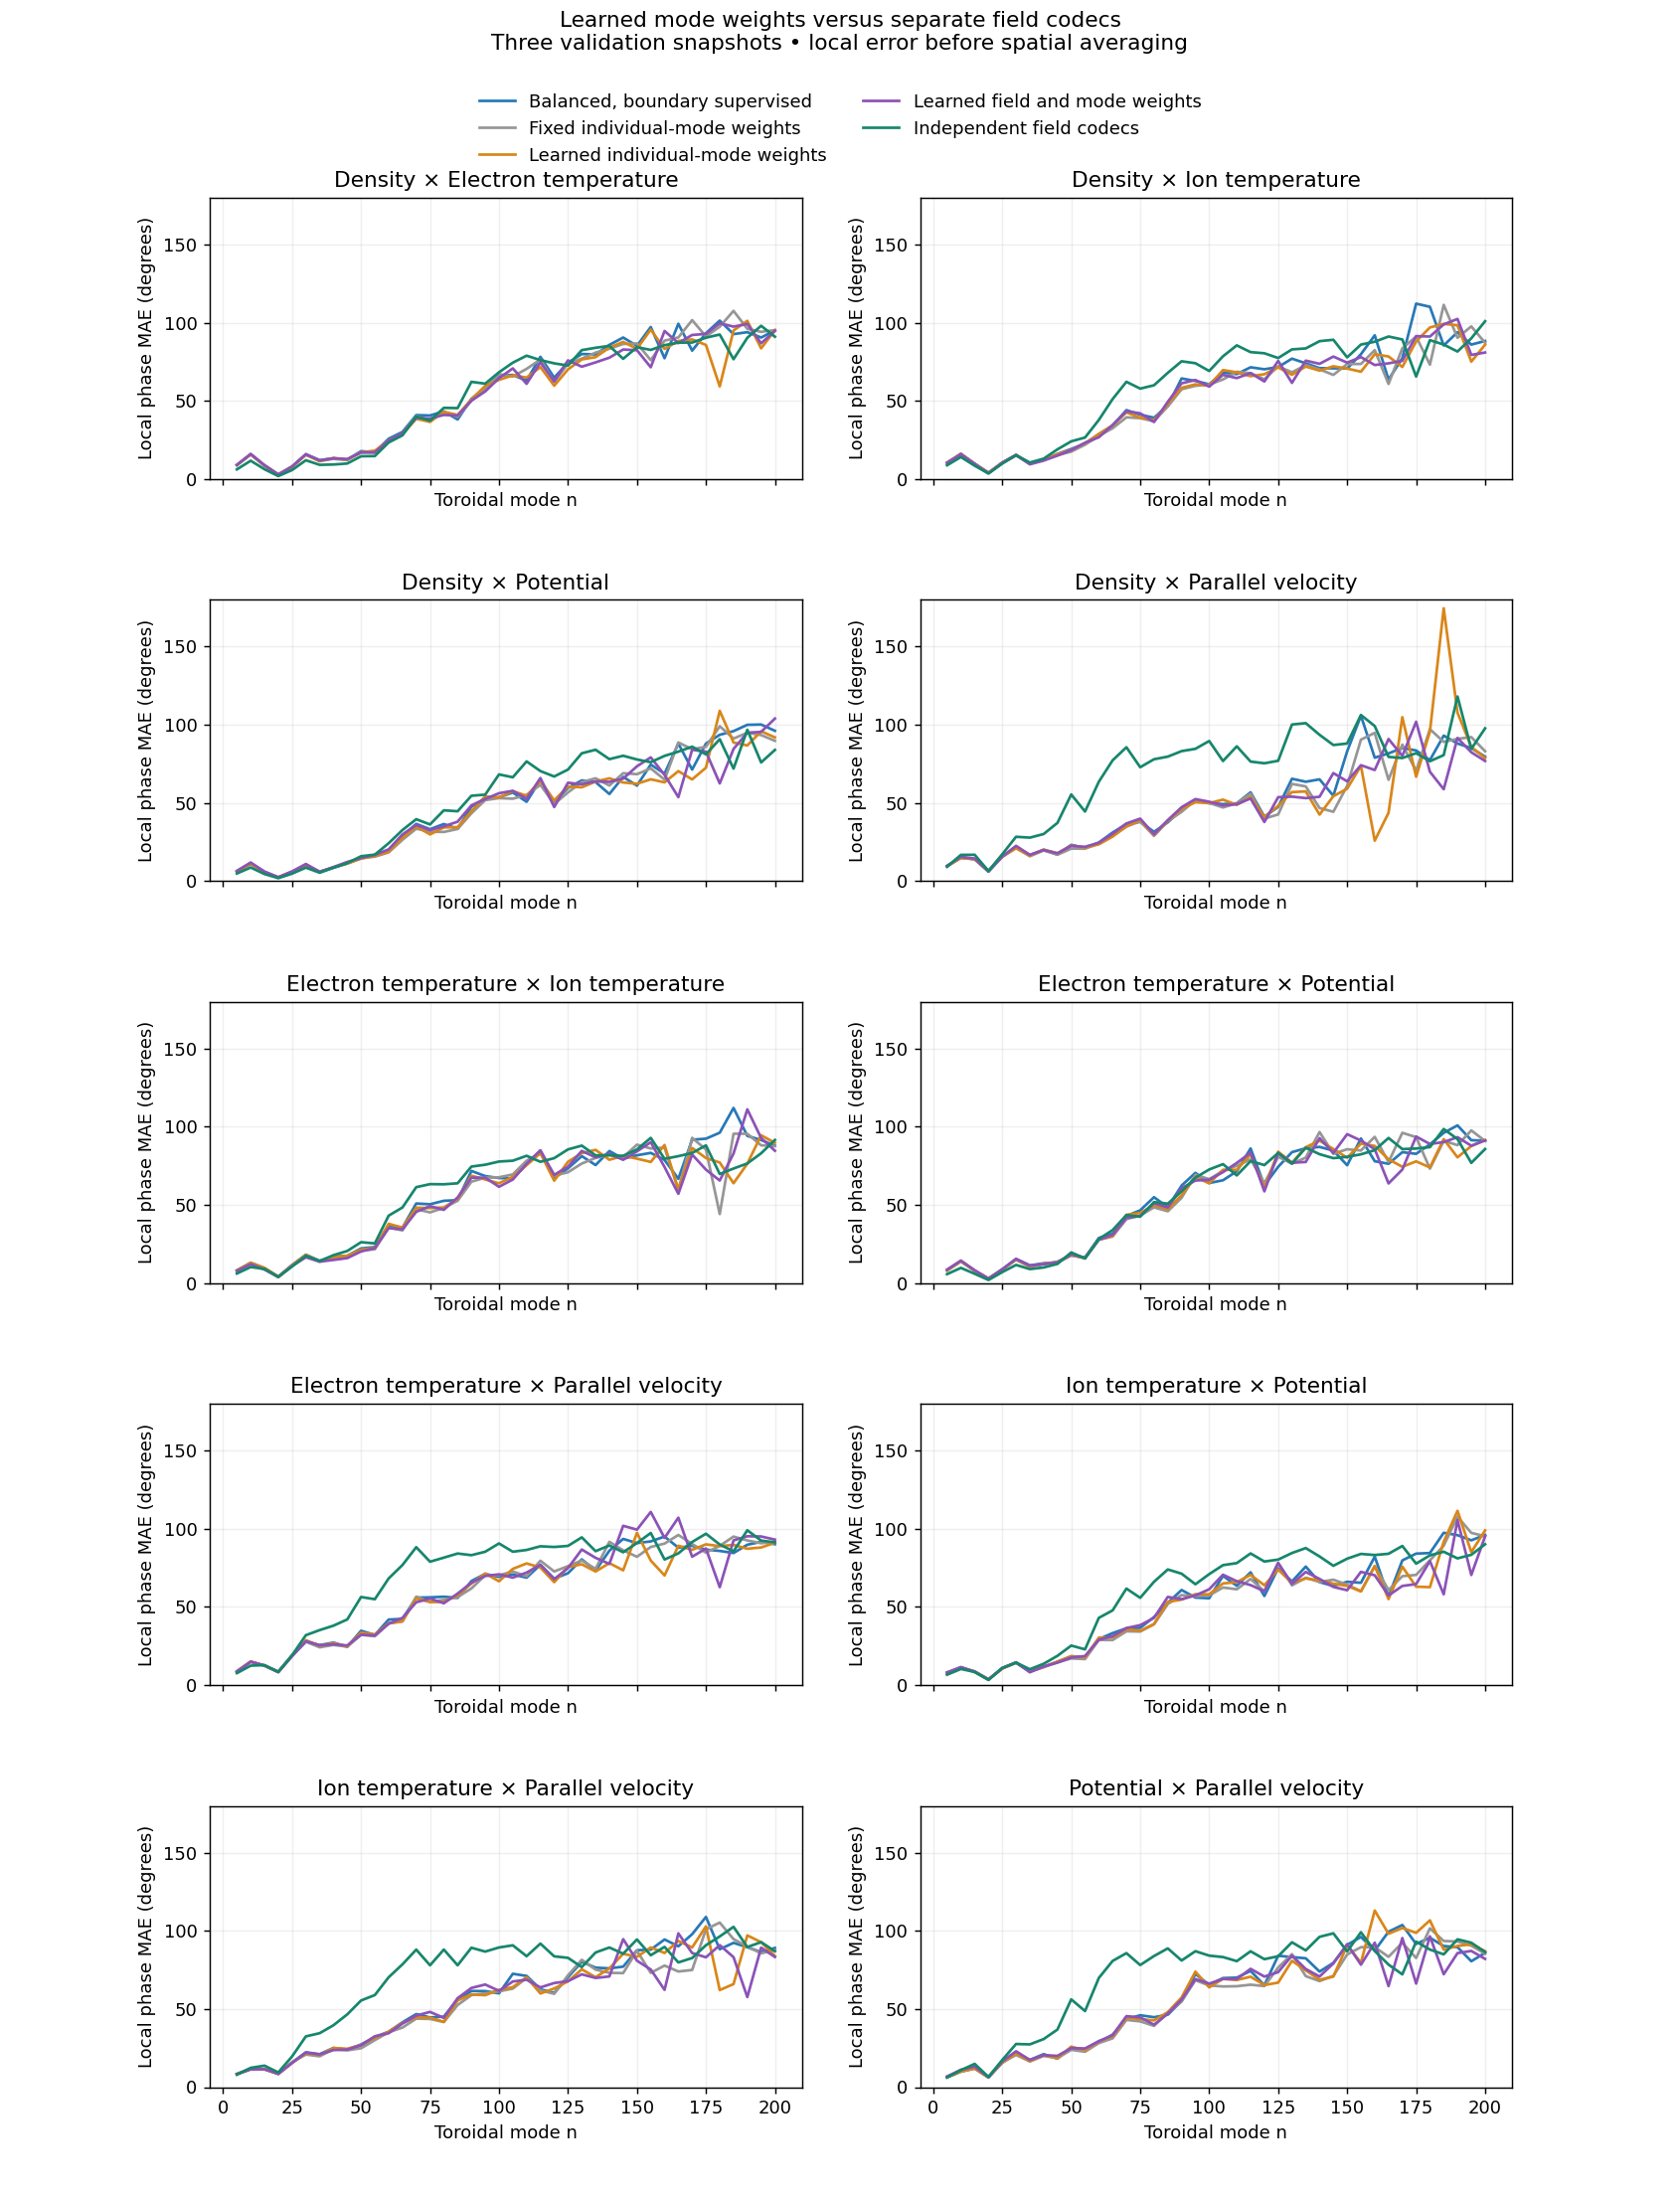
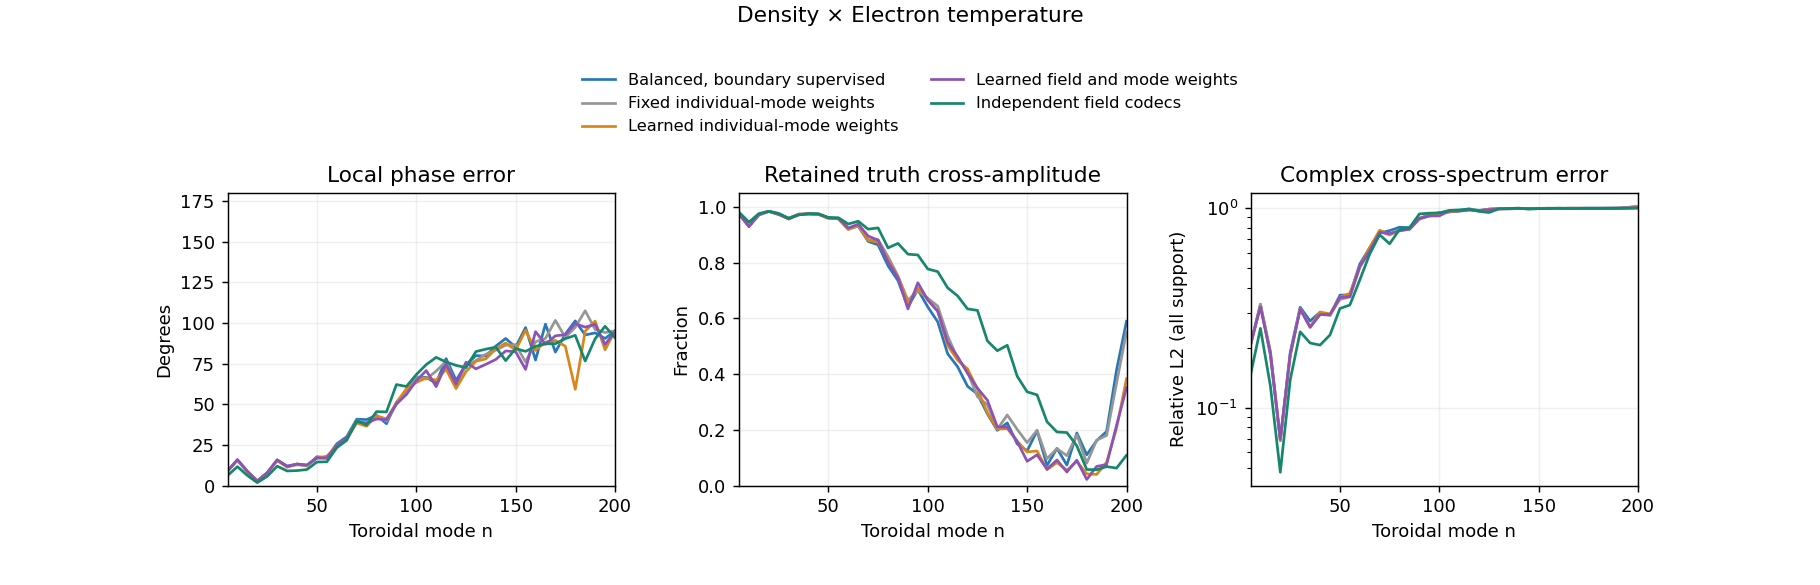
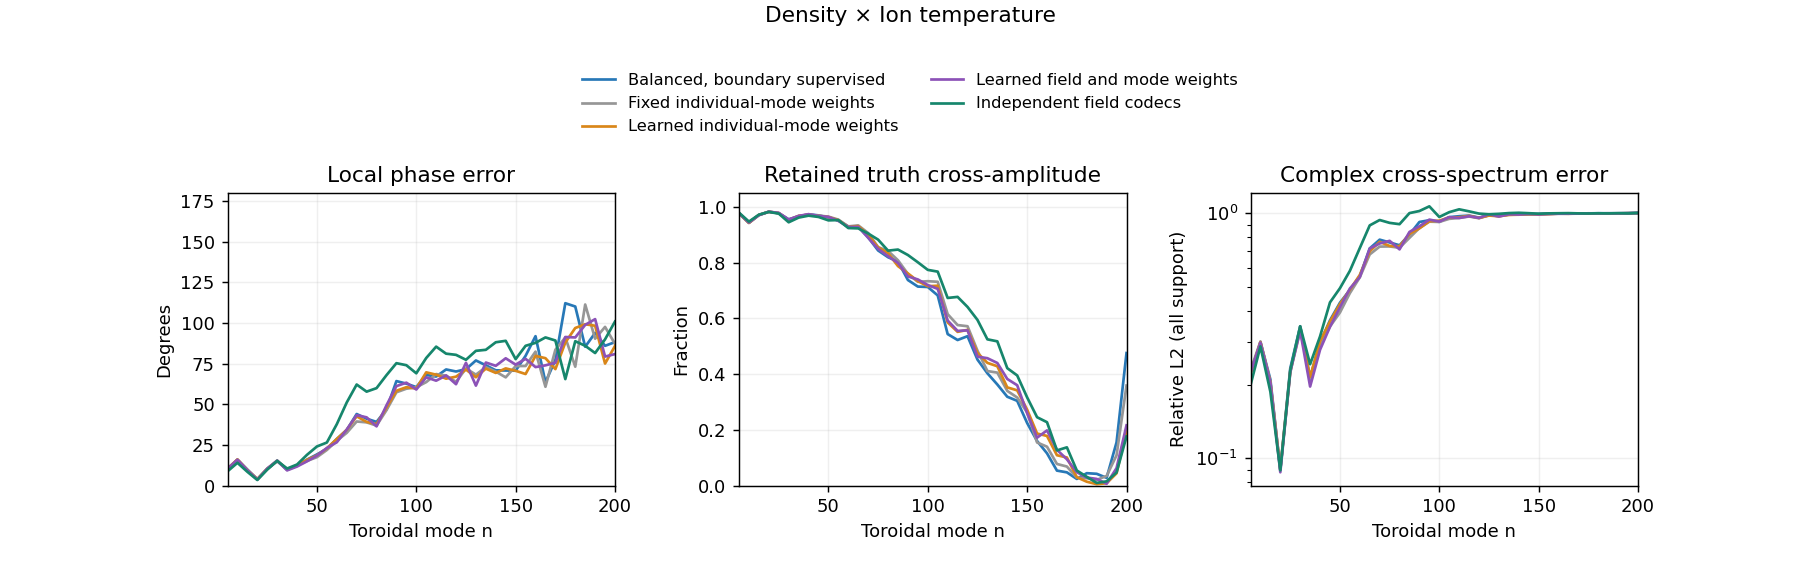
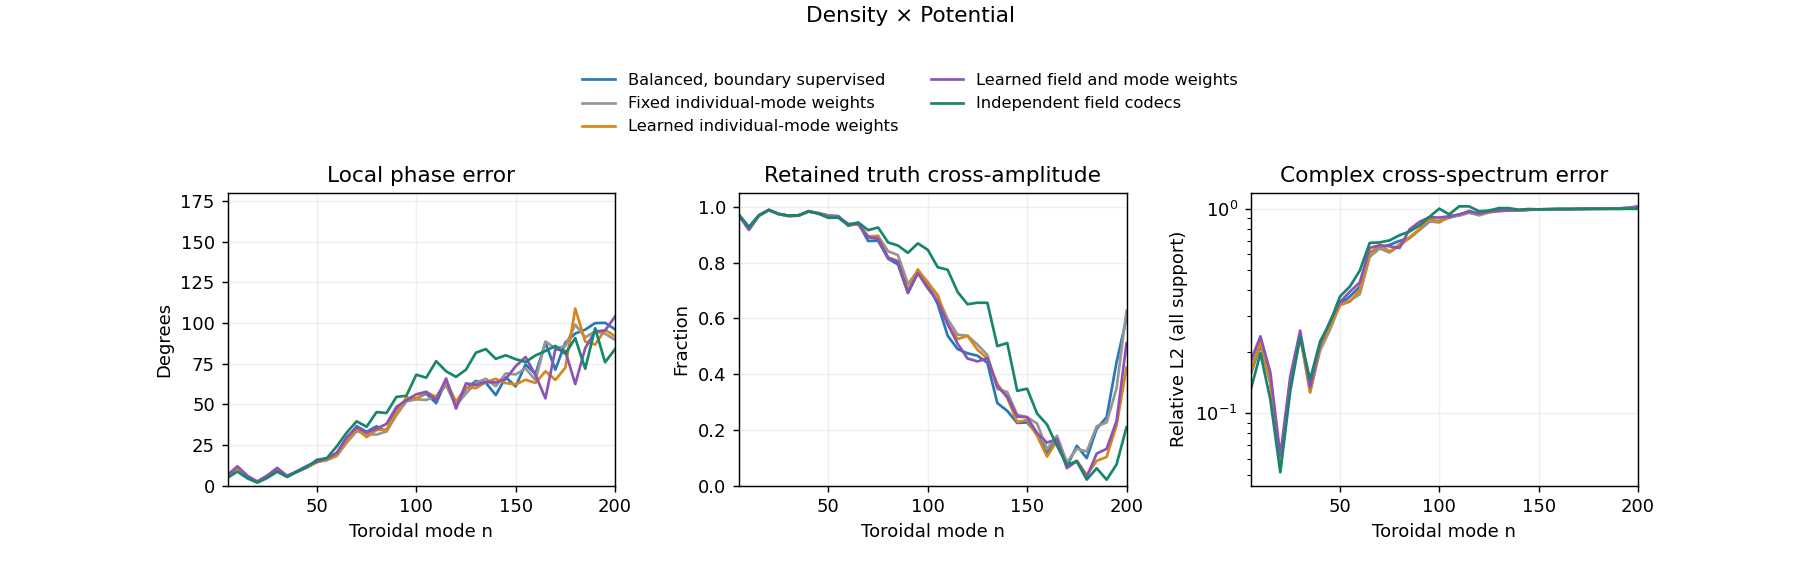
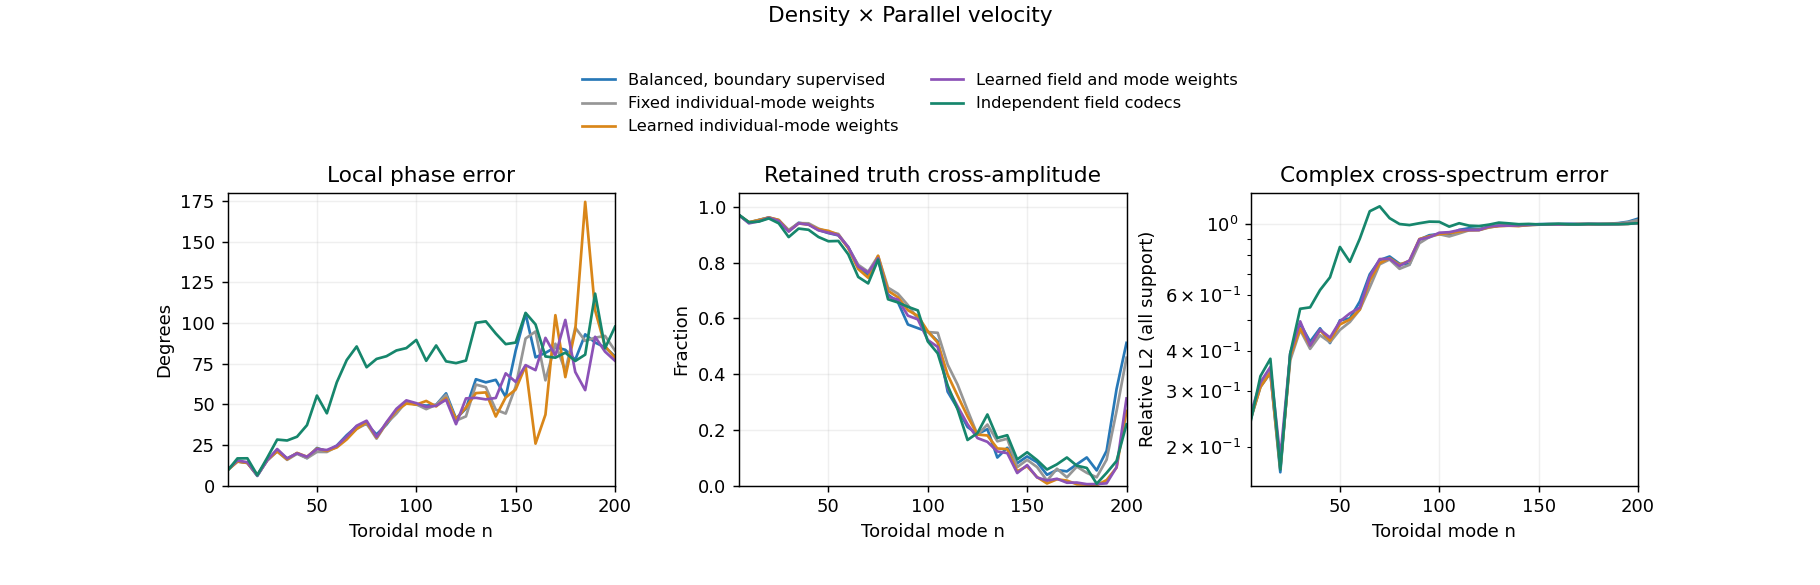
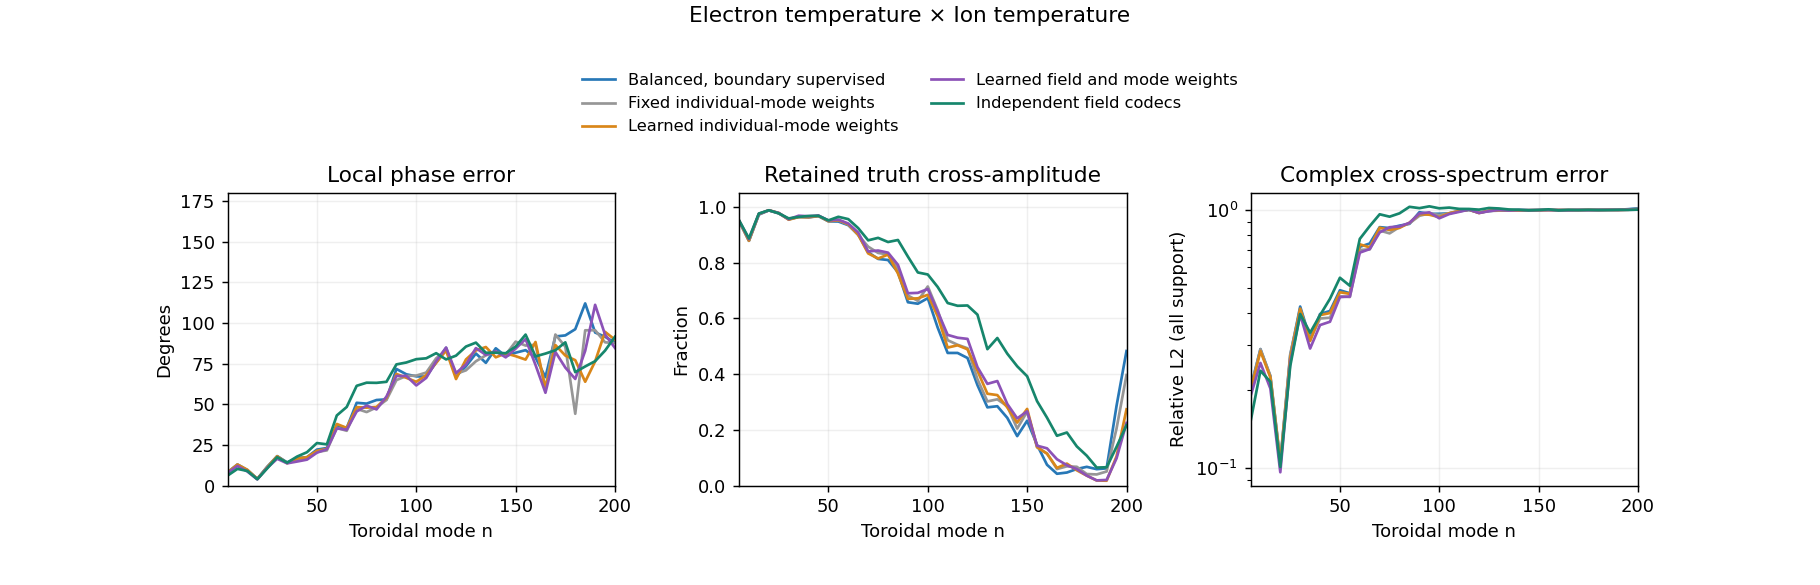
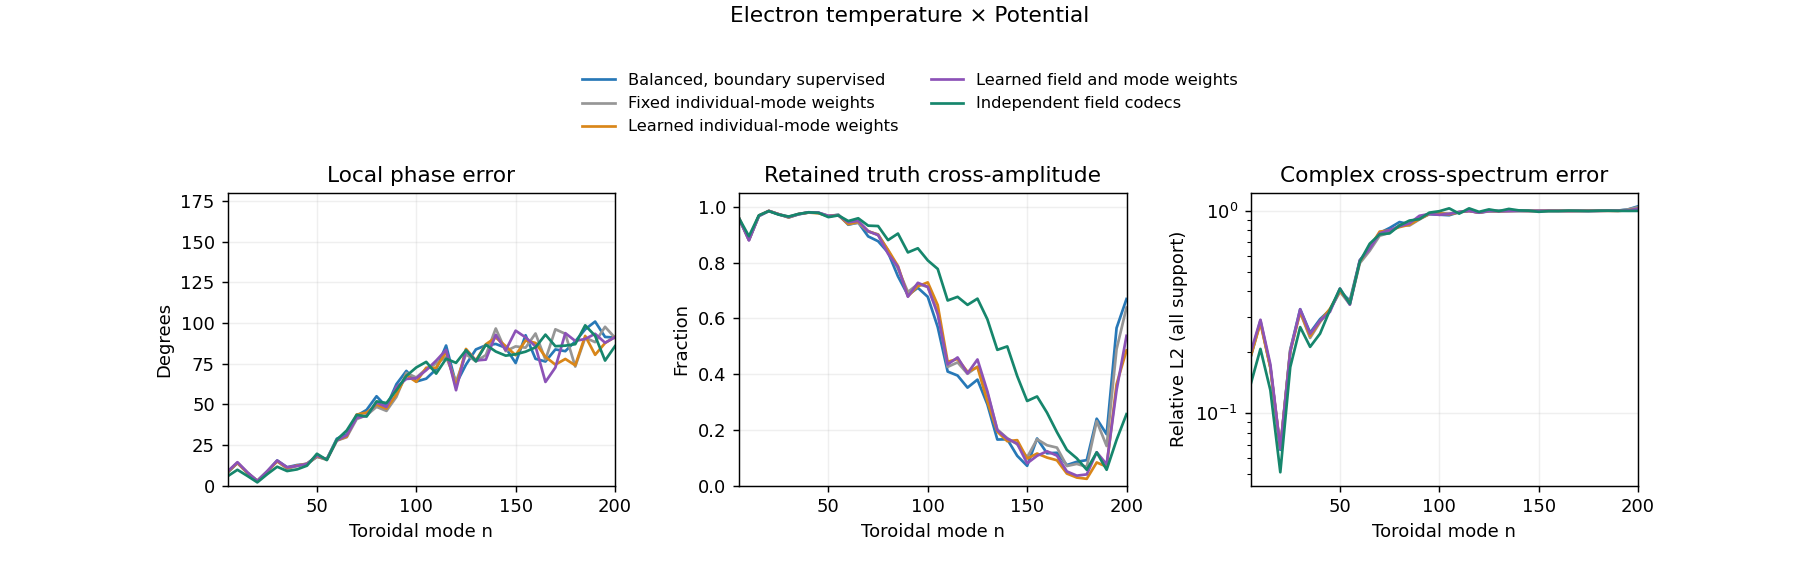
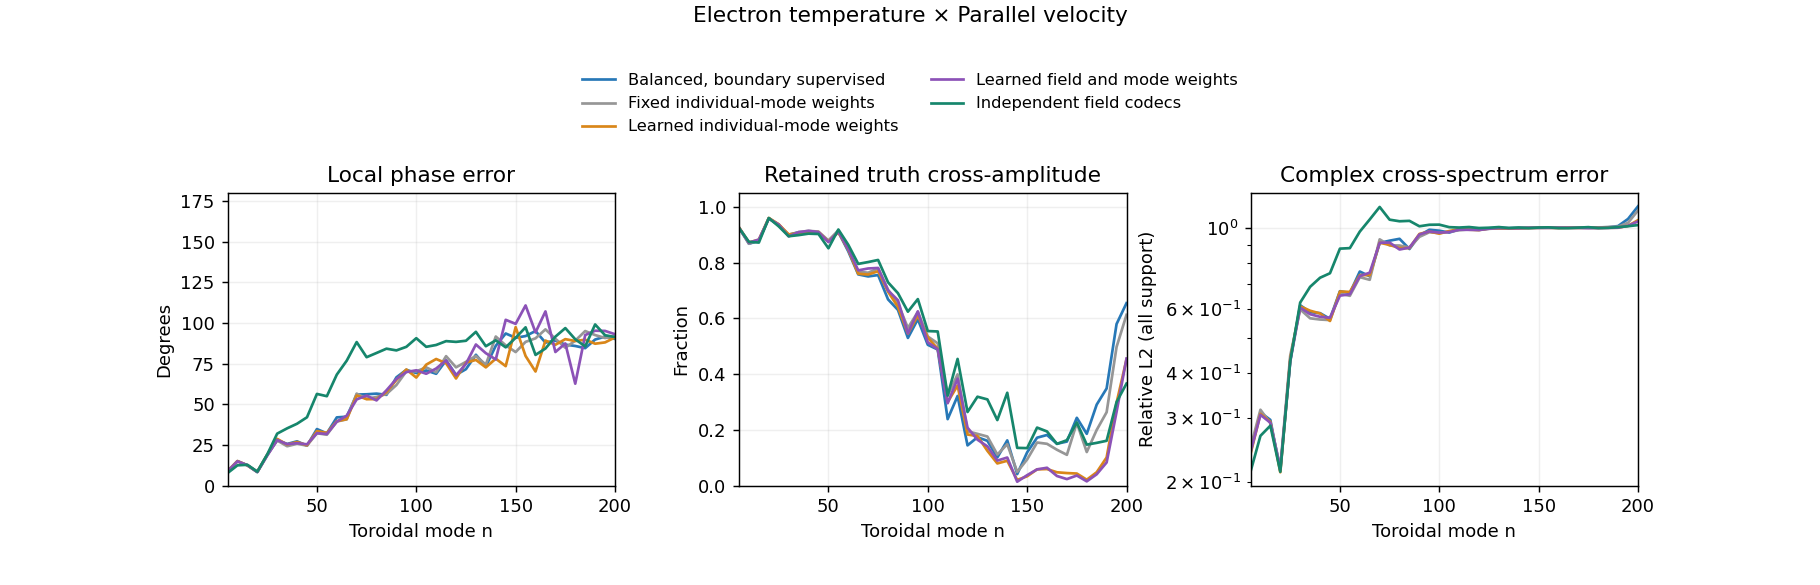
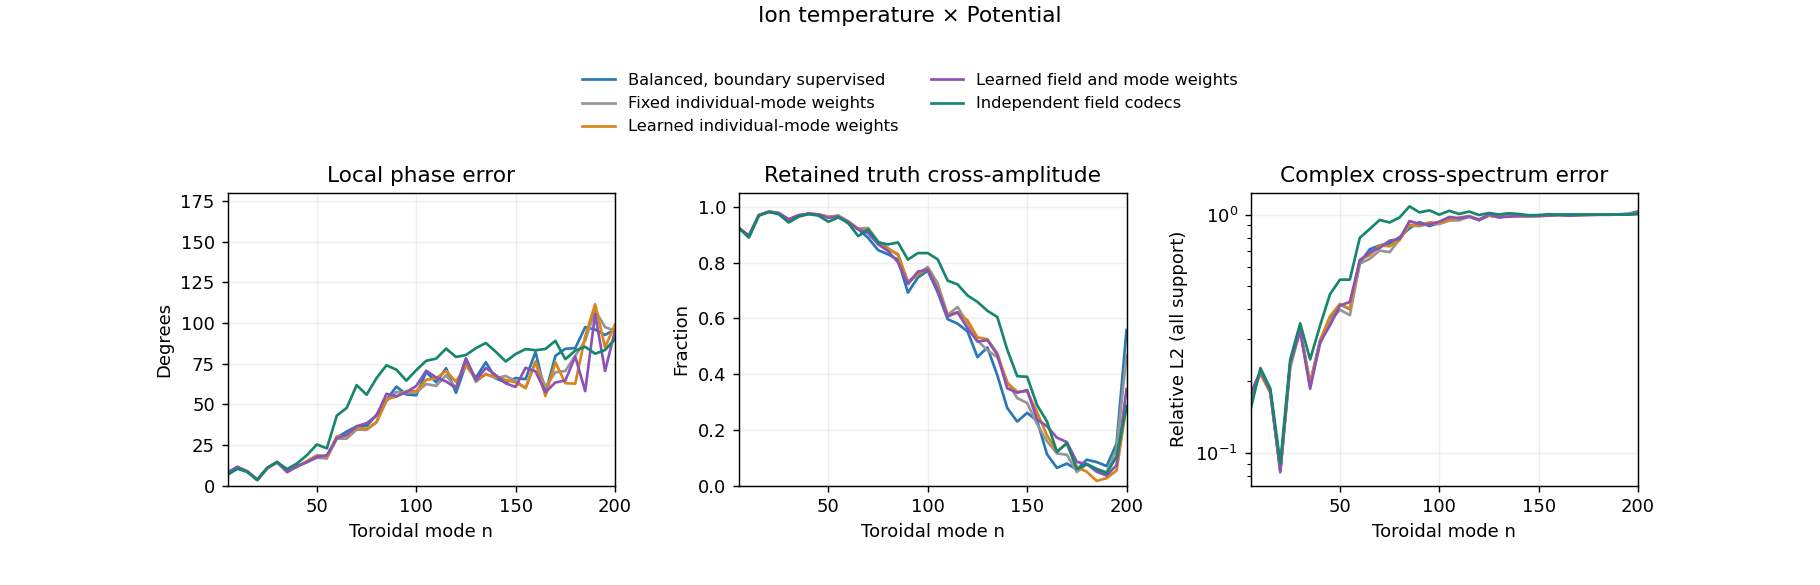
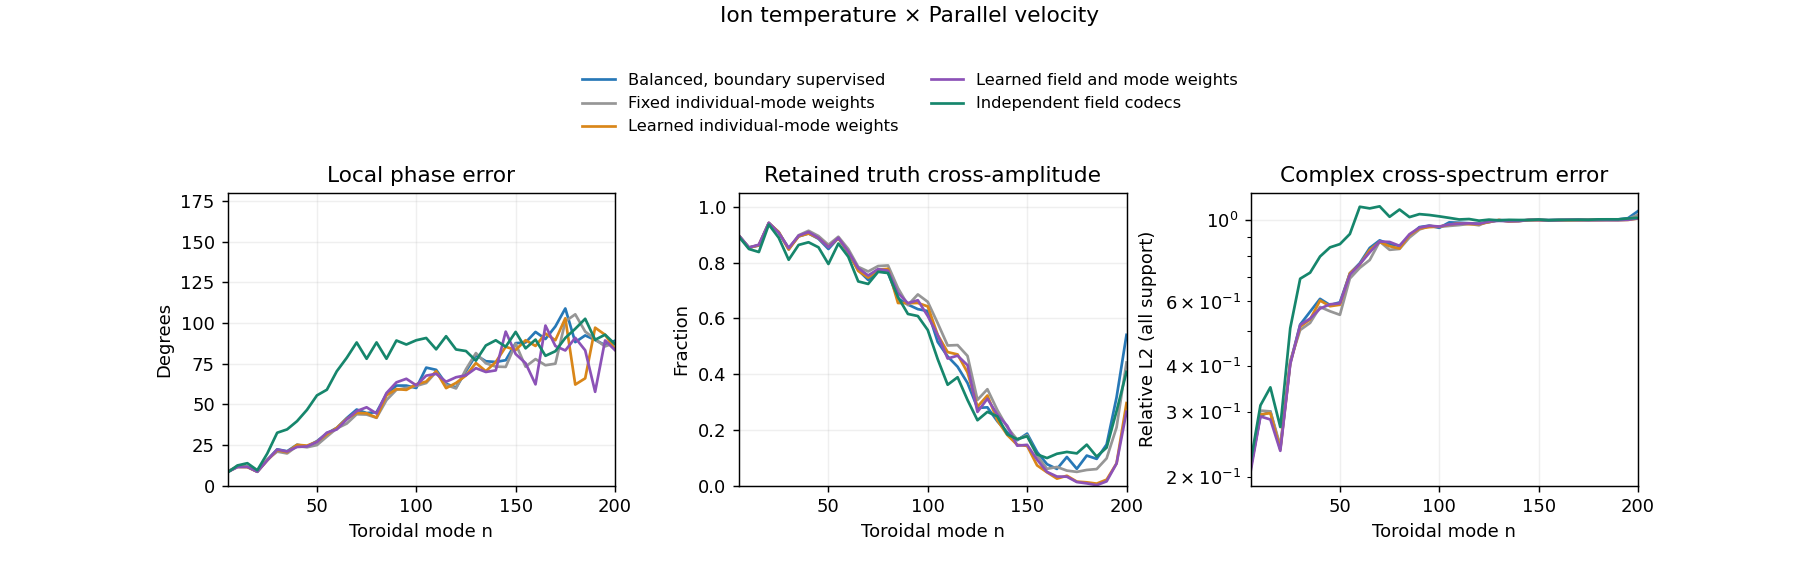
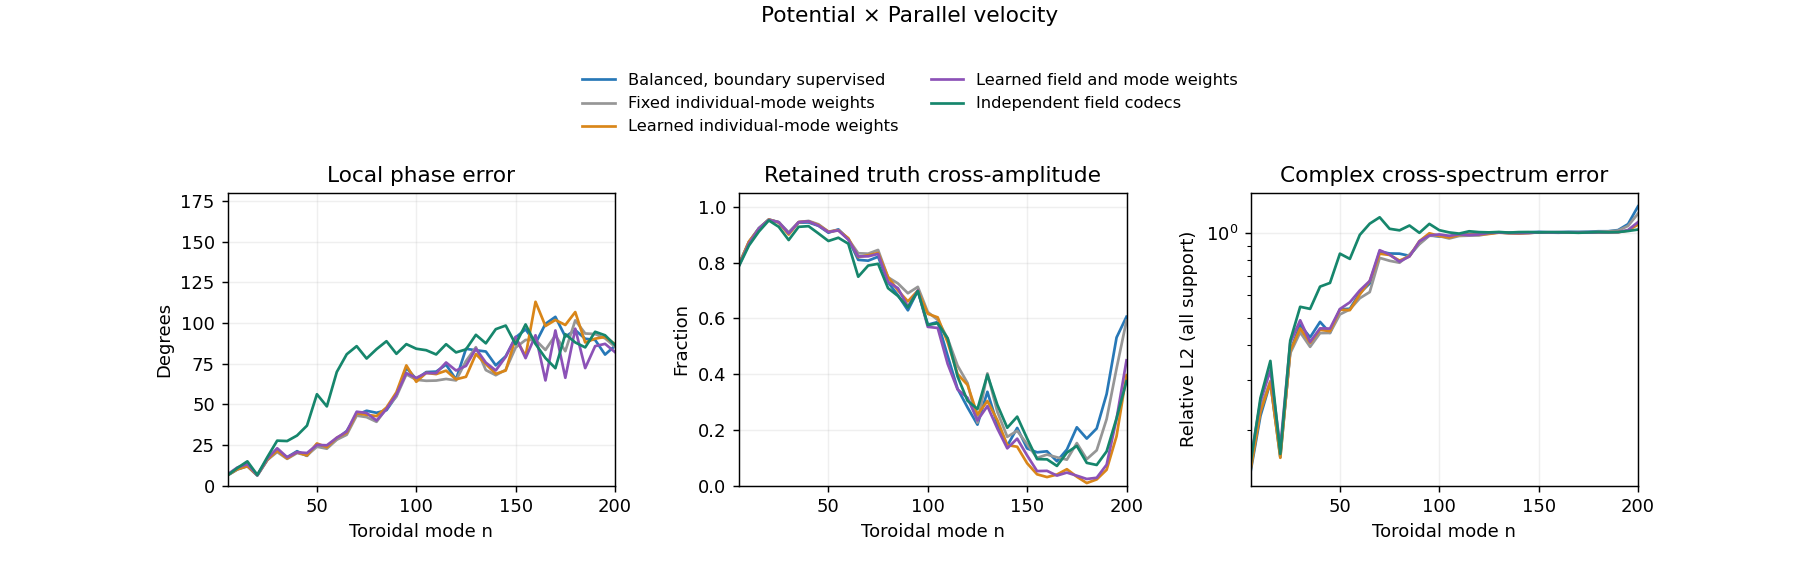
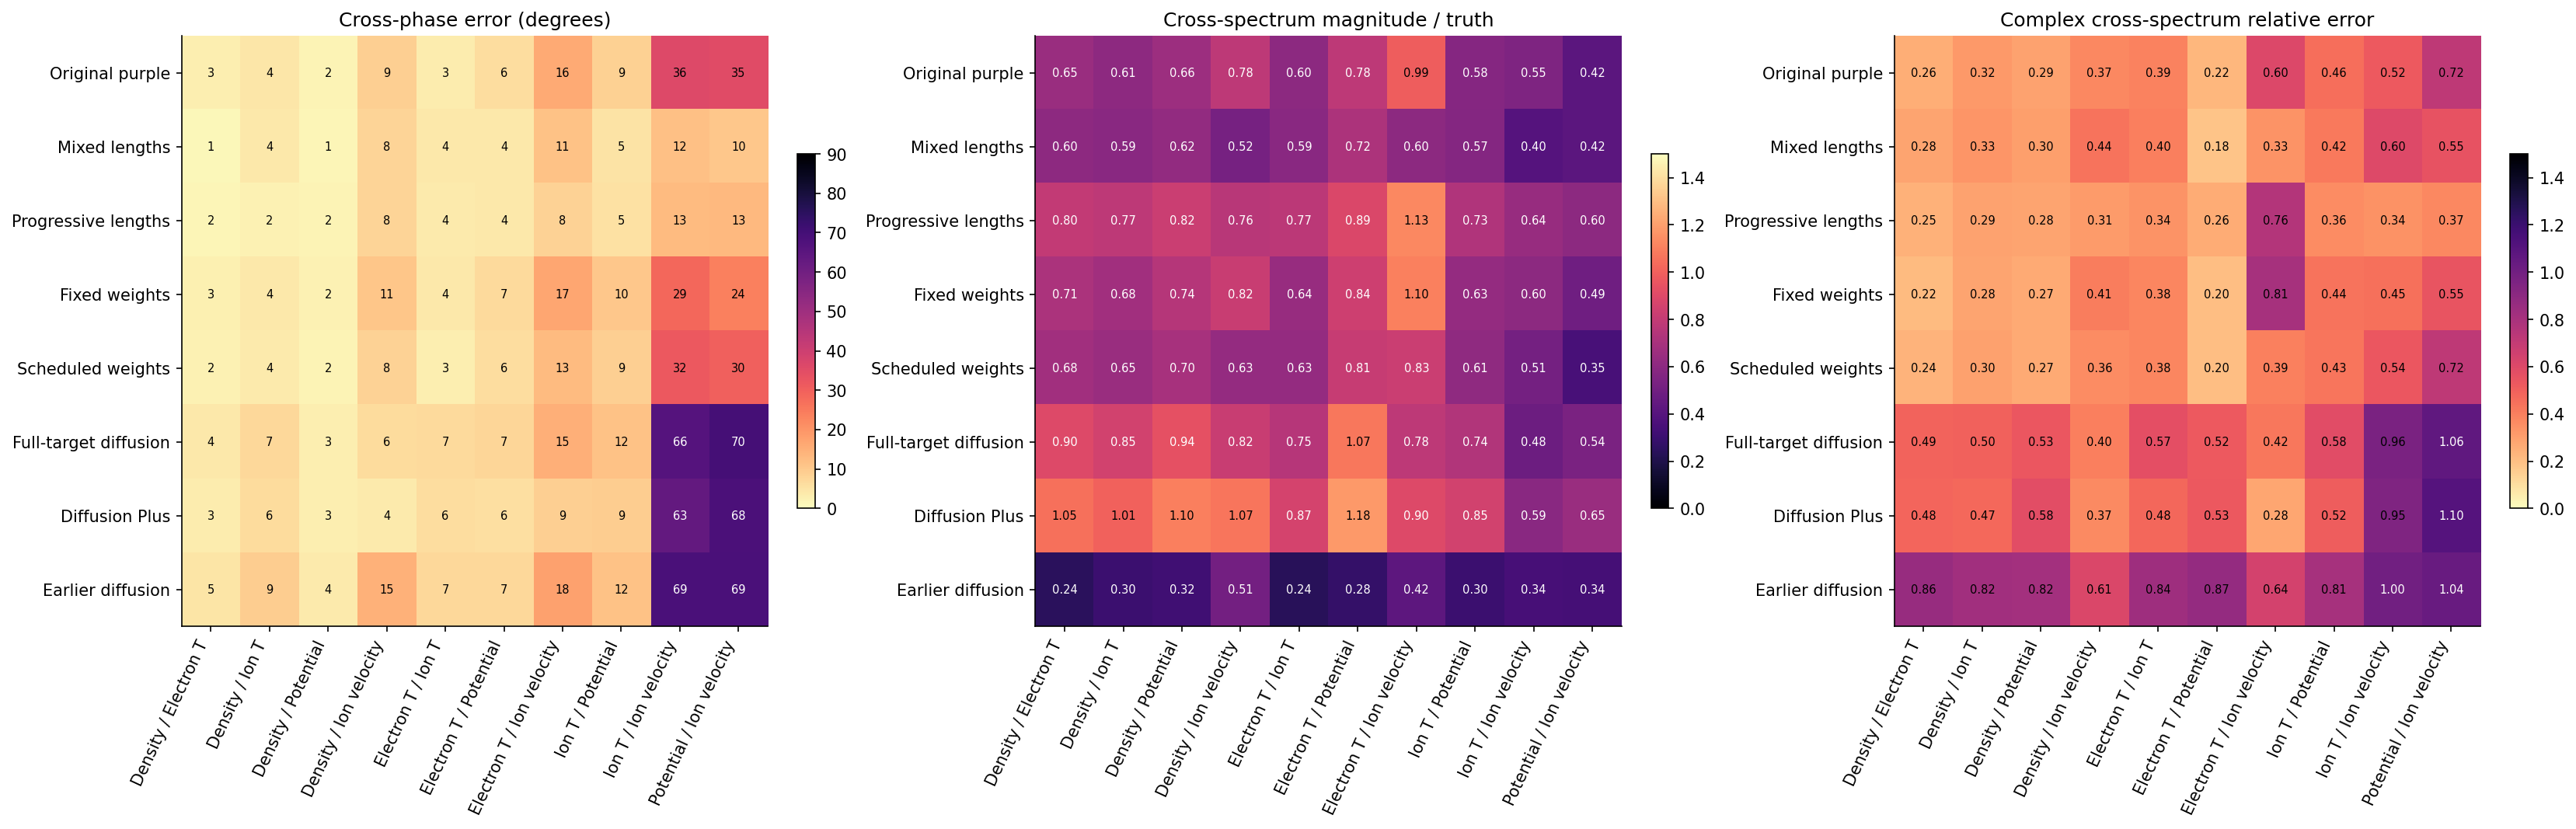
Pooled cross-phase can look good while local errors remain. Joint losses produce metric-specific gains.
Local versus pooled cross-phase. PNG · SVGLearned field–mode weighting and independent codecs: local phase in lower modes. PNGJoint-loss continuations: source-based target heat estimates. PNGMore figures from the earlier reports (51)Density × Electron temperature — n=5…50: pooled error, average local error, retained signal PNGDensity × Electron temperature — n=5…200: pooled error, average local error, retained signal PNGDensity × Ion temperature — n=5…50: pooled error, average local error, retained signal PNGDensity × Ion temperature — n=5…200: pooled error, average local error, retained signal PNGDensity × Potential — n=5…50: pooled error, average local error, retained signal PNGDensity × Potential — n=5…200: pooled error, average local error, retained signal PNGDensity × Parallel velocity — n=5…50: pooled error, average local error, retained signal PNGDensity × Parallel velocity — n=5…200: pooled error, average local error, retained signal PNGElectron temperature × Ion temperature — n=5…50: pooled error, average local error, retained signal PNGElectron temperature × Ion temperature — n=5…200: pooled error, average local error, retained signal PNGElectron temperature × Potential — n=5…50: pooled error, average local error, retained signal PNGElectron temperature × Potential — n=5…200: pooled error, average local error, retained signal PNGElectron temperature × Parallel velocity — n=5…50: pooled error, average local error, retained signal PNGElectron temperature × Parallel velocity — n=5…200: pooled error, average local error, retained signal PNGIon temperature × Potential — n=5…50: pooled error, average local error, retained signal PNGIon temperature × Potential — n=5…200: pooled error, average local error, retained signal PNGIon temperature × Parallel velocity — n=5…50: pooled error, average local error, retained signal PNGIon temperature × Parallel velocity — n=5…200: pooled error, average local error, retained signal PNGPotential × Parallel velocity — n=5…50: pooled error, average local error, retained signal PNGPotential × Parallel velocity — n=5…200: pooled error, average local error, retained signal PNGDensity: mode RMS, RMSE and field-to-truth phase error PNGElectron temperature: mode RMS, RMSE and field-to-truth phase error PNGIon temperature: mode RMS, RMSE and field-to-truth phase error PNGPotential: mode RMS, RMSE and field-to-truth phase error PNGParallel velocity: mode RMS, RMSE and field-to-truth phase error PNGDensity × Electron temperature: all three snapshots at n=5,10,20, with local and pooled scores PNGDensity × Ion temperature: all three snapshots at n=5,10,20, with local and pooled scores PNGDensity × Potential: all three snapshots at n=5,10,20, with local and pooled scores PNGDensity × Parallel velocity: all three snapshots at n=5,10,20, with local and pooled scores PNGElectron temperature × Ion temperature: all three snapshots at n=5,10,20, with local and pooled scores PNGElectron temperature × Potential: all three snapshots at n=5,10,20, with local and pooled scores PNGElectron temperature × Parallel velocity: all three snapshots at n=5,10,20, with local and pooled scores PNGIon temperature × Potential: all three snapshots at n=5,10,20, with local and pooled scores PNGIon temperature × Parallel velocity: all three snapshots at n=5,10,20, with local and pooled scores PNGPotential × Parallel velocity: all three snapshots at n=5,10,20, with local and pooled scores PNGreconstruction simply PNGphase explained PNG · SVGmagnitude vs error PNG · SVGall pairs PNG · SVGspatial phase PNG · SVGlocal phase n200 PNGpair 0 1 PNGpair 0 2 PNGpair 0 3 PNGpair 0 4 PNGpair 1 2 PNGpair 1 3 PNGpair 1 4 PNGpair 2 3 PNGpair 2 4 PNGpair 3 4 PNG
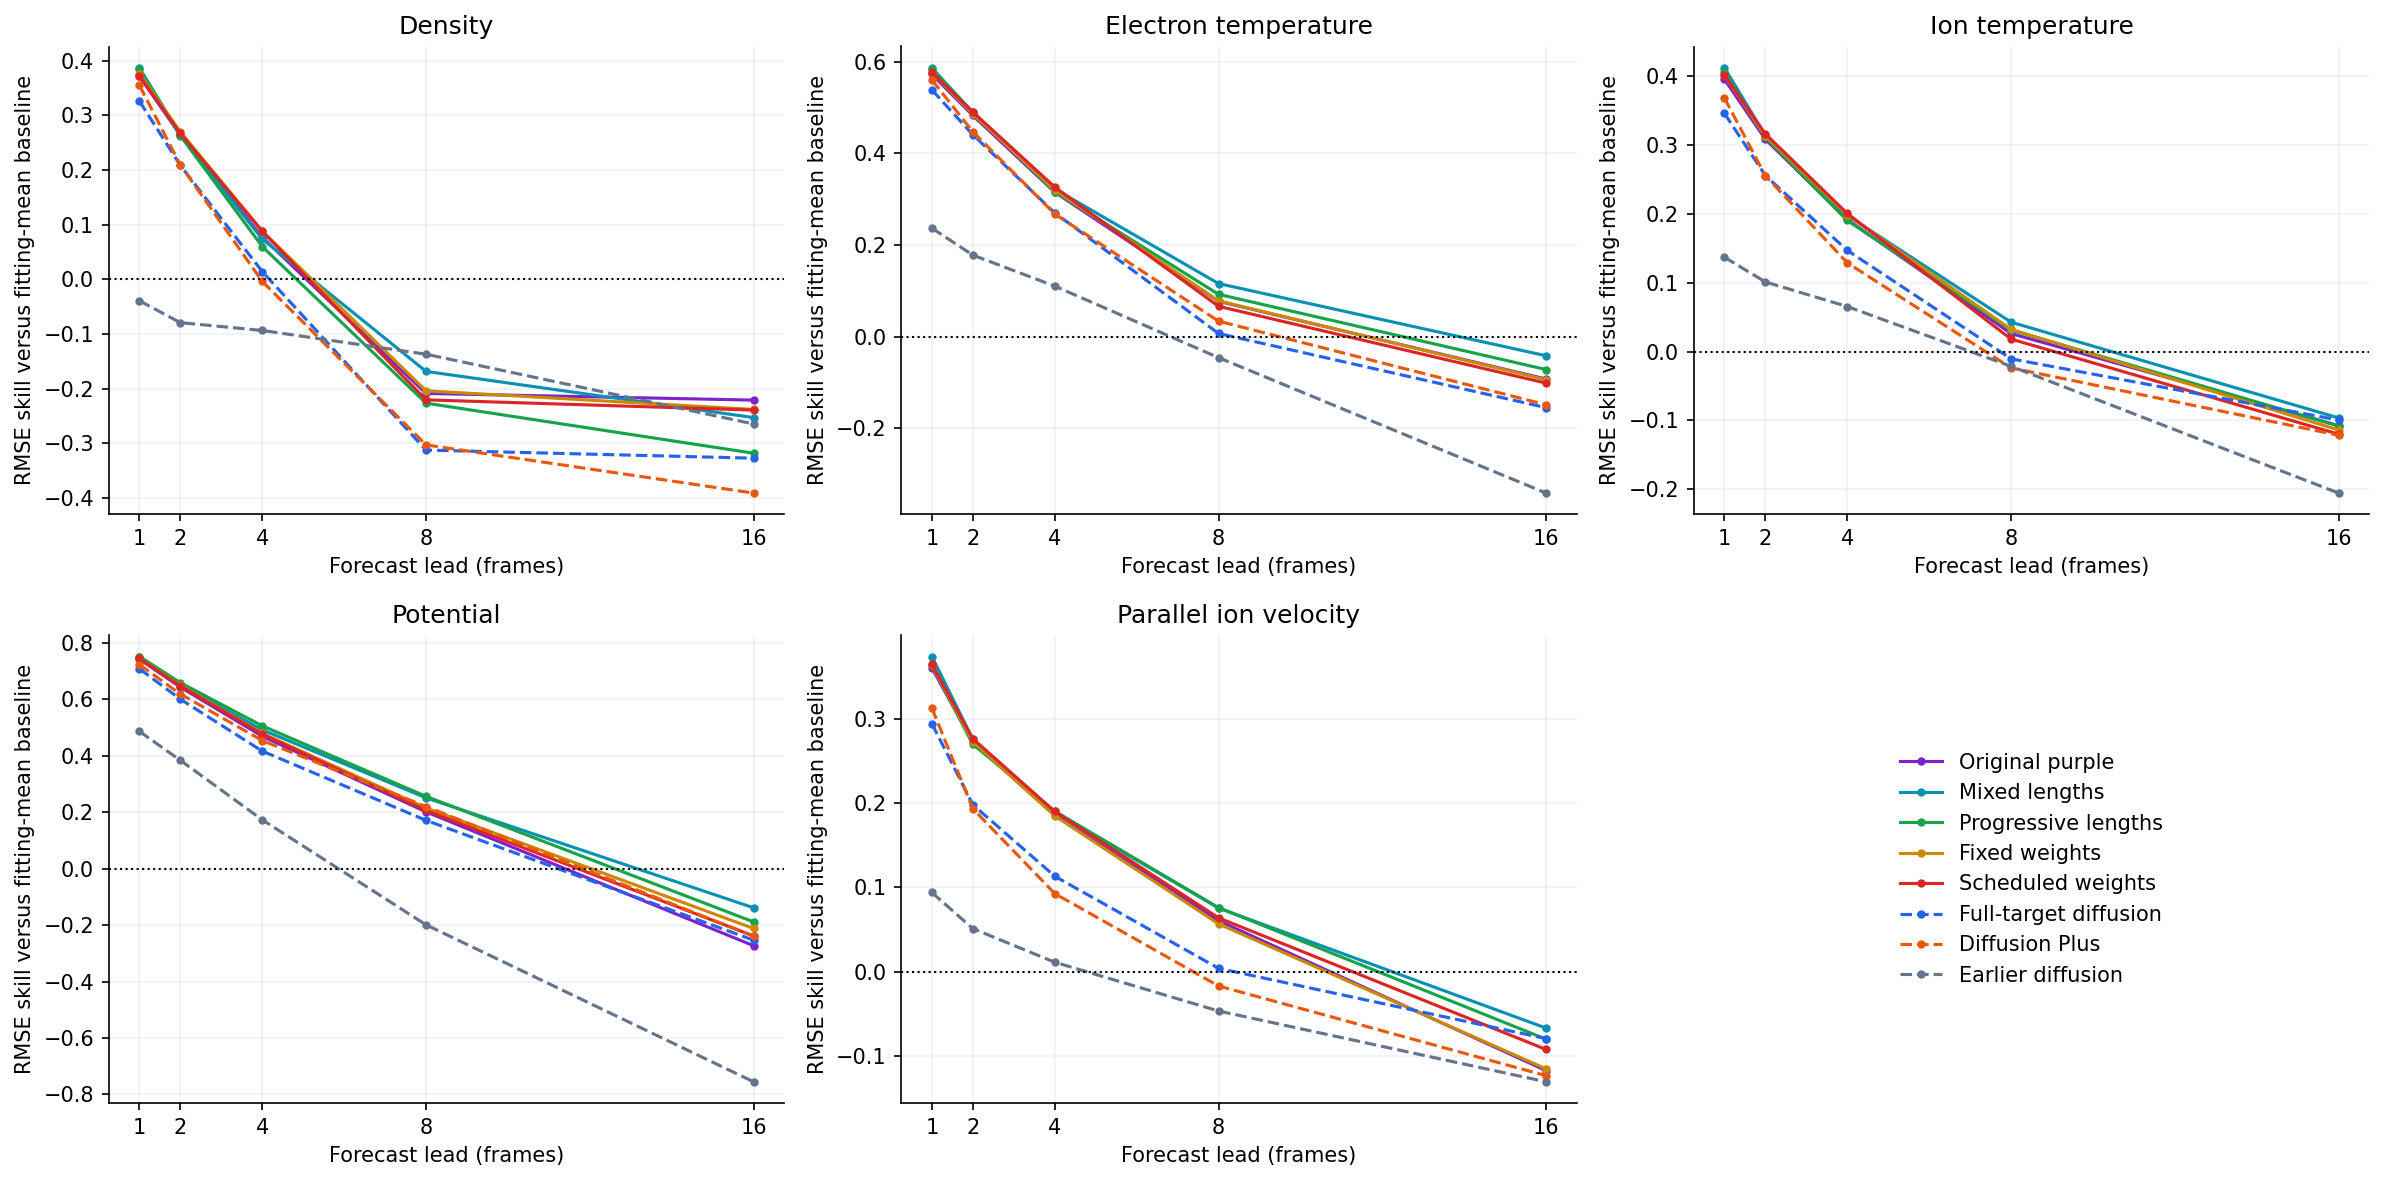
Predict future volumes
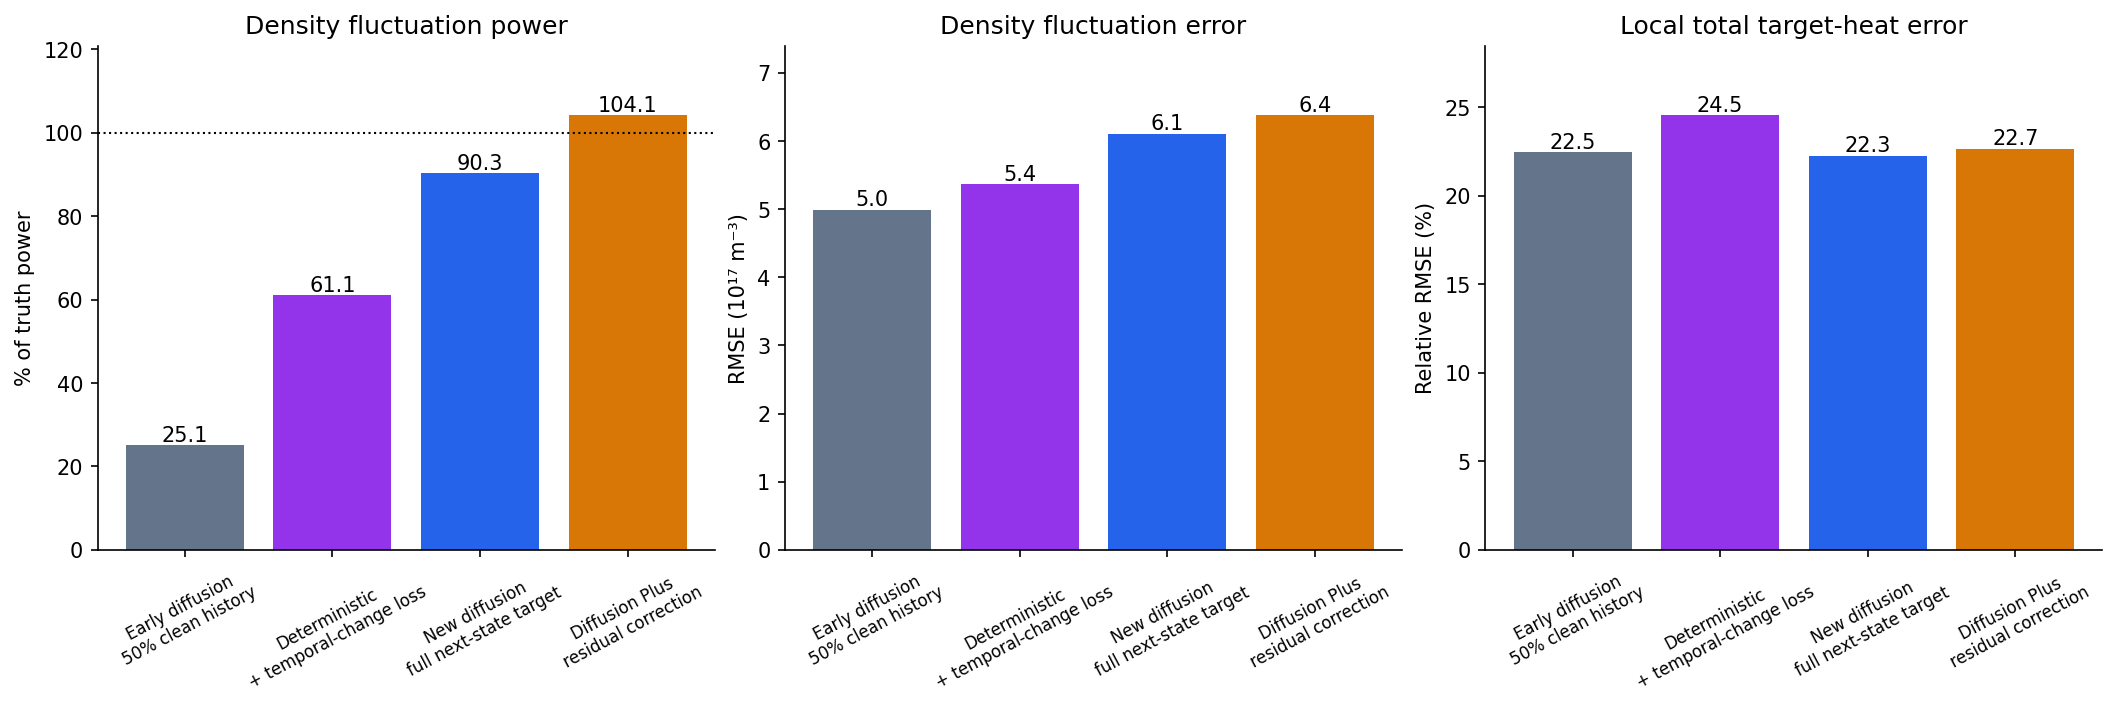
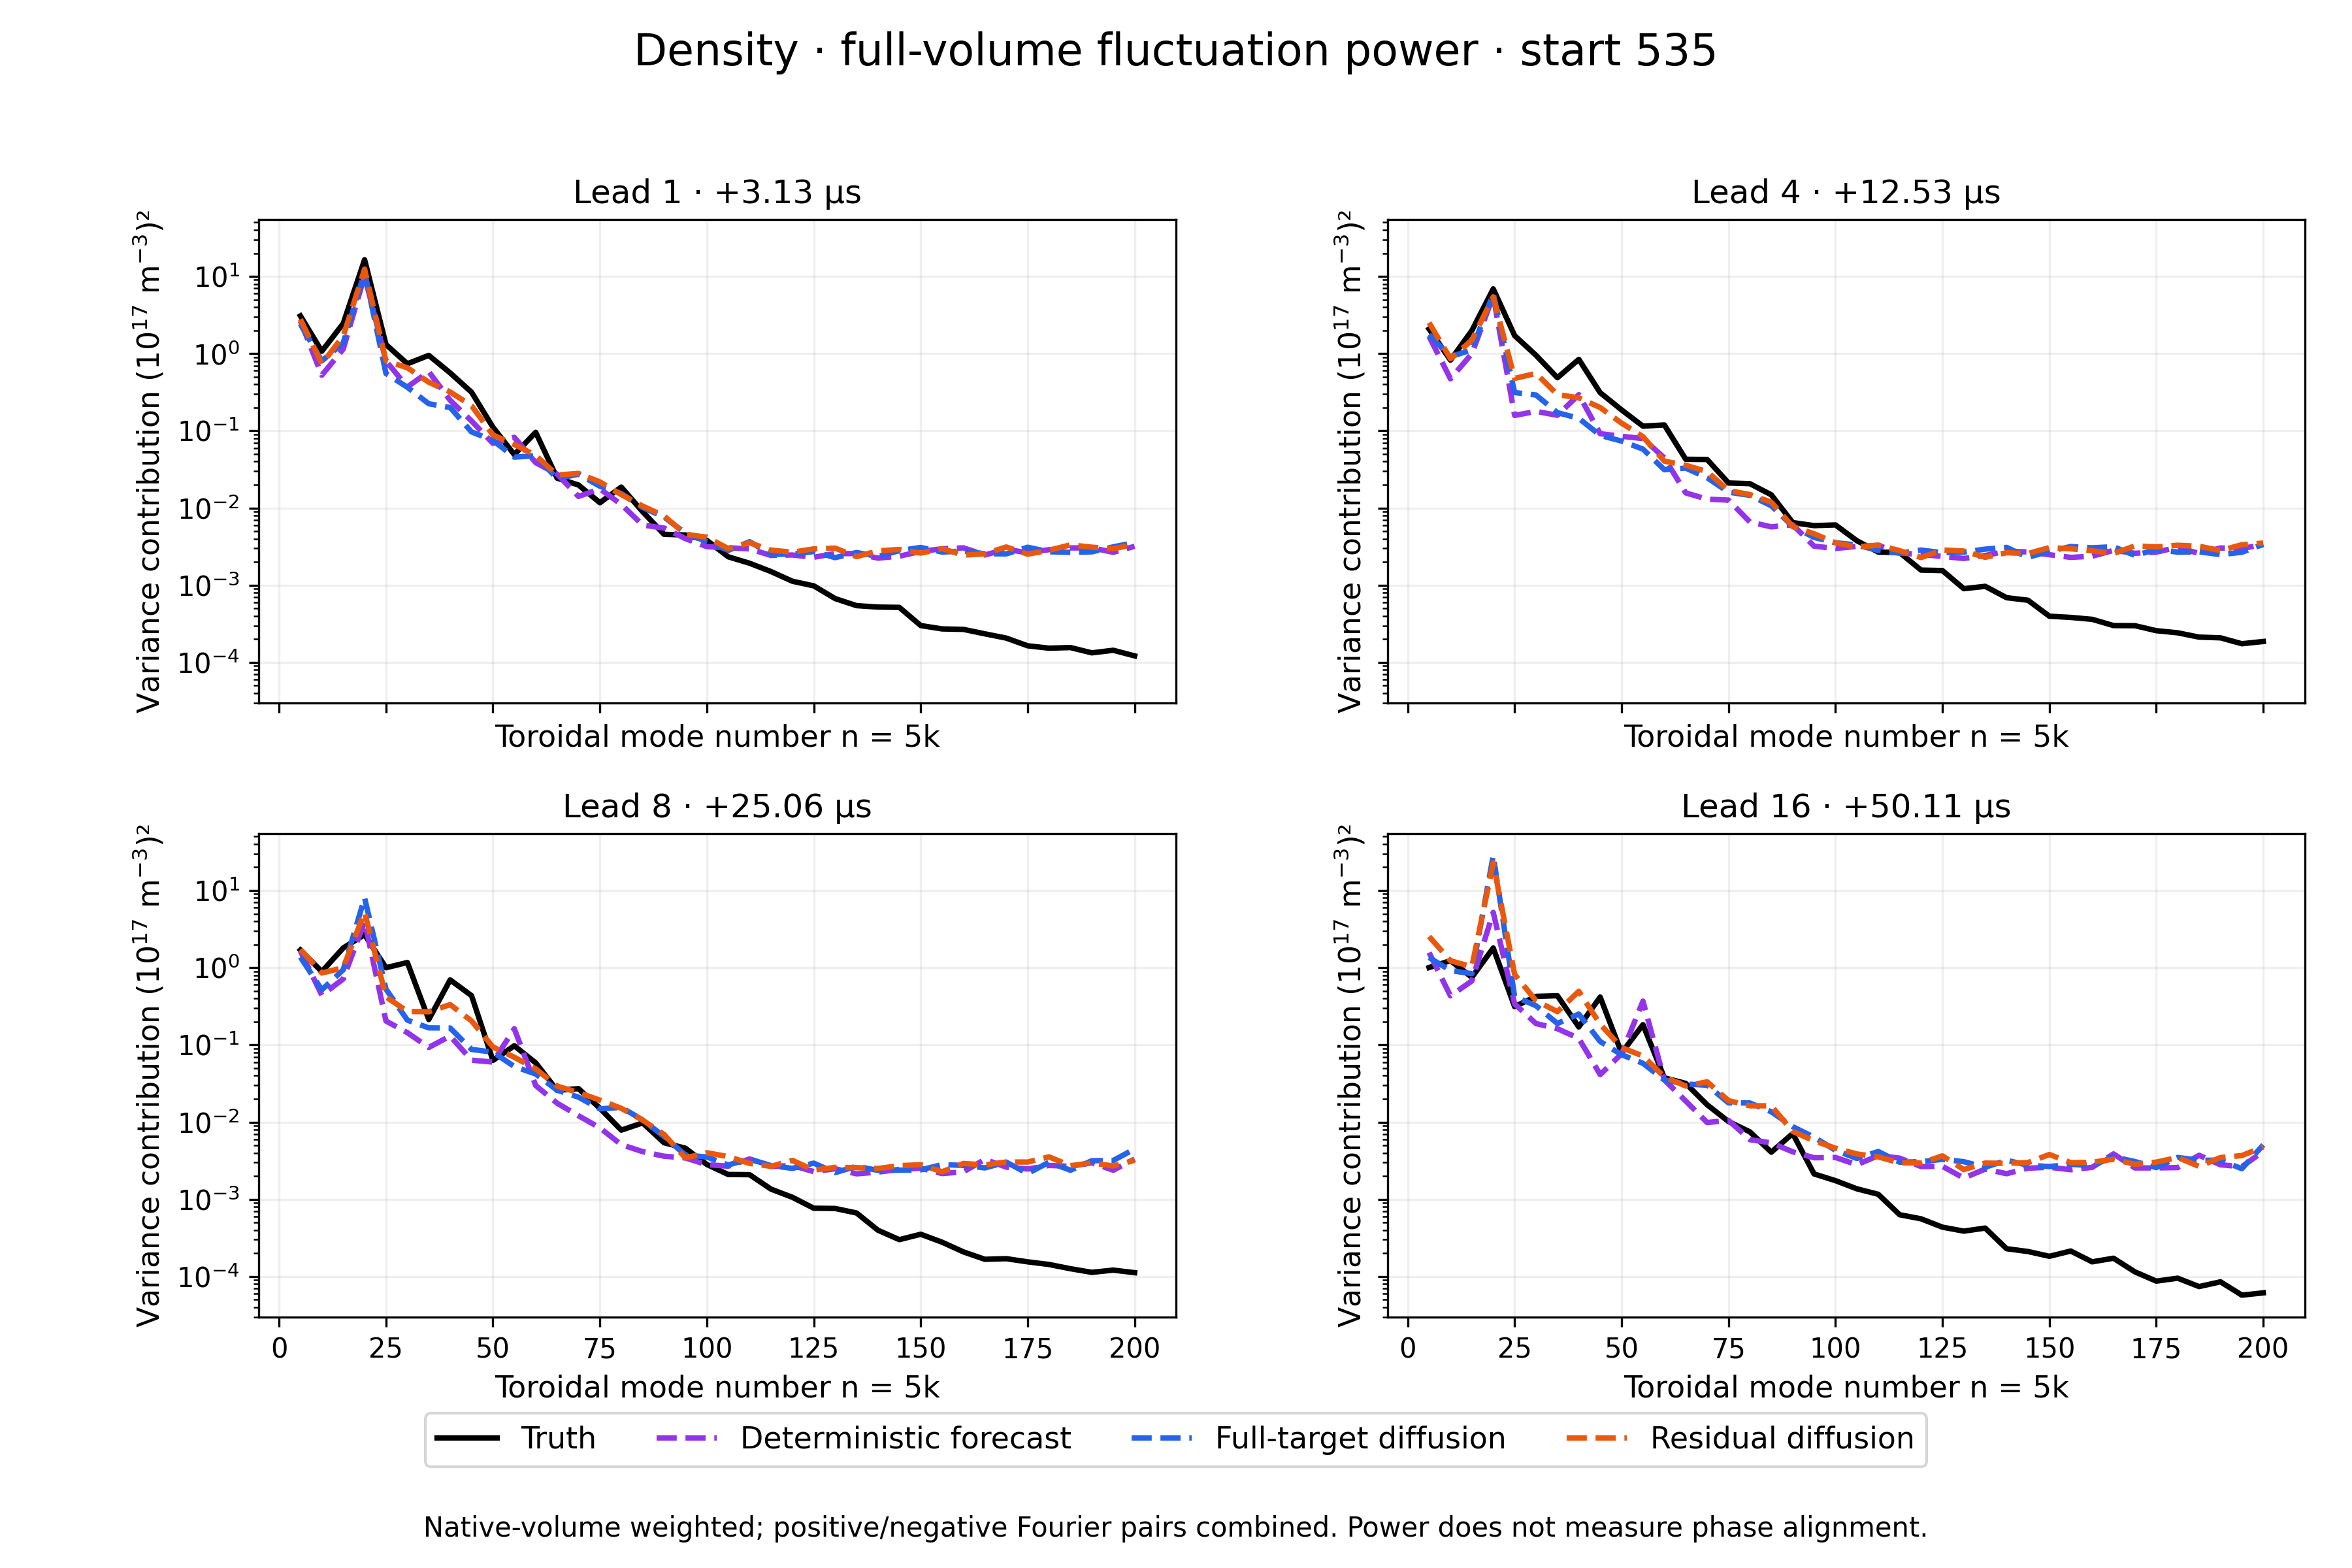
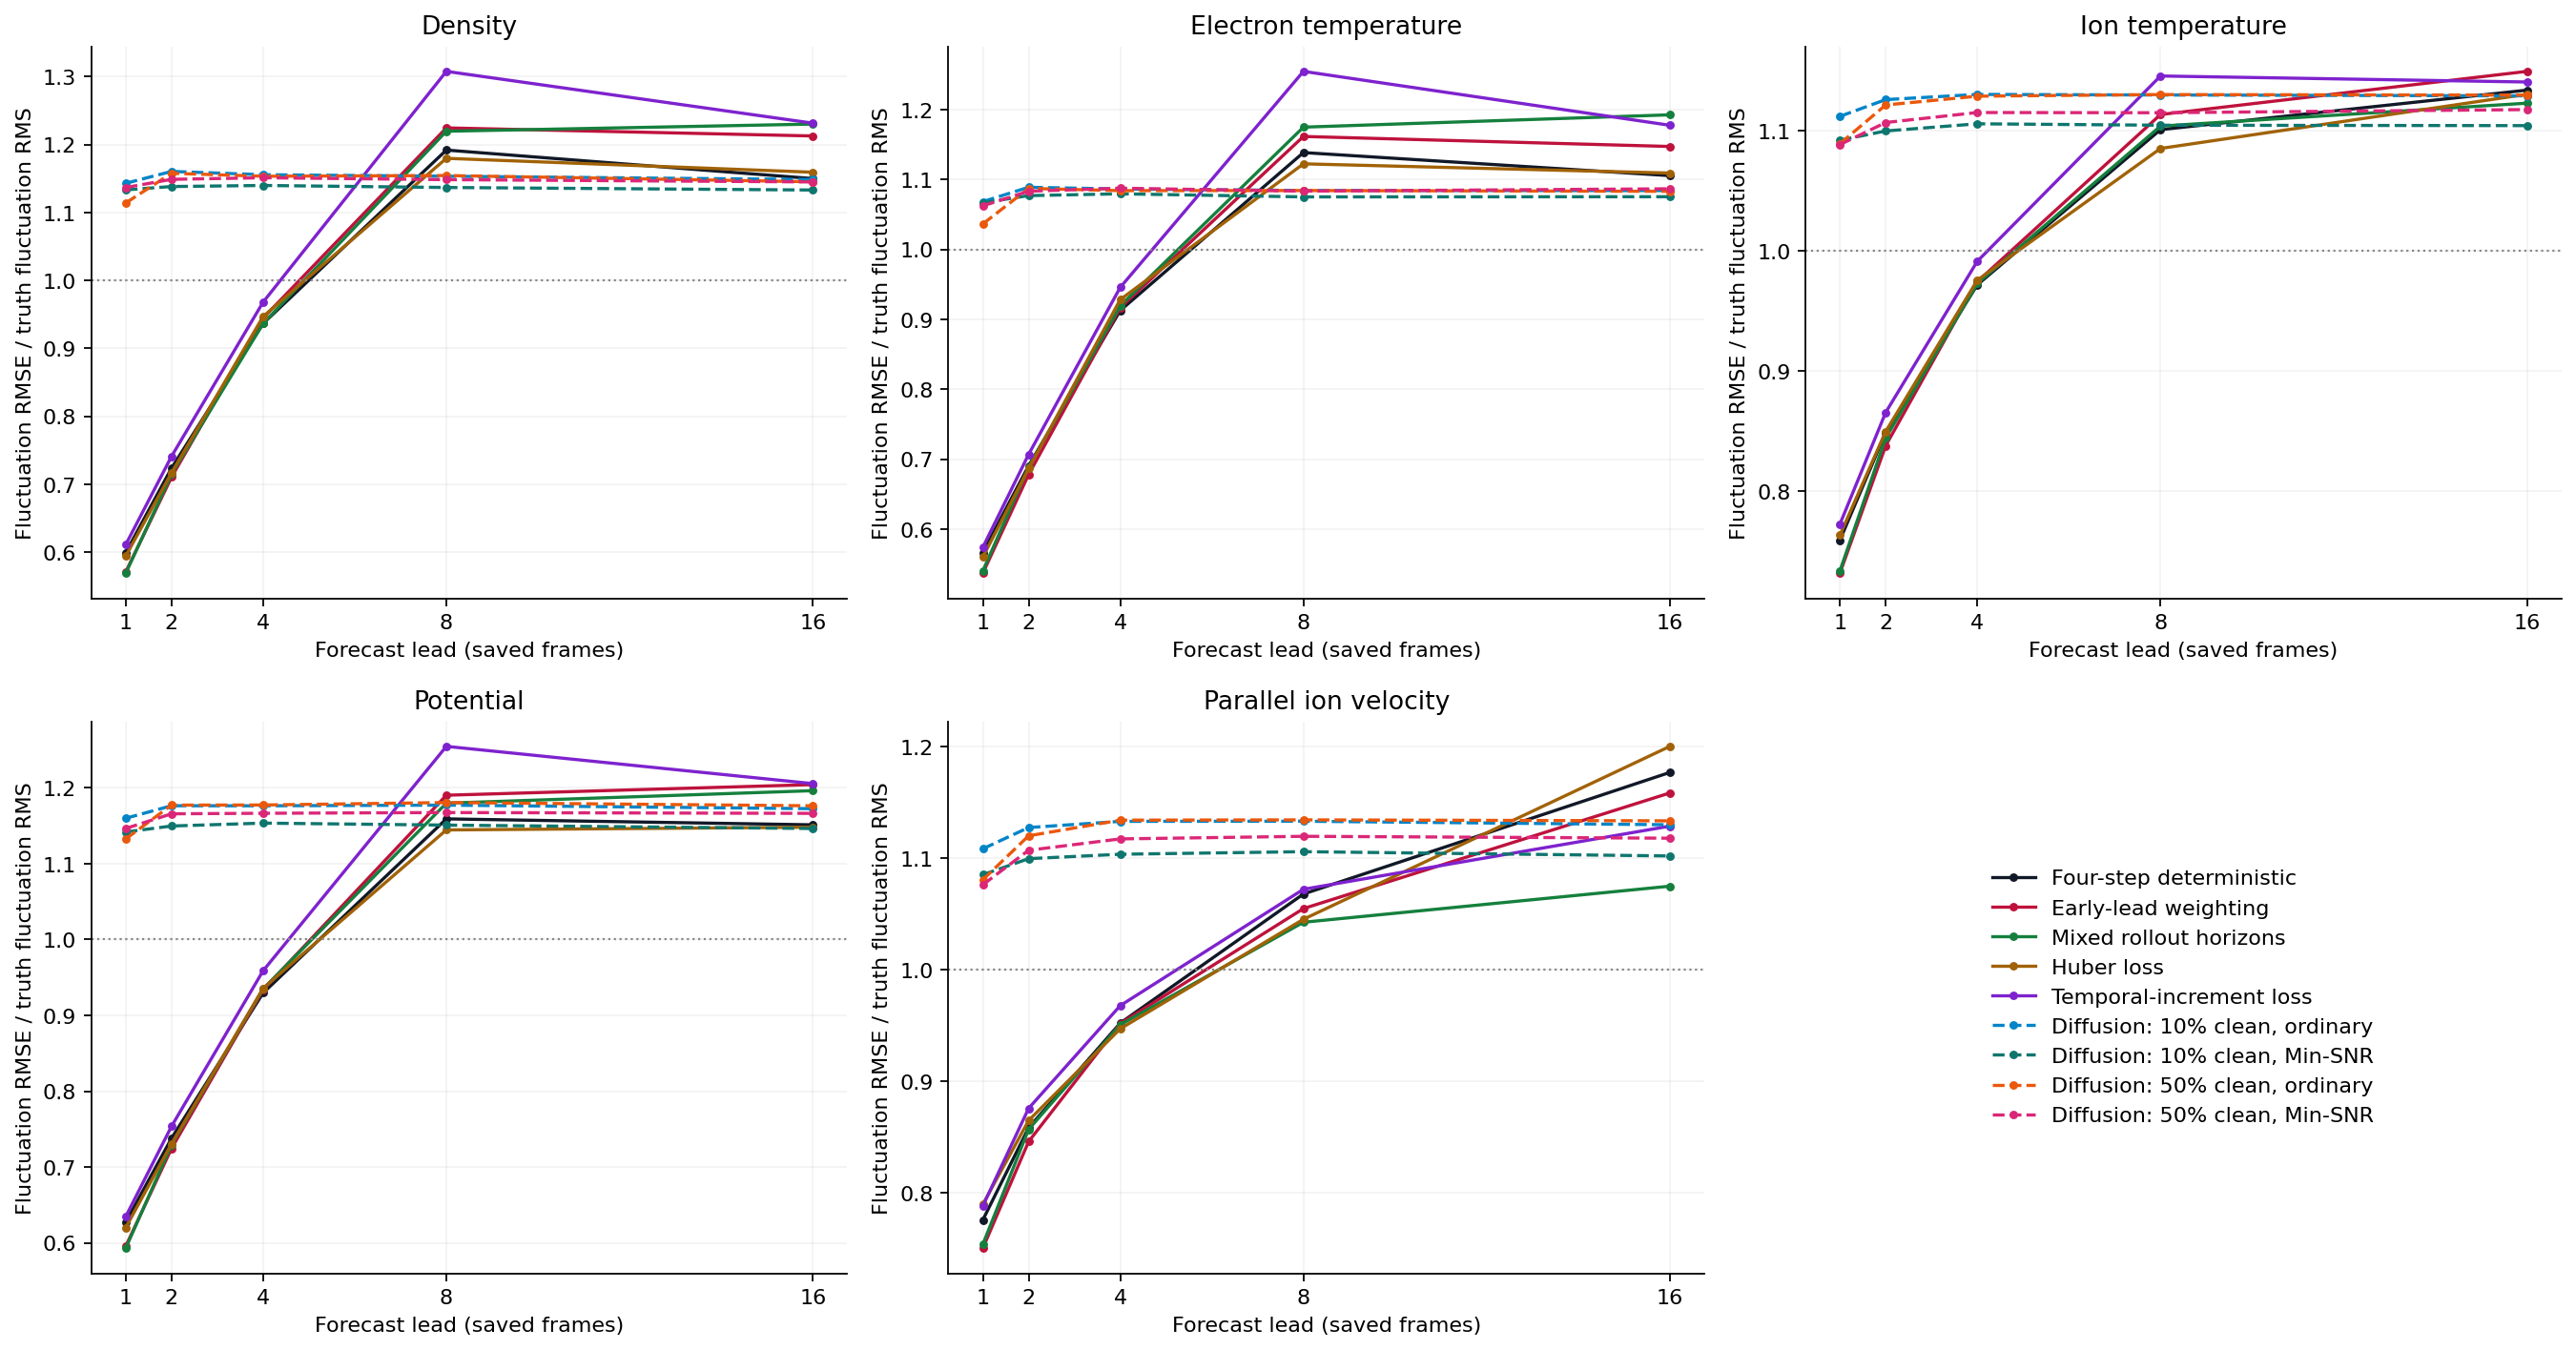
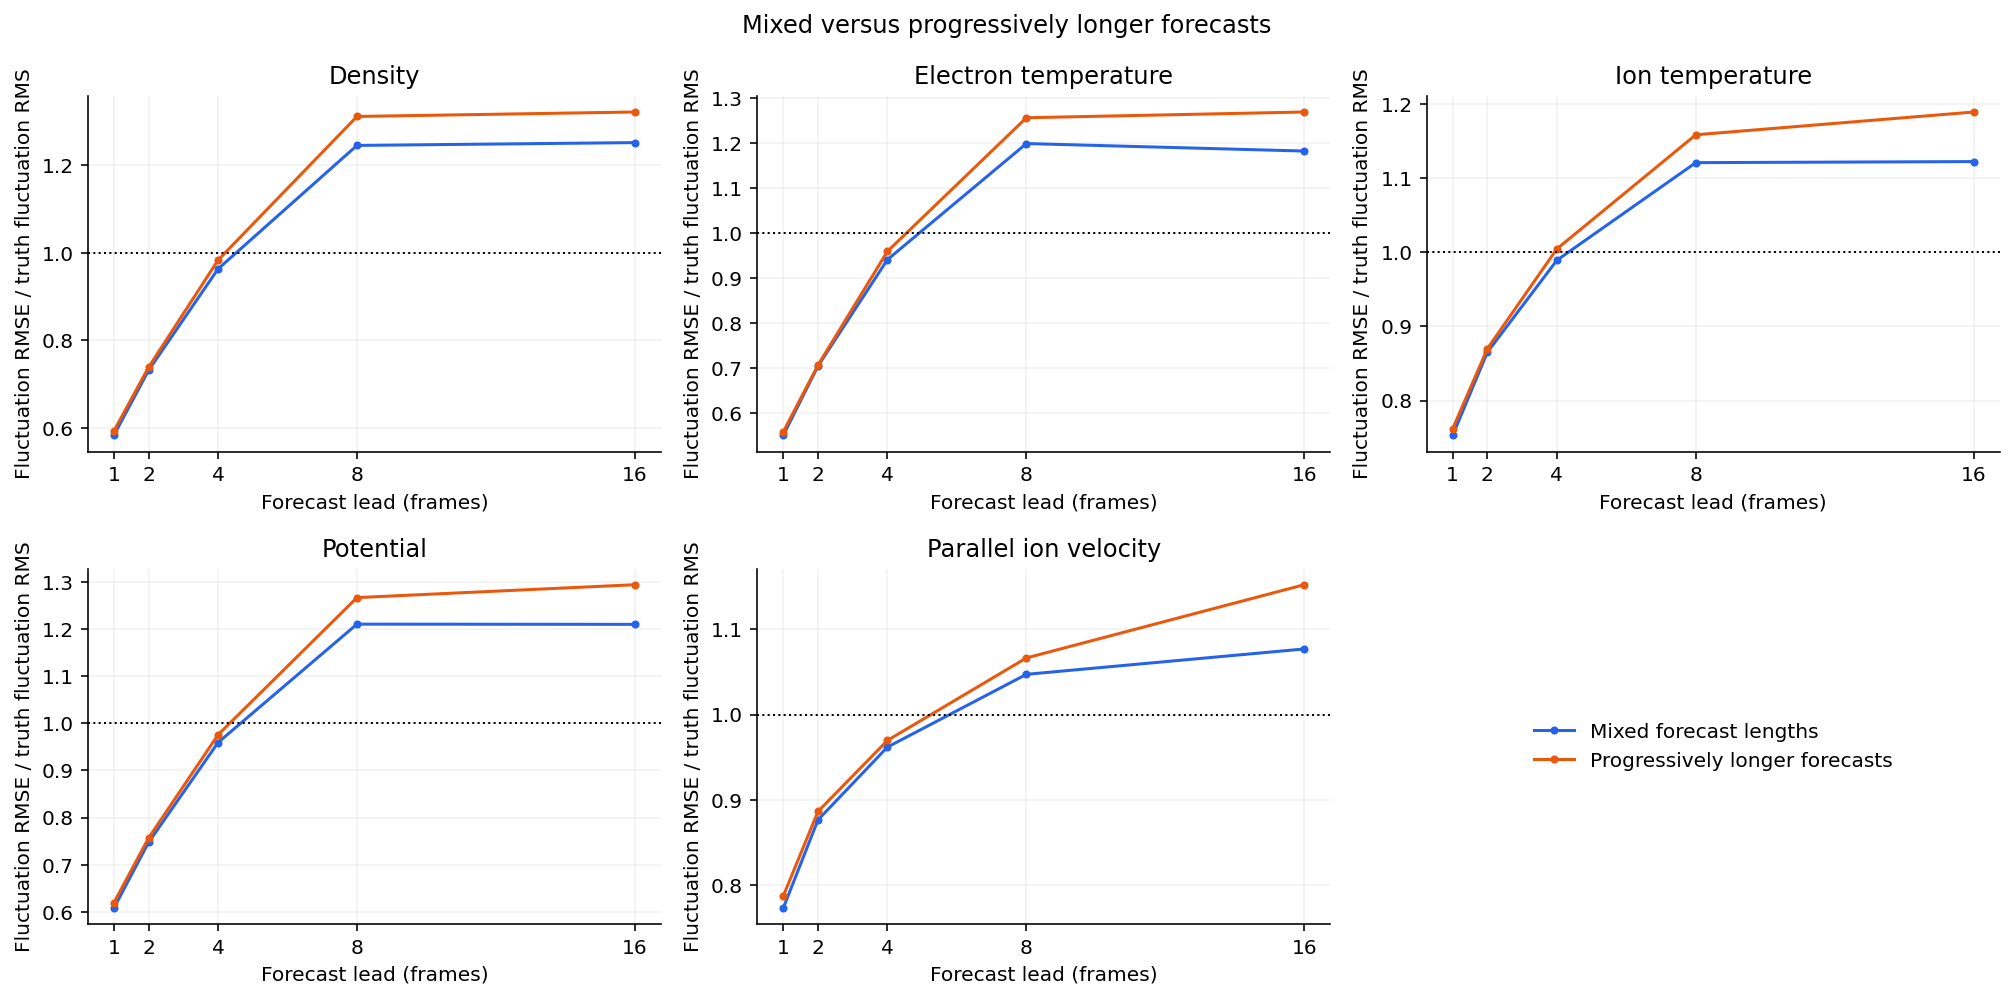
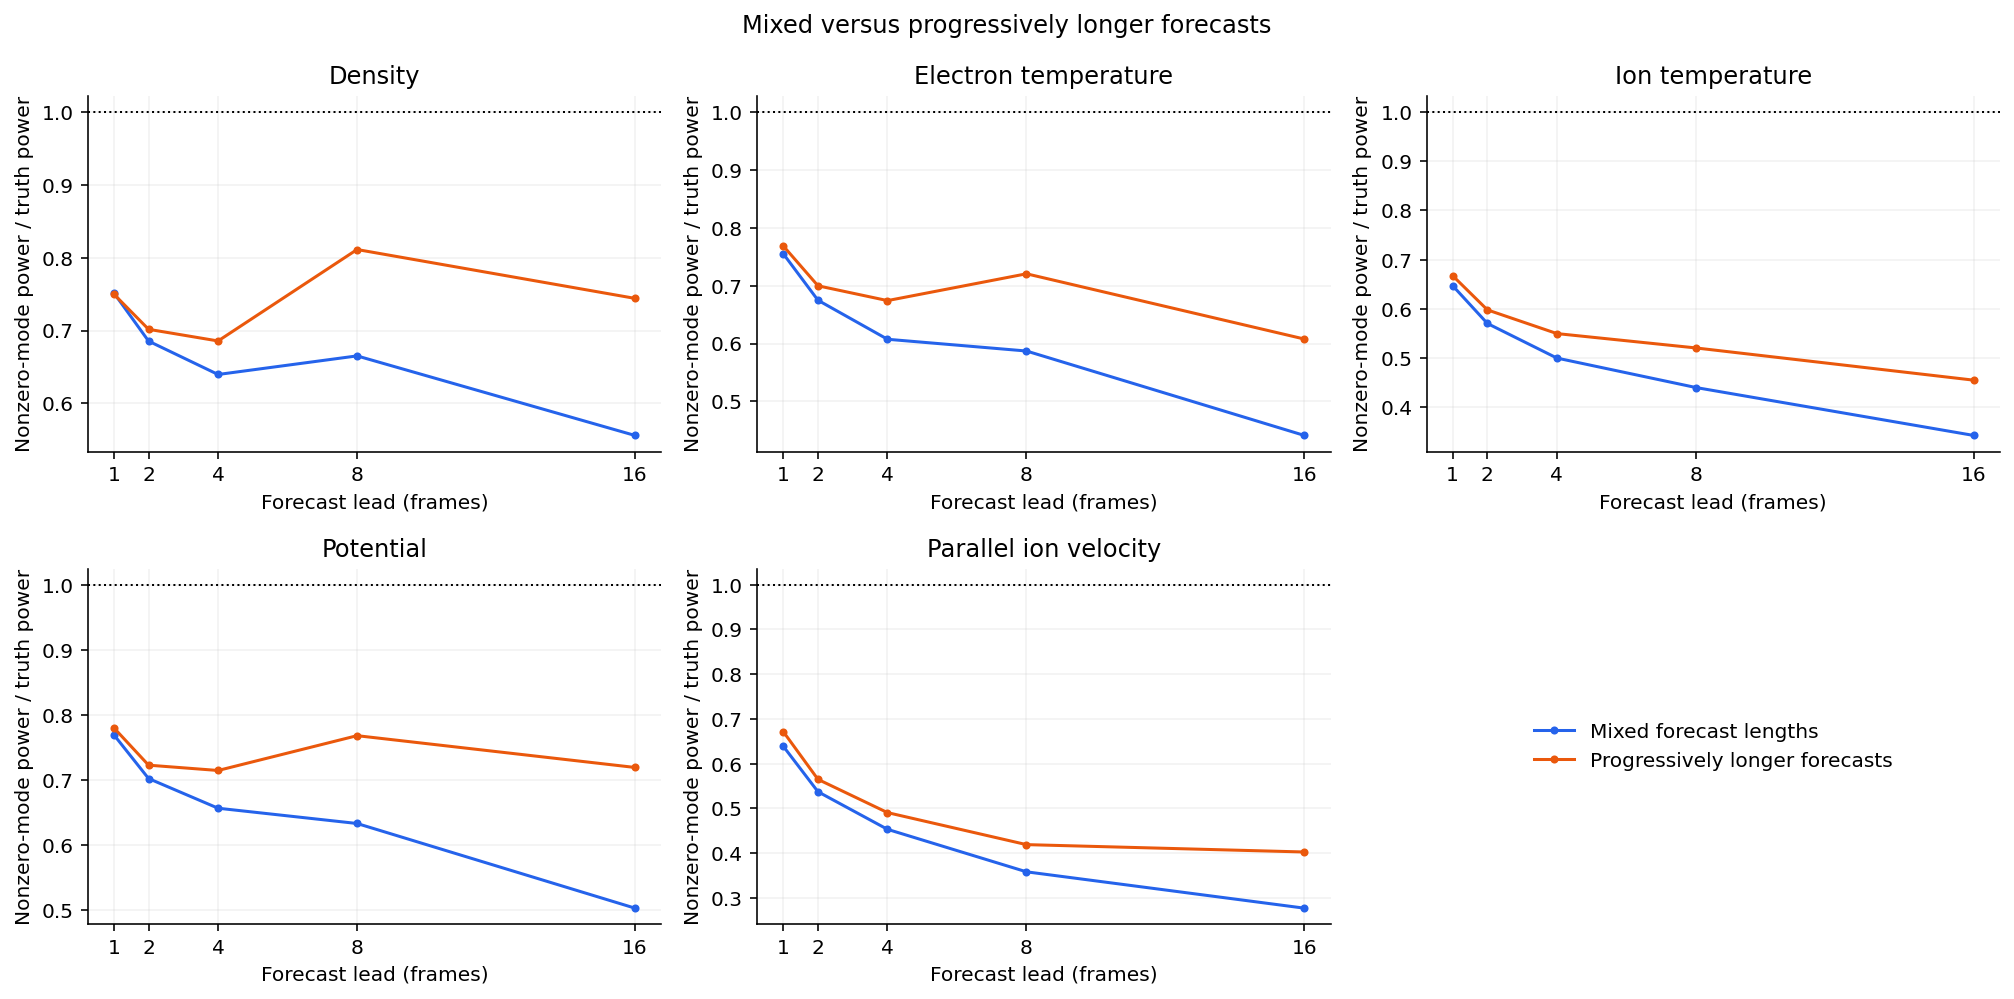
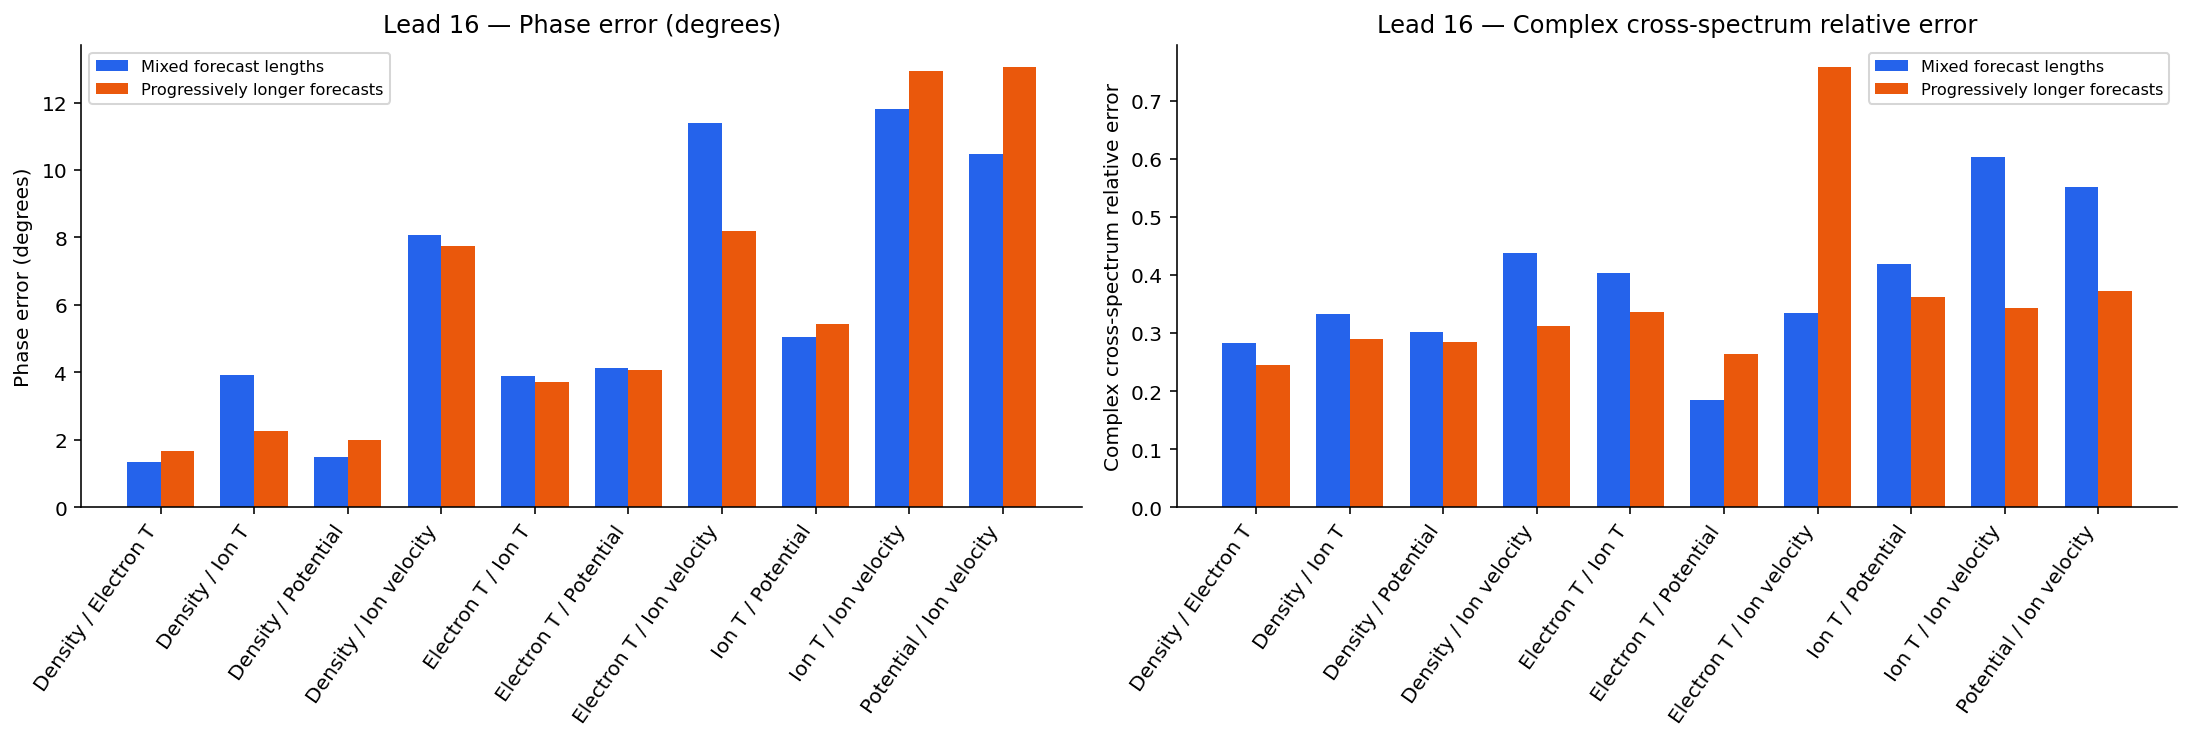
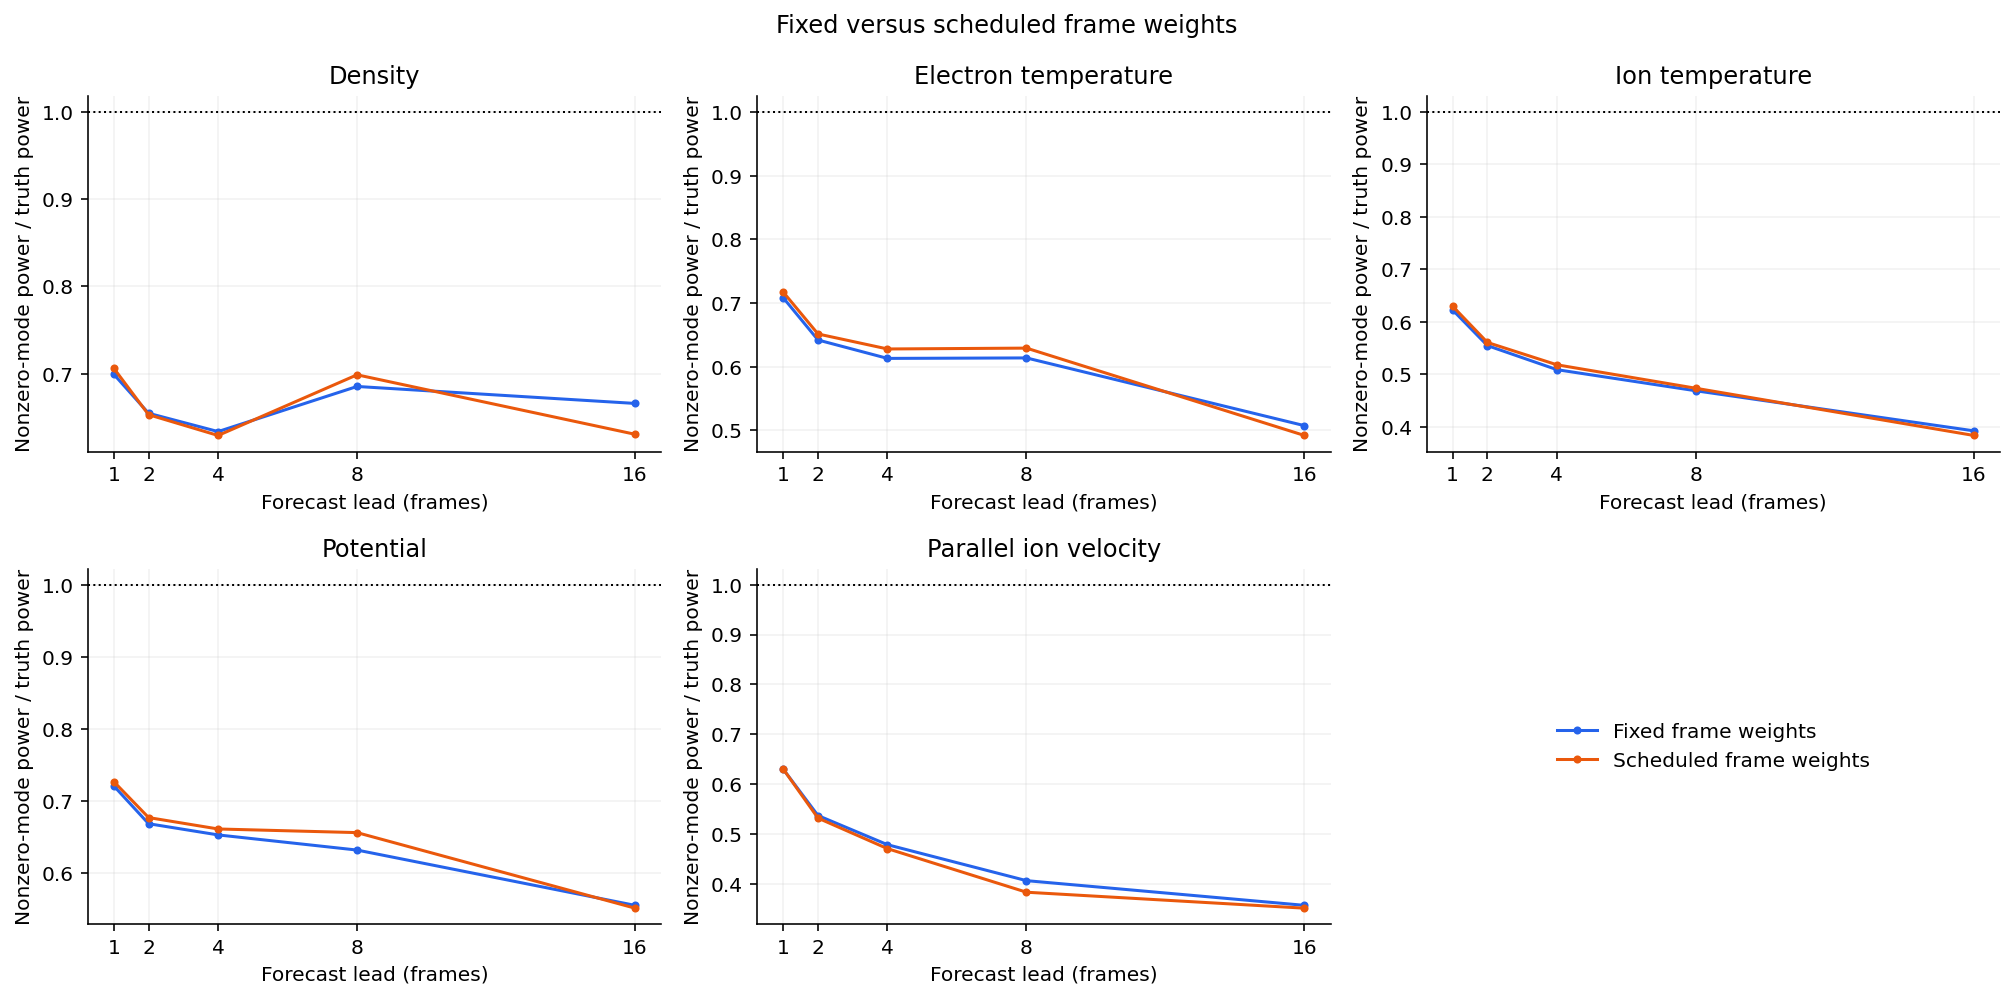
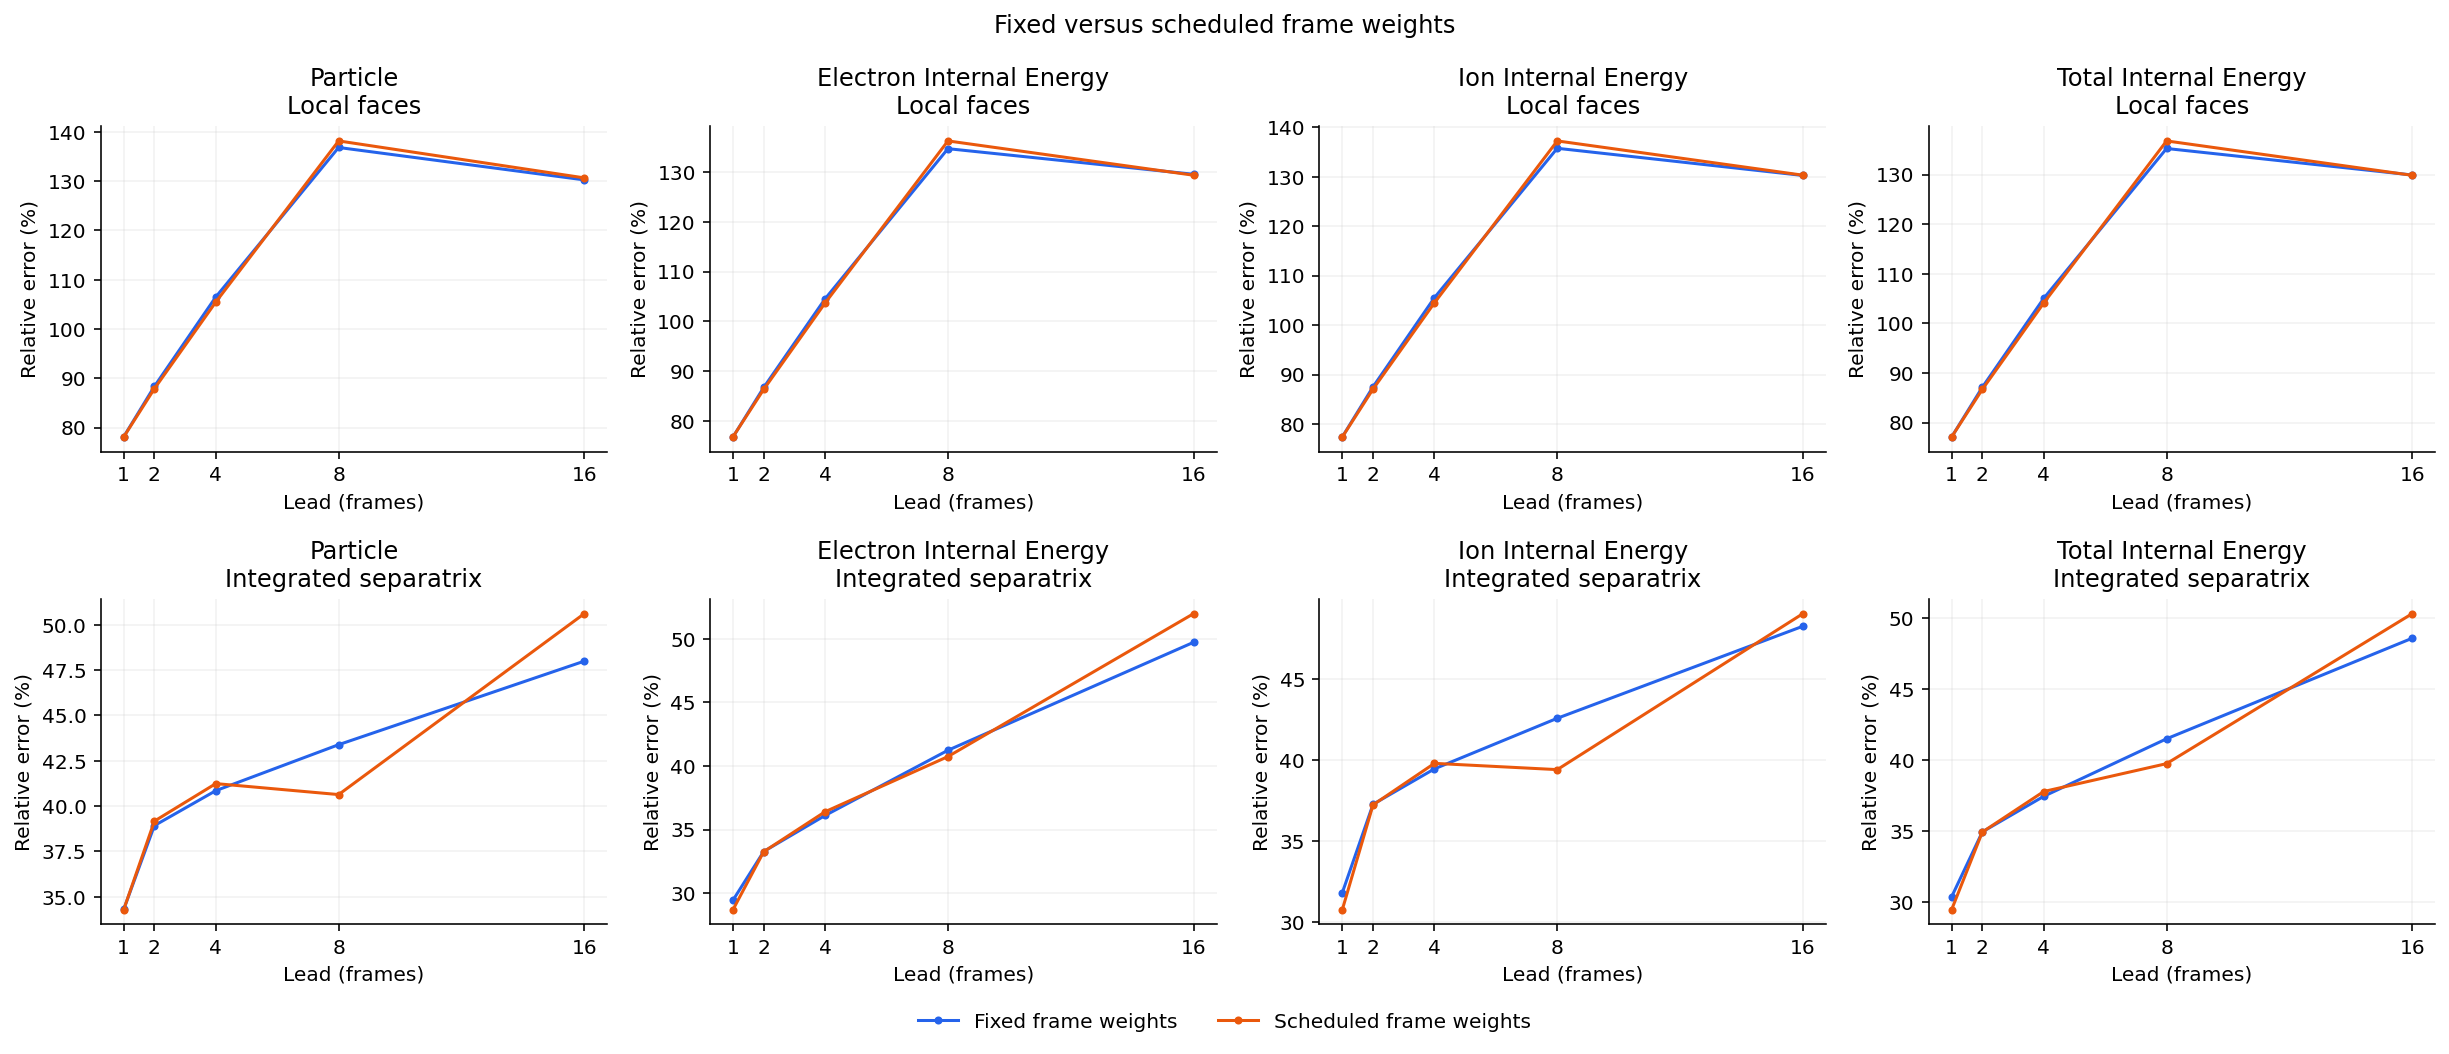
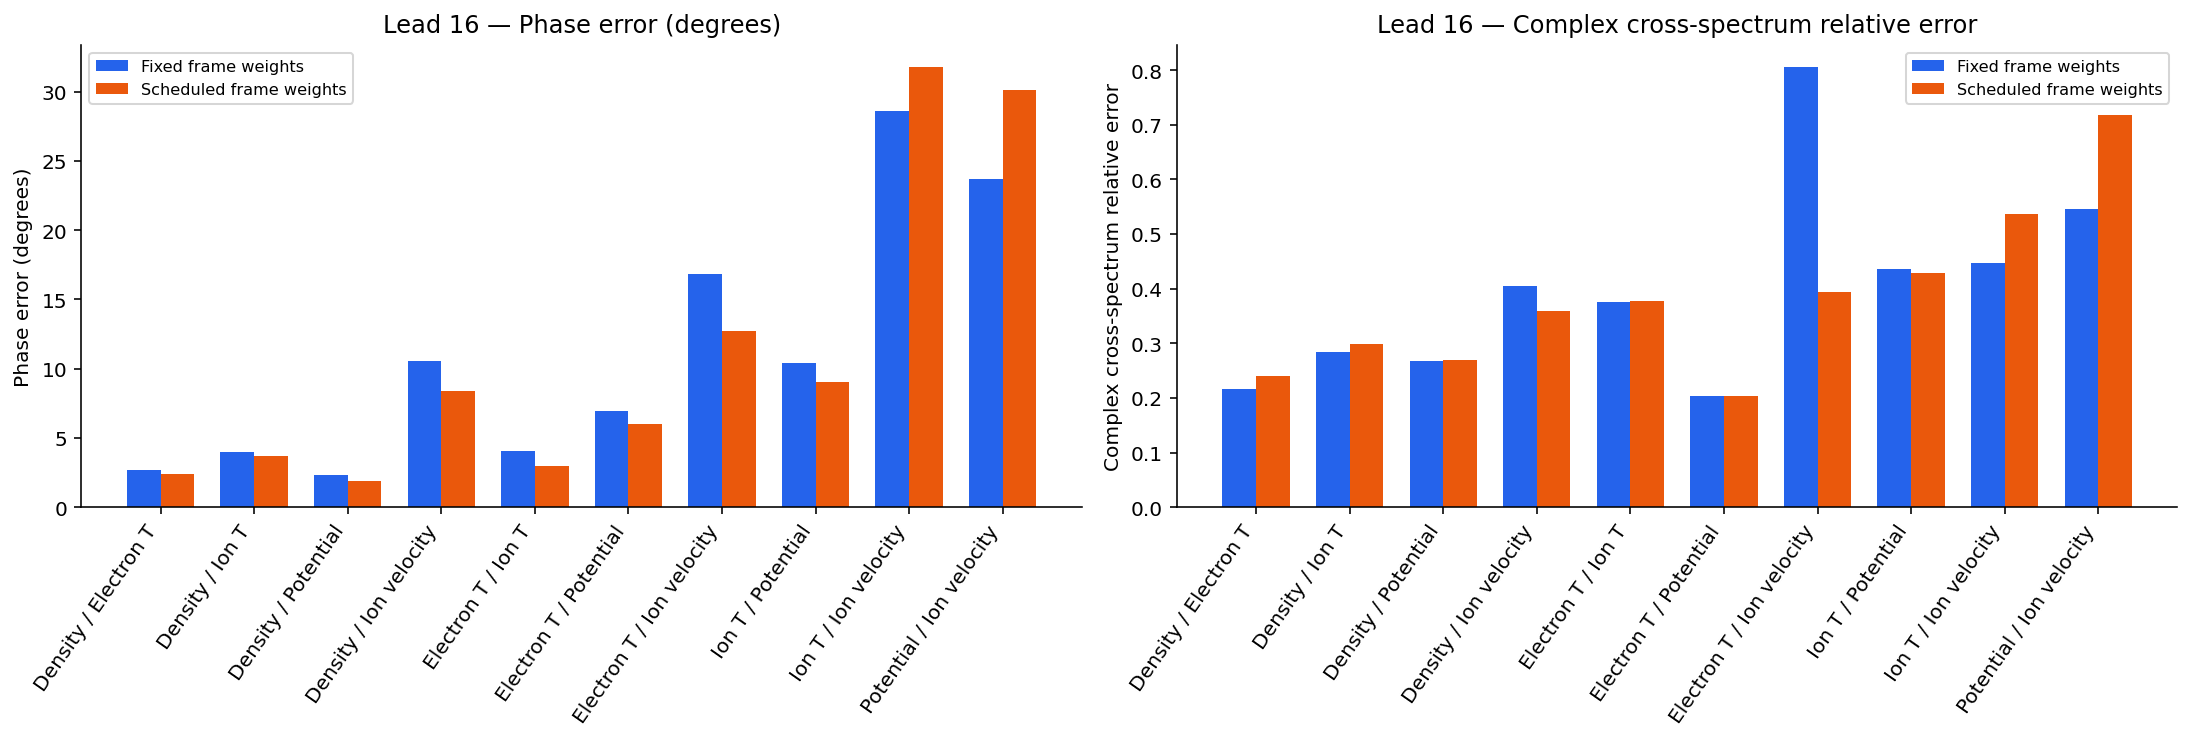
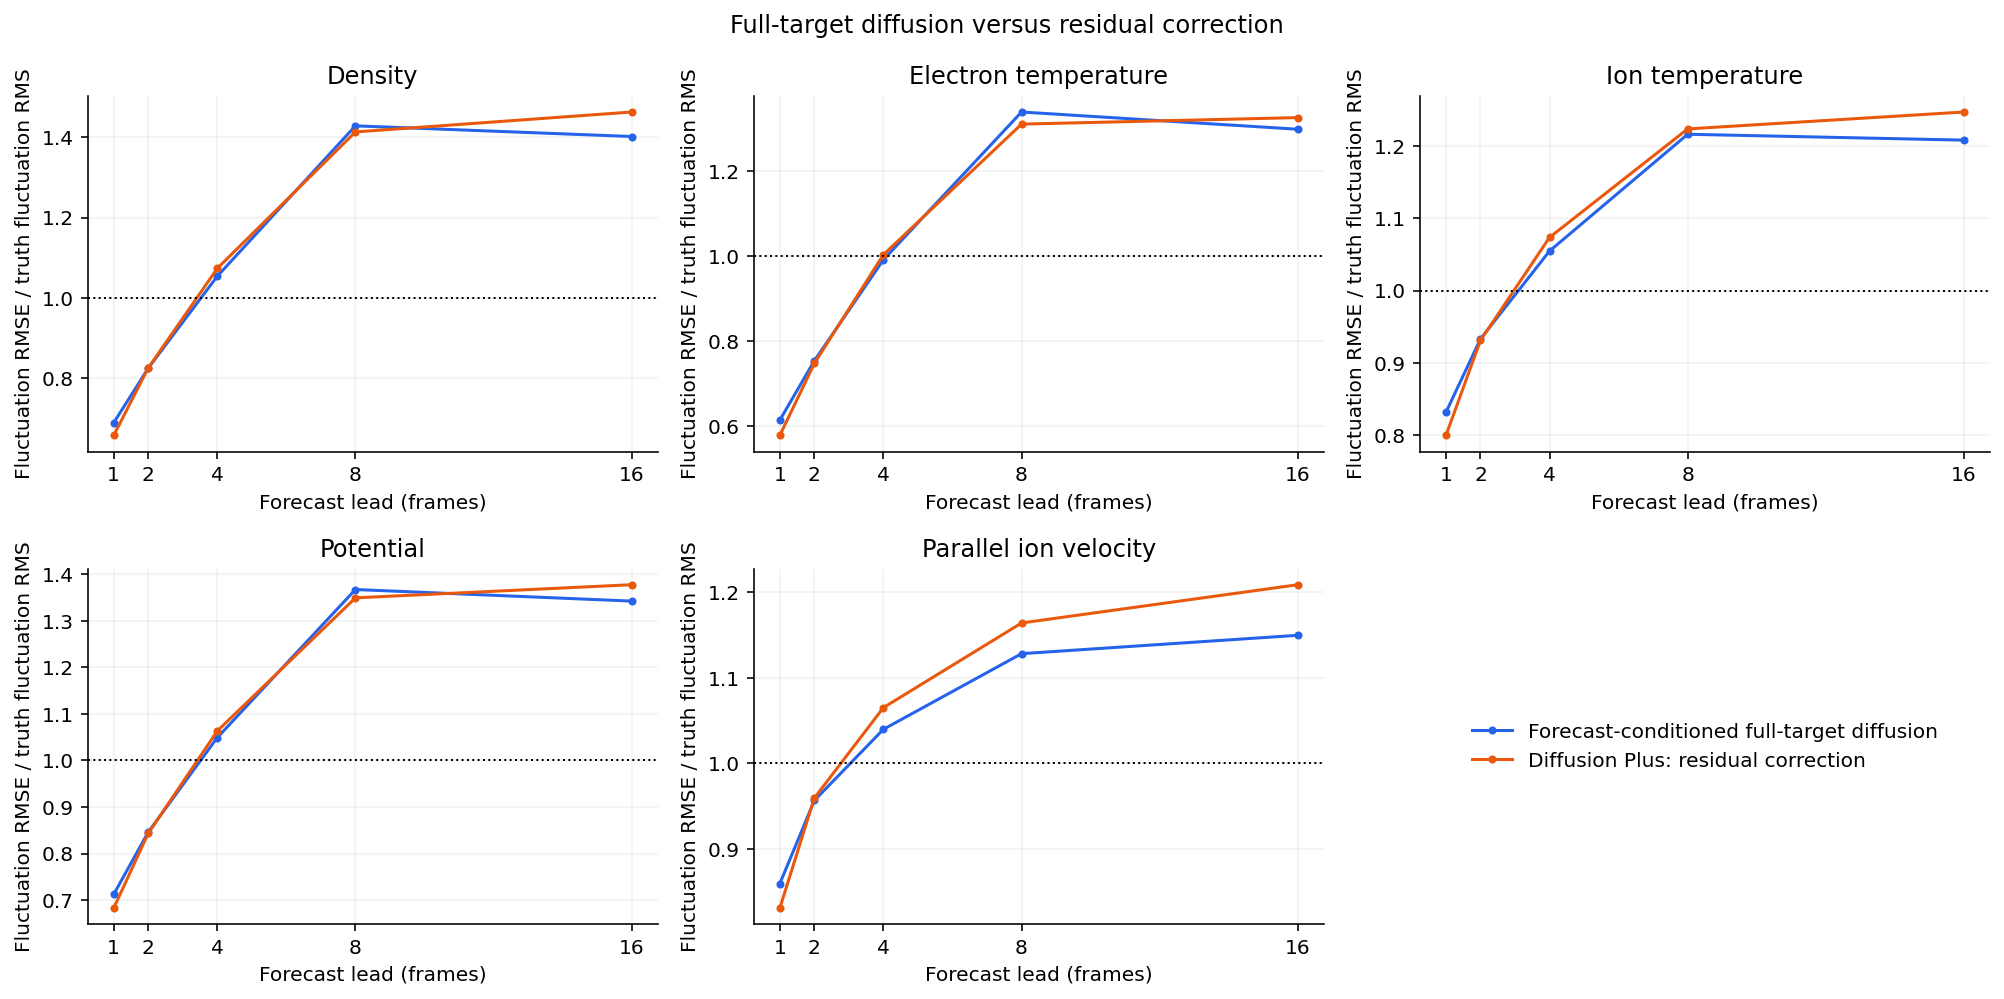
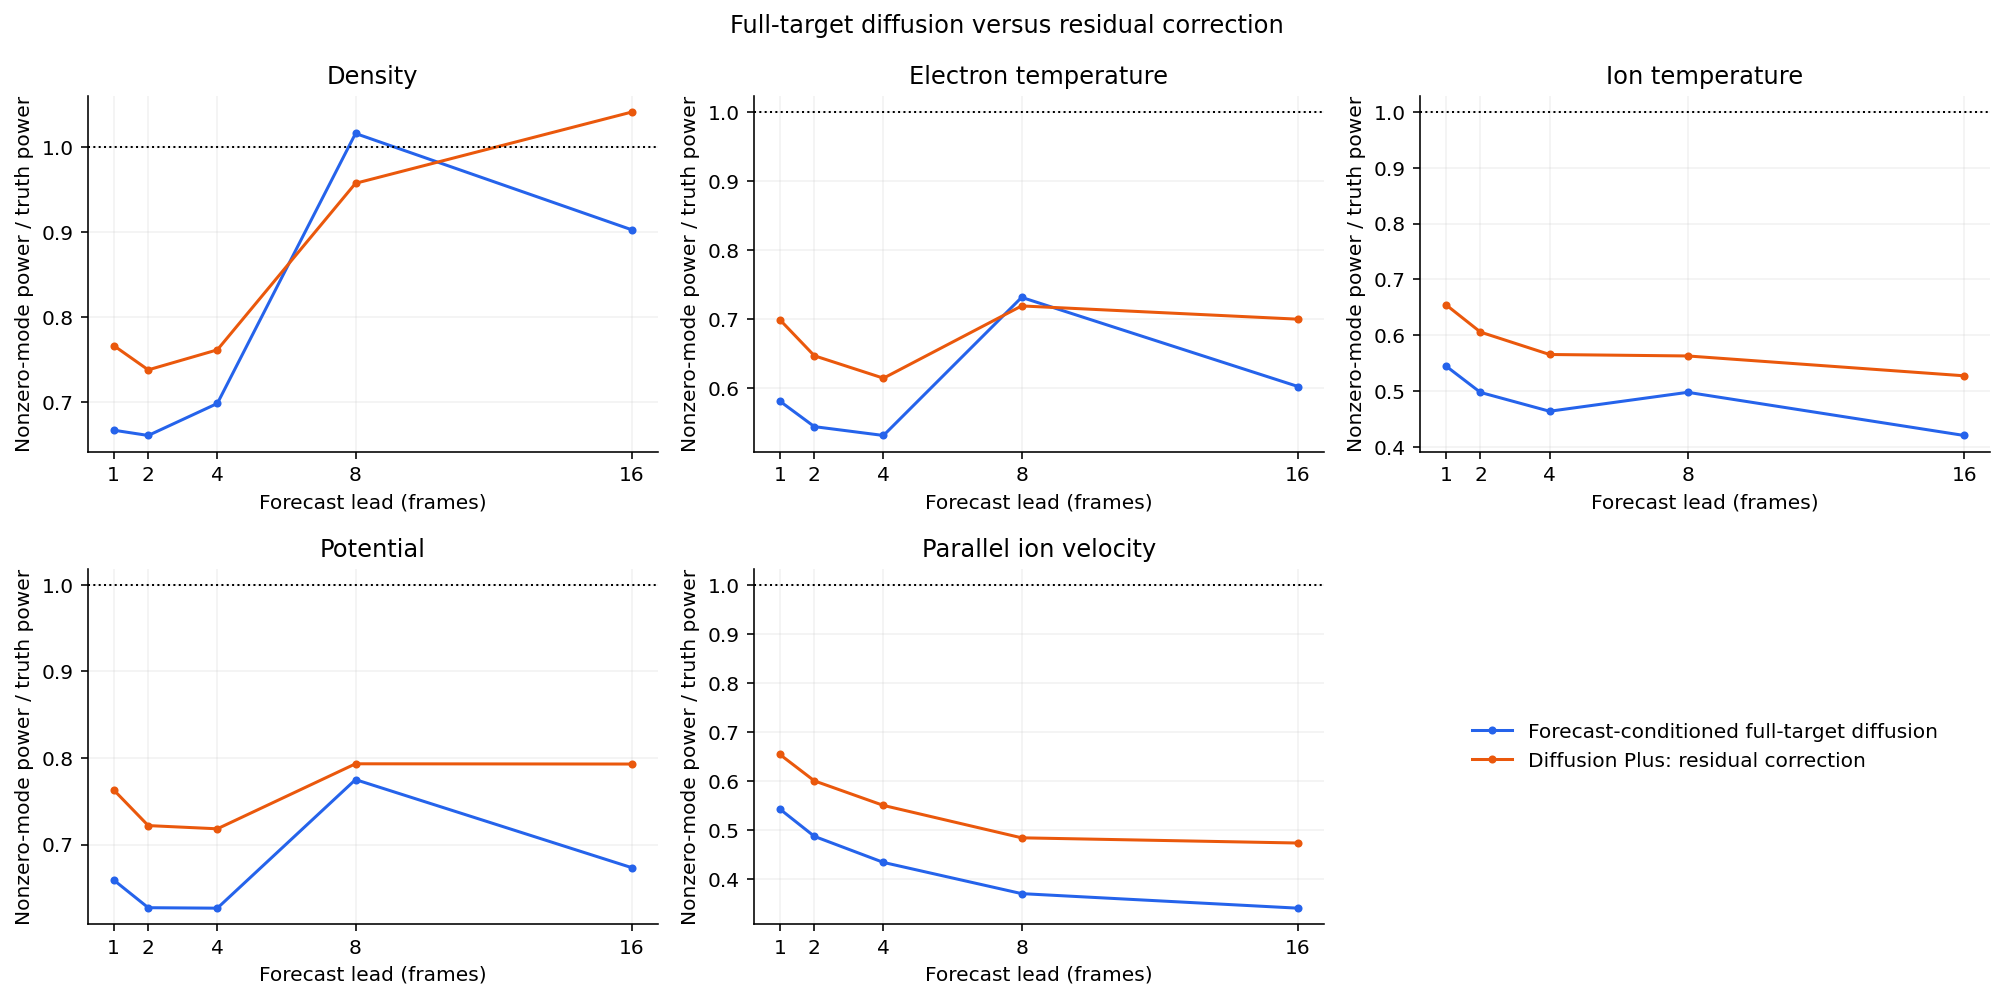
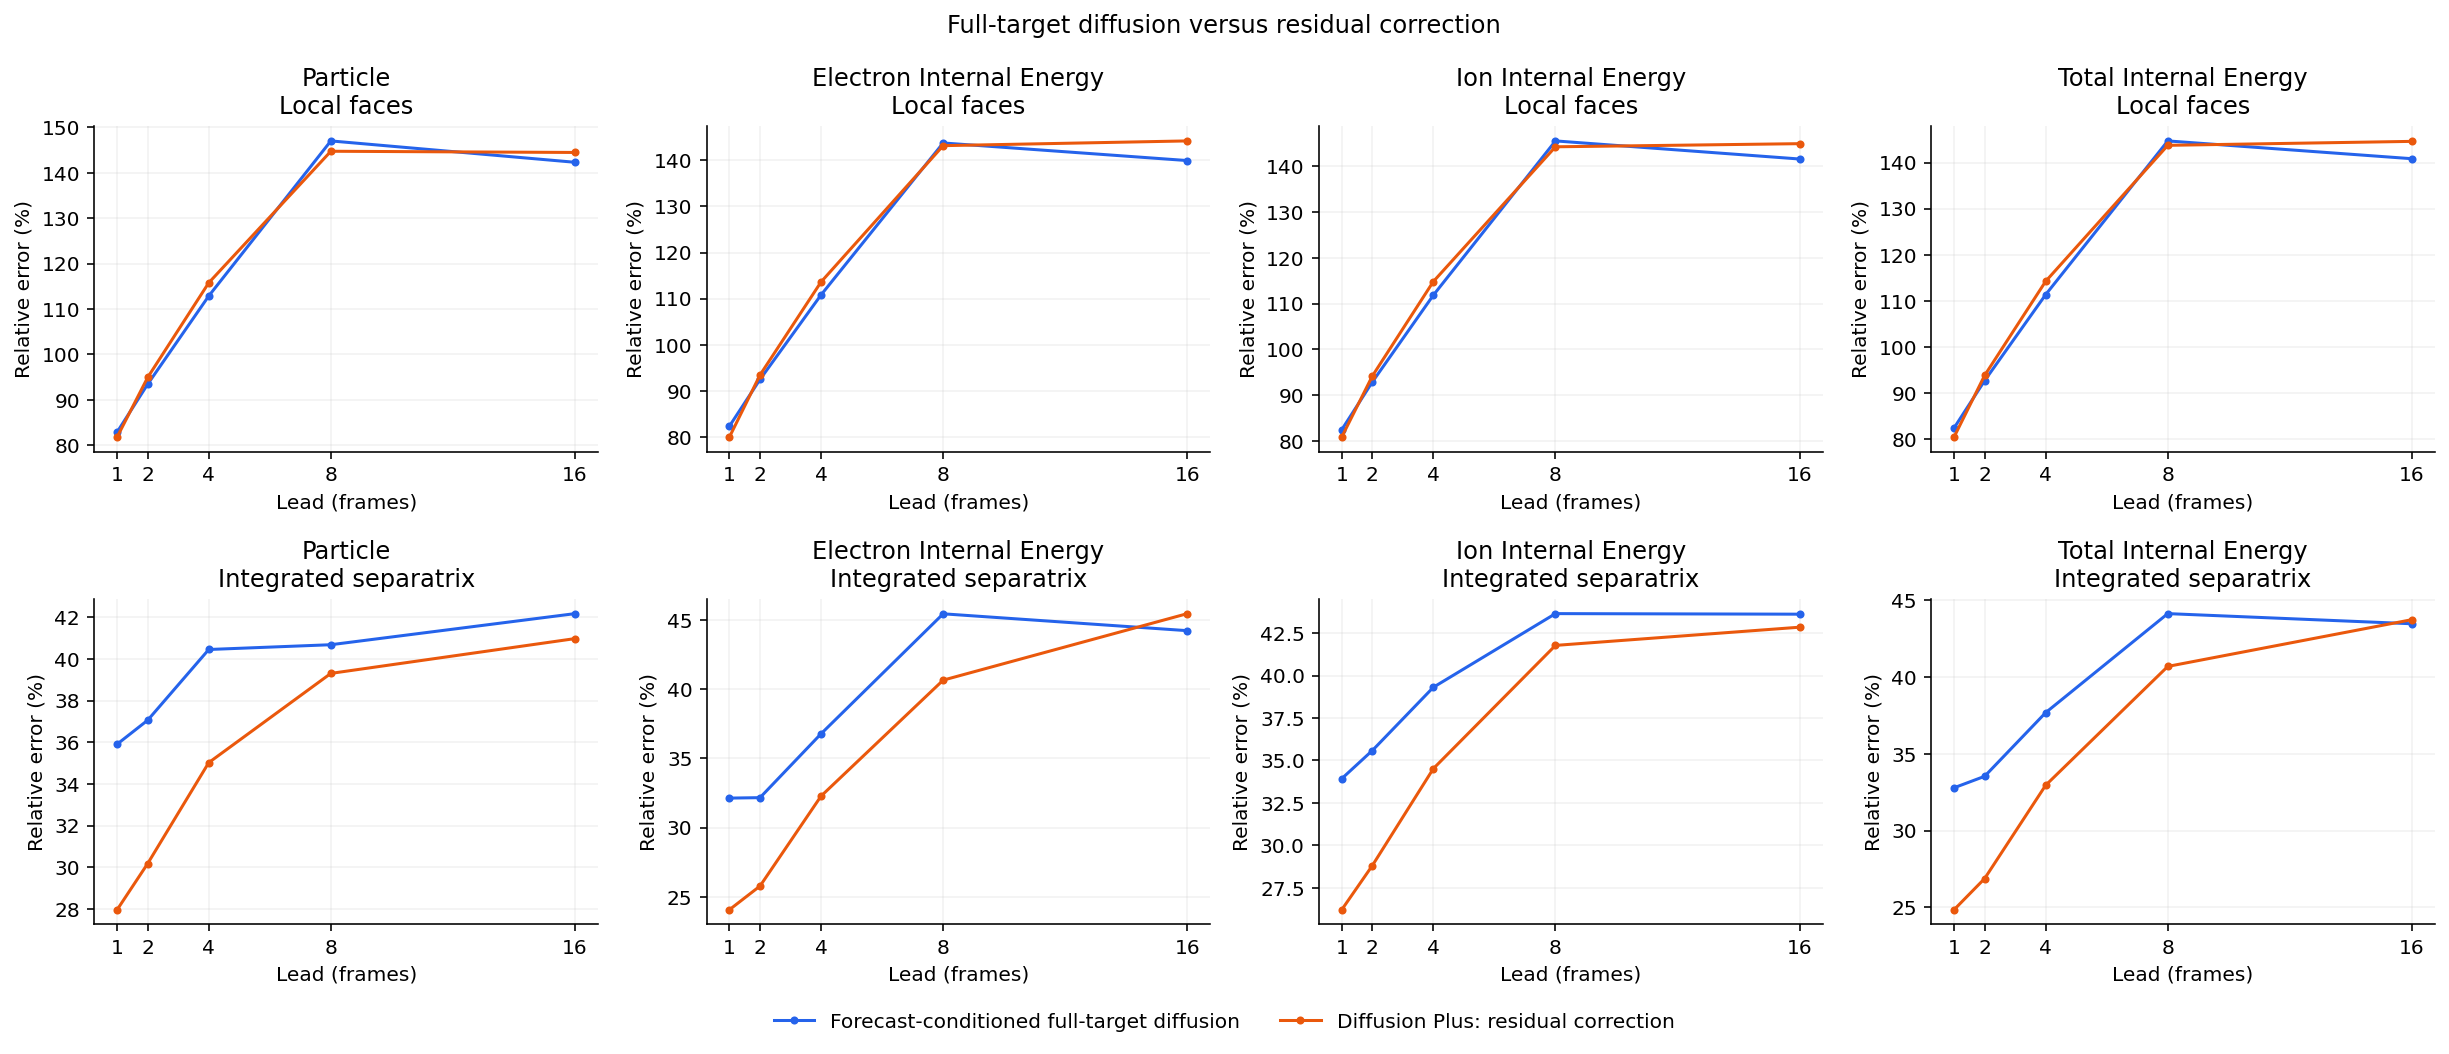
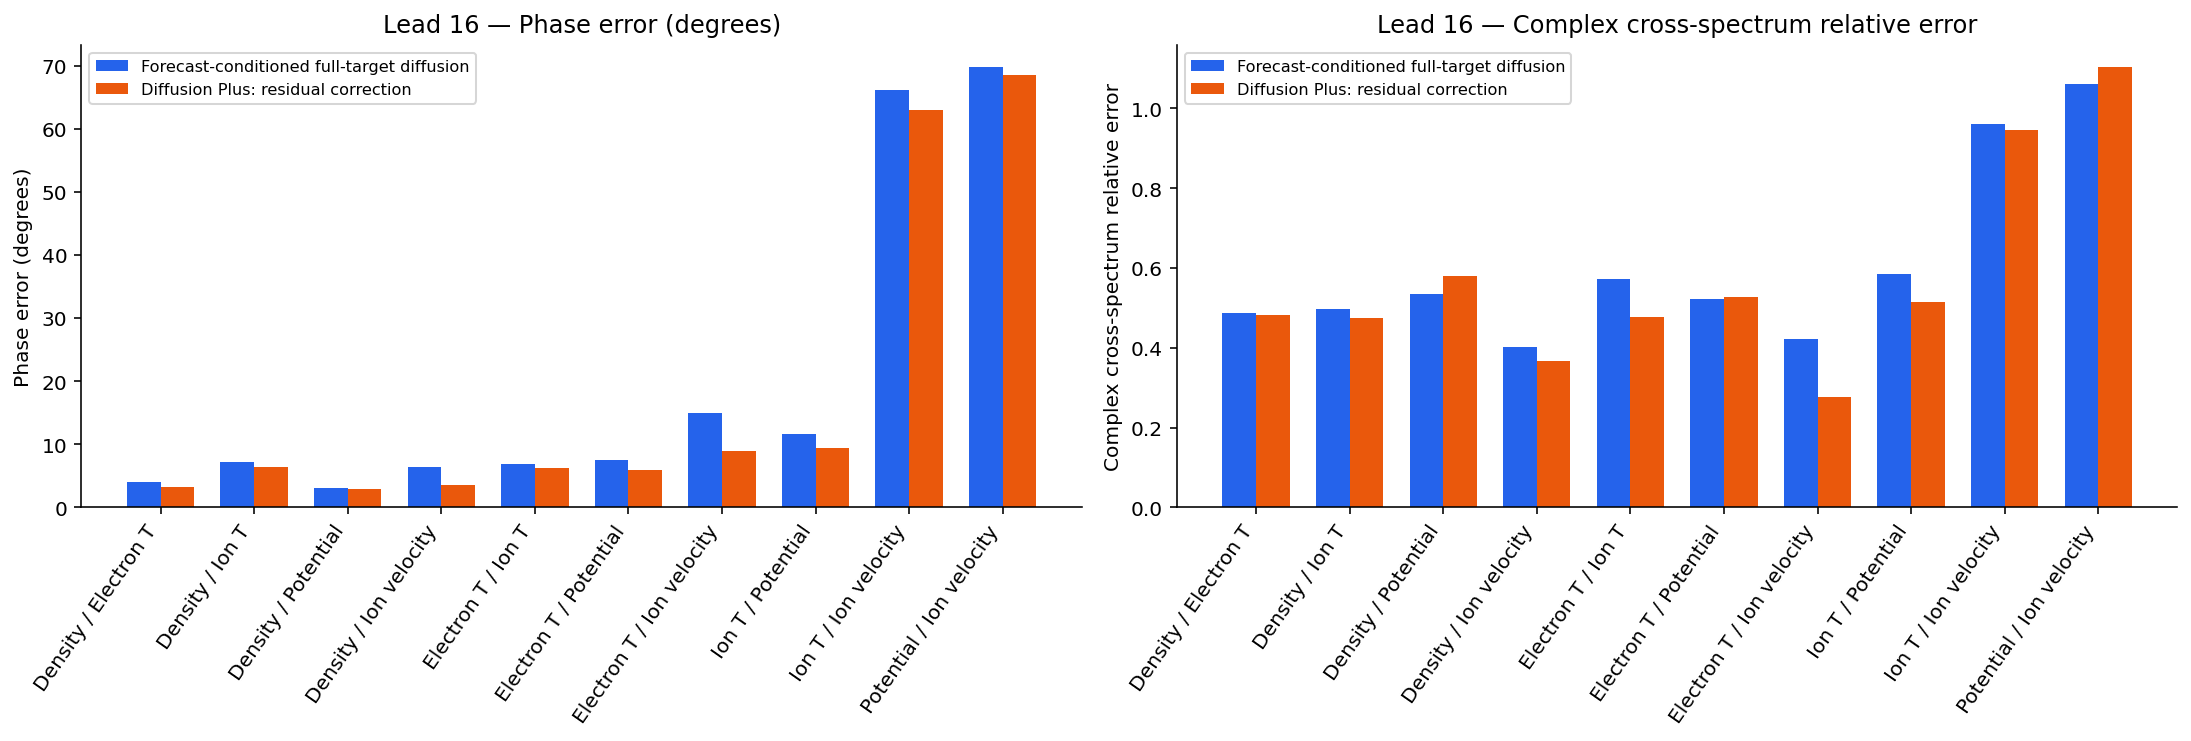
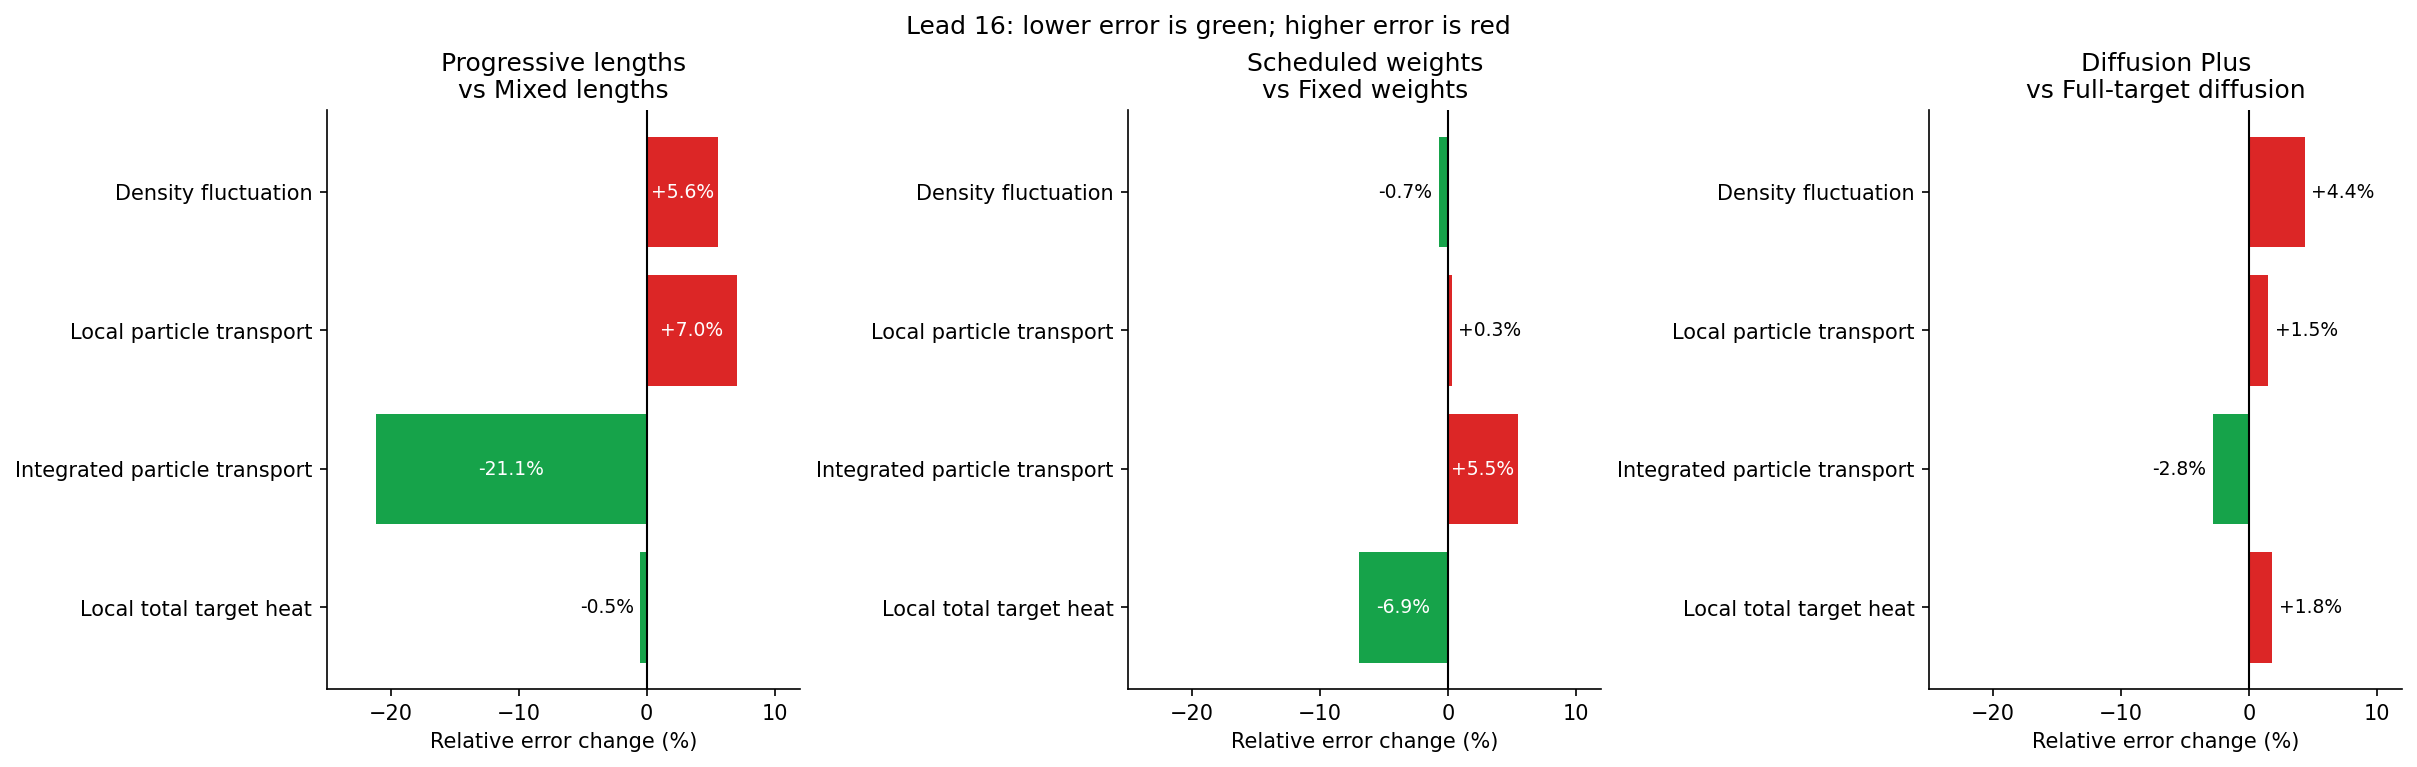
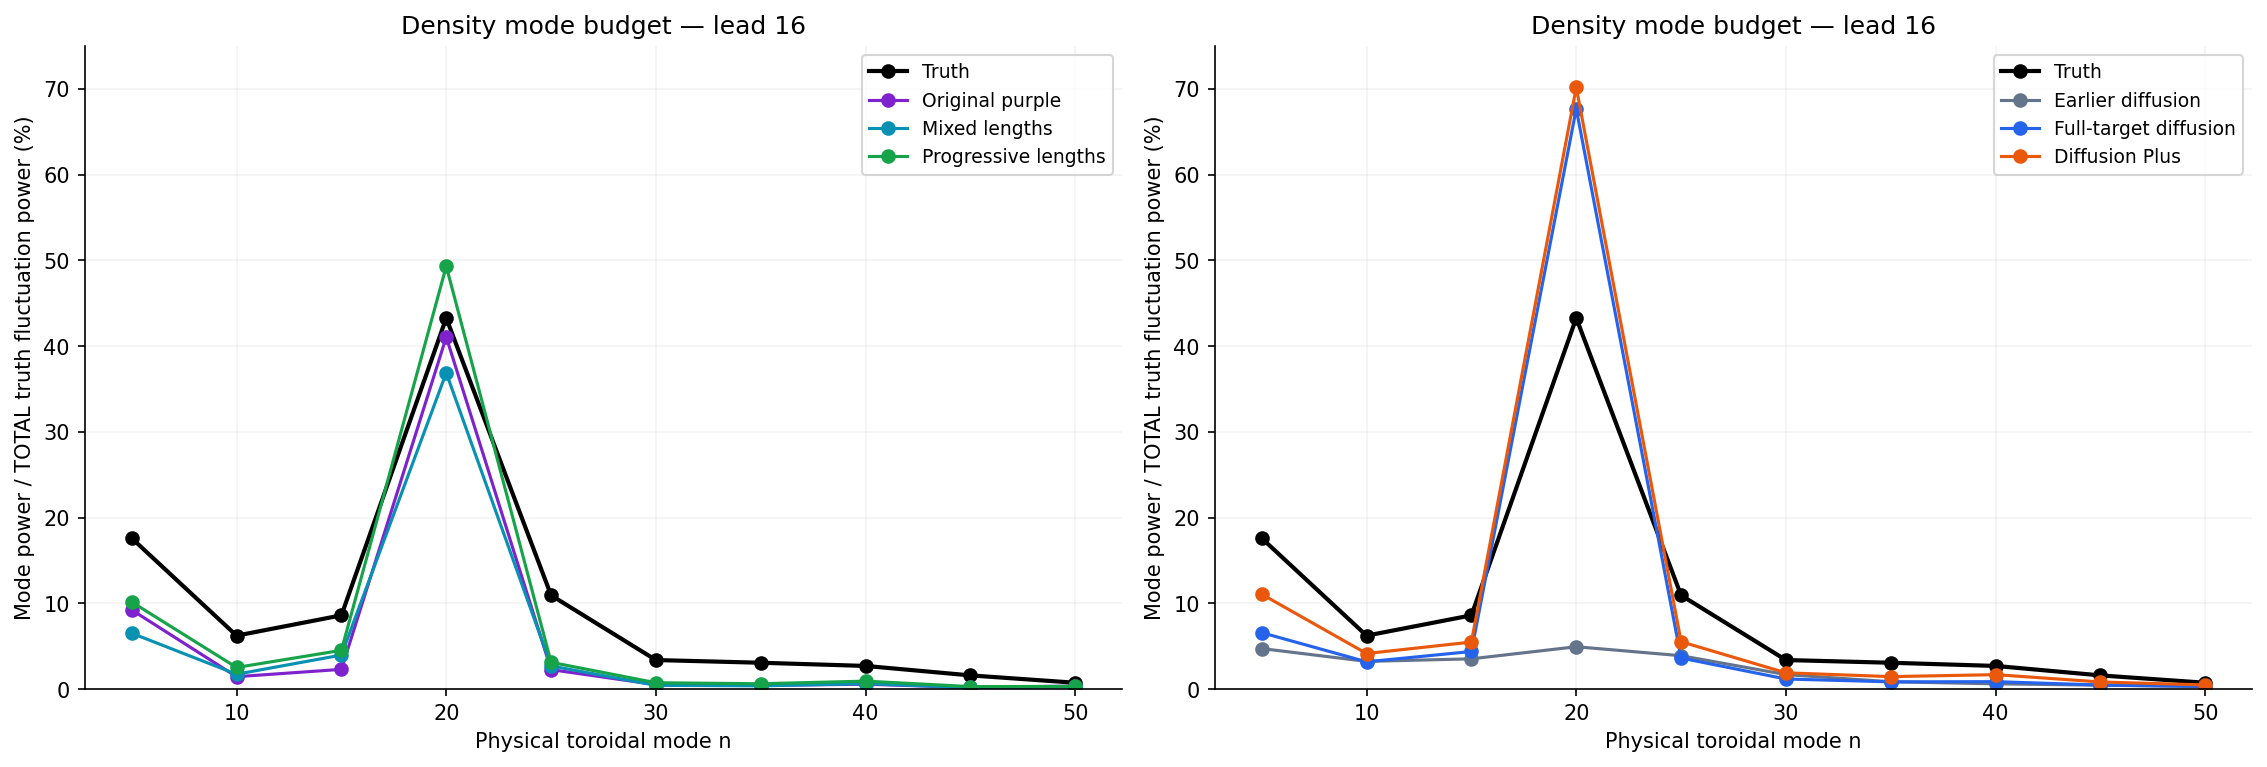
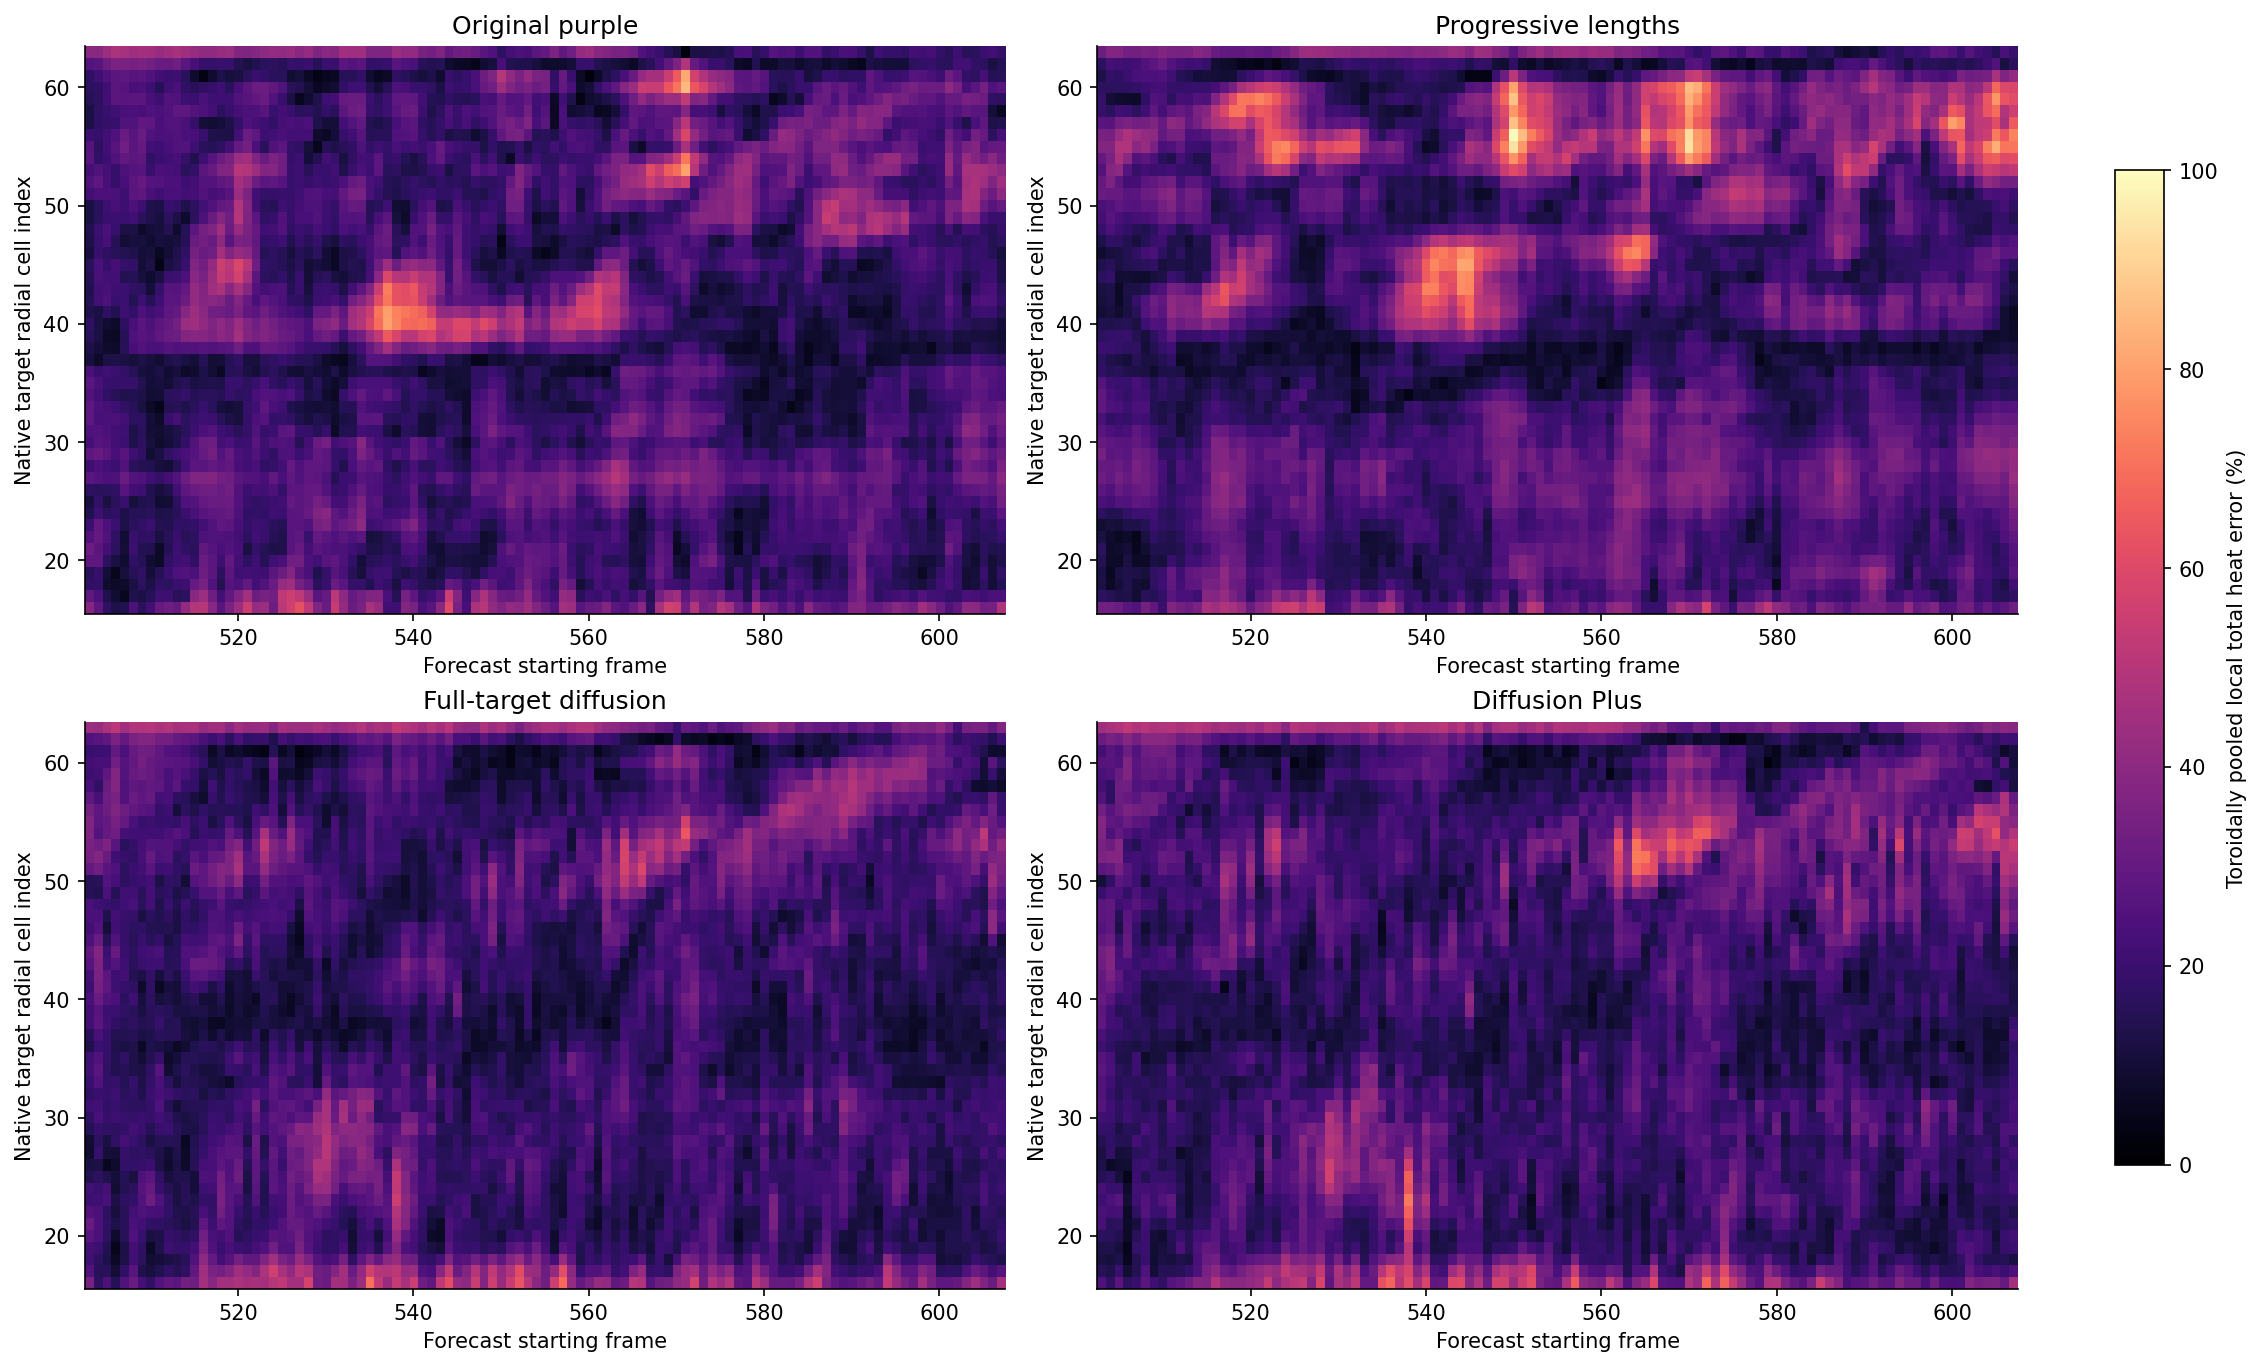
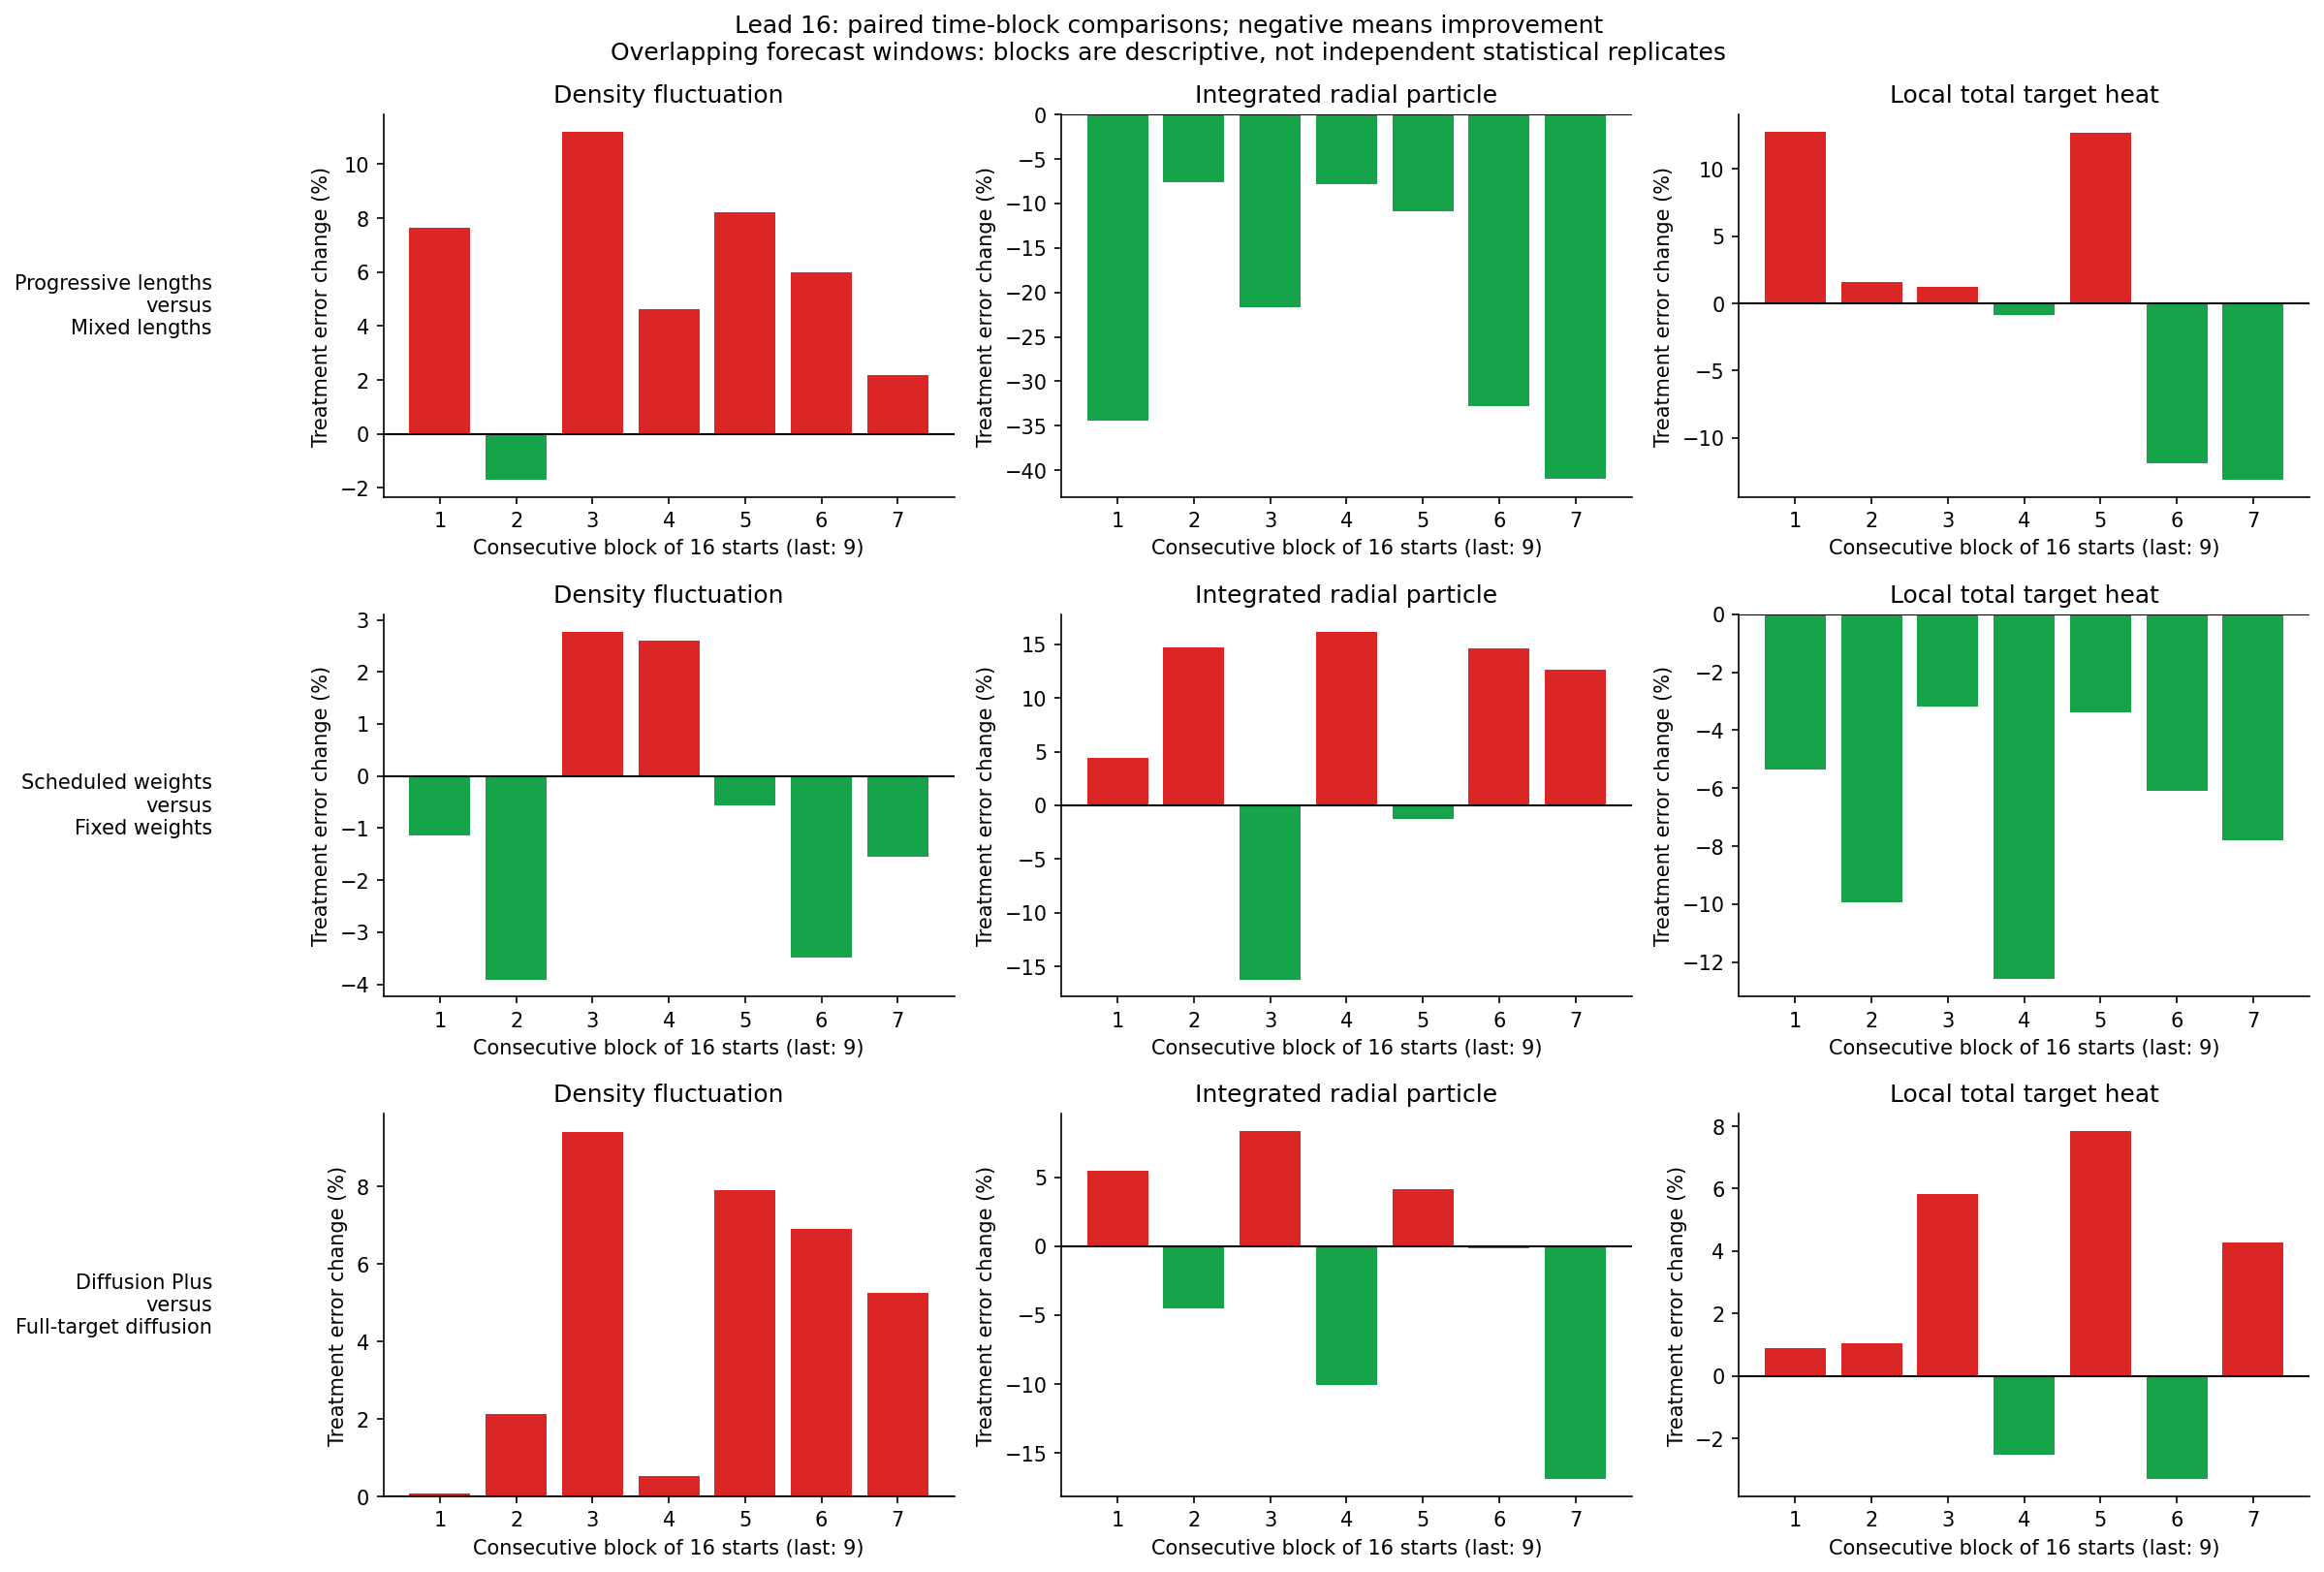
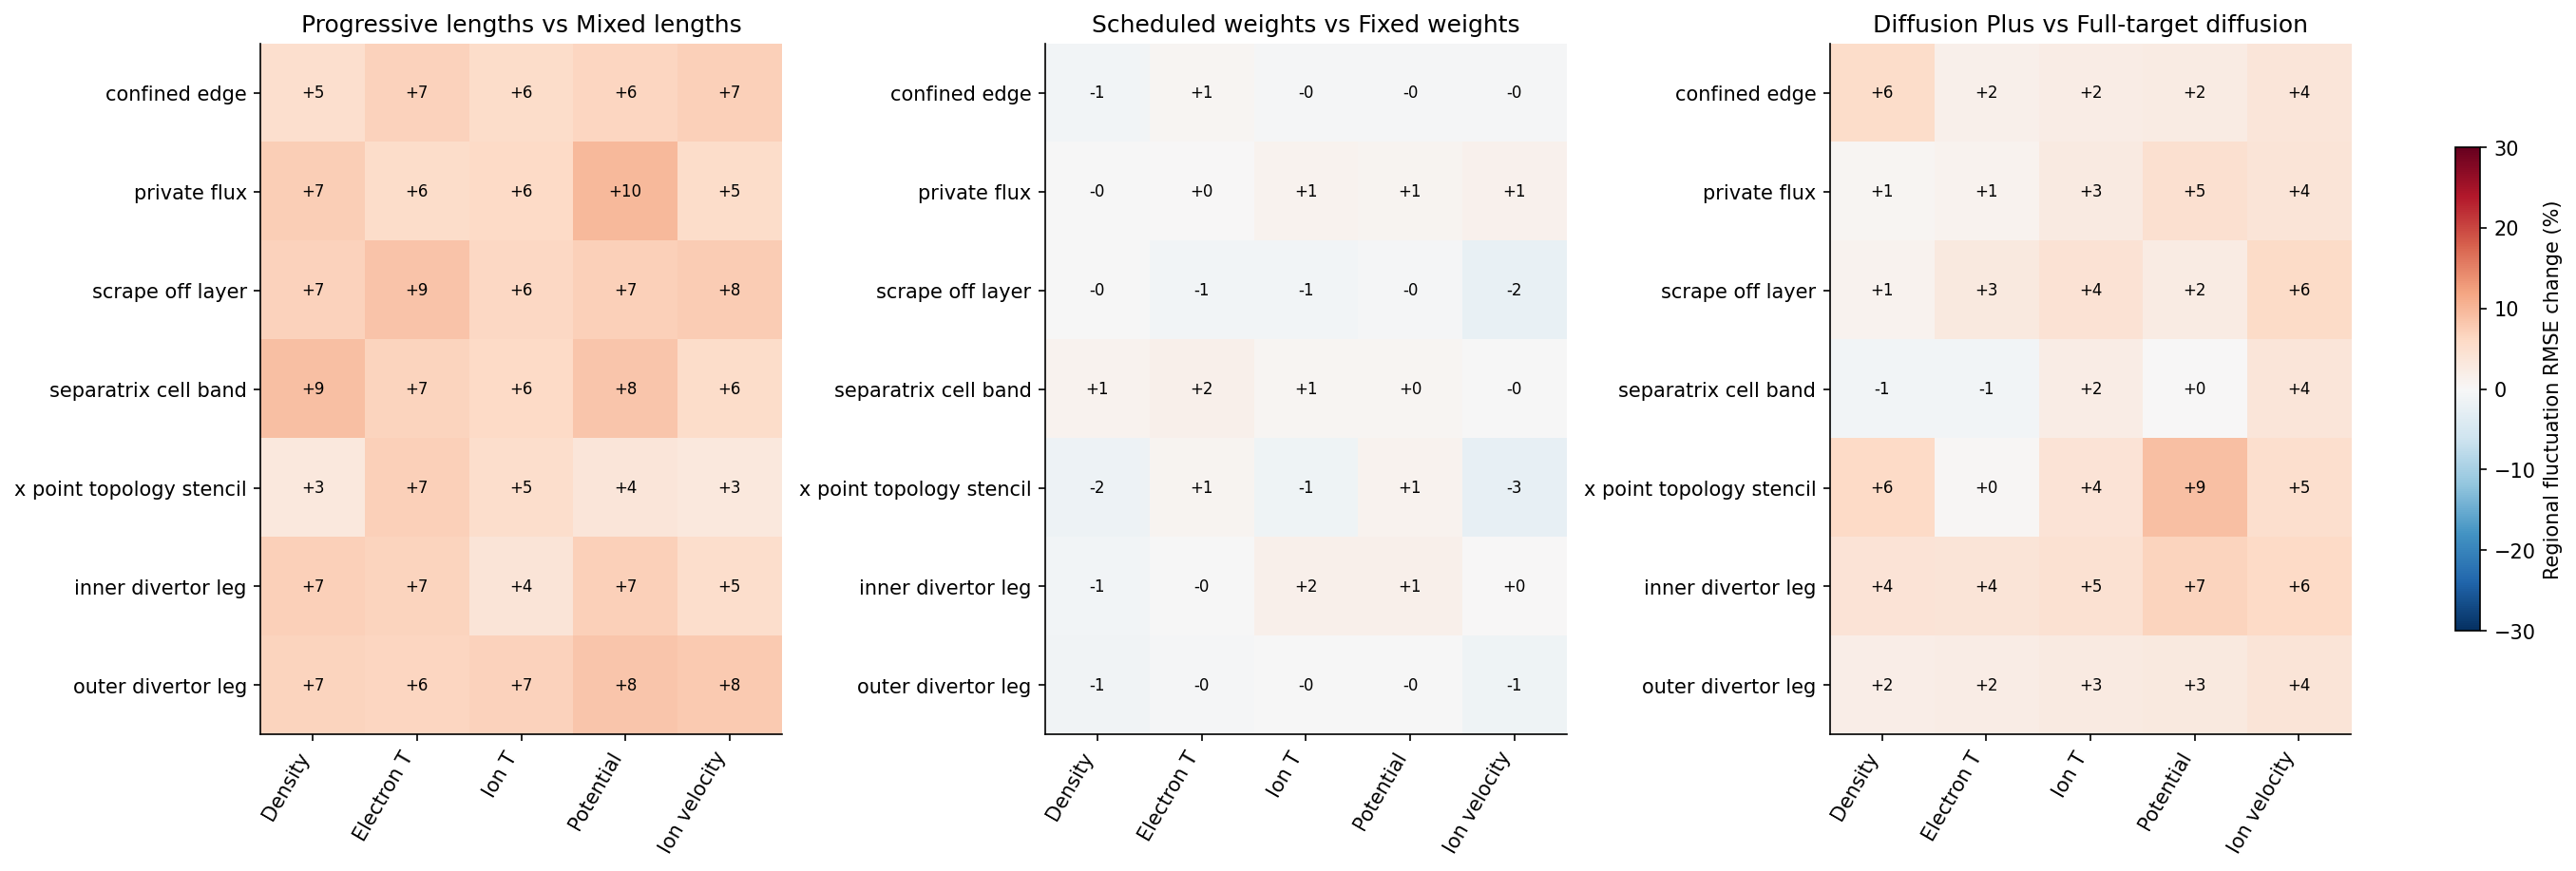
The later diffusion recipes retained more turbulent power. That did not guarantee correct phase, trajectories or every transport metric.
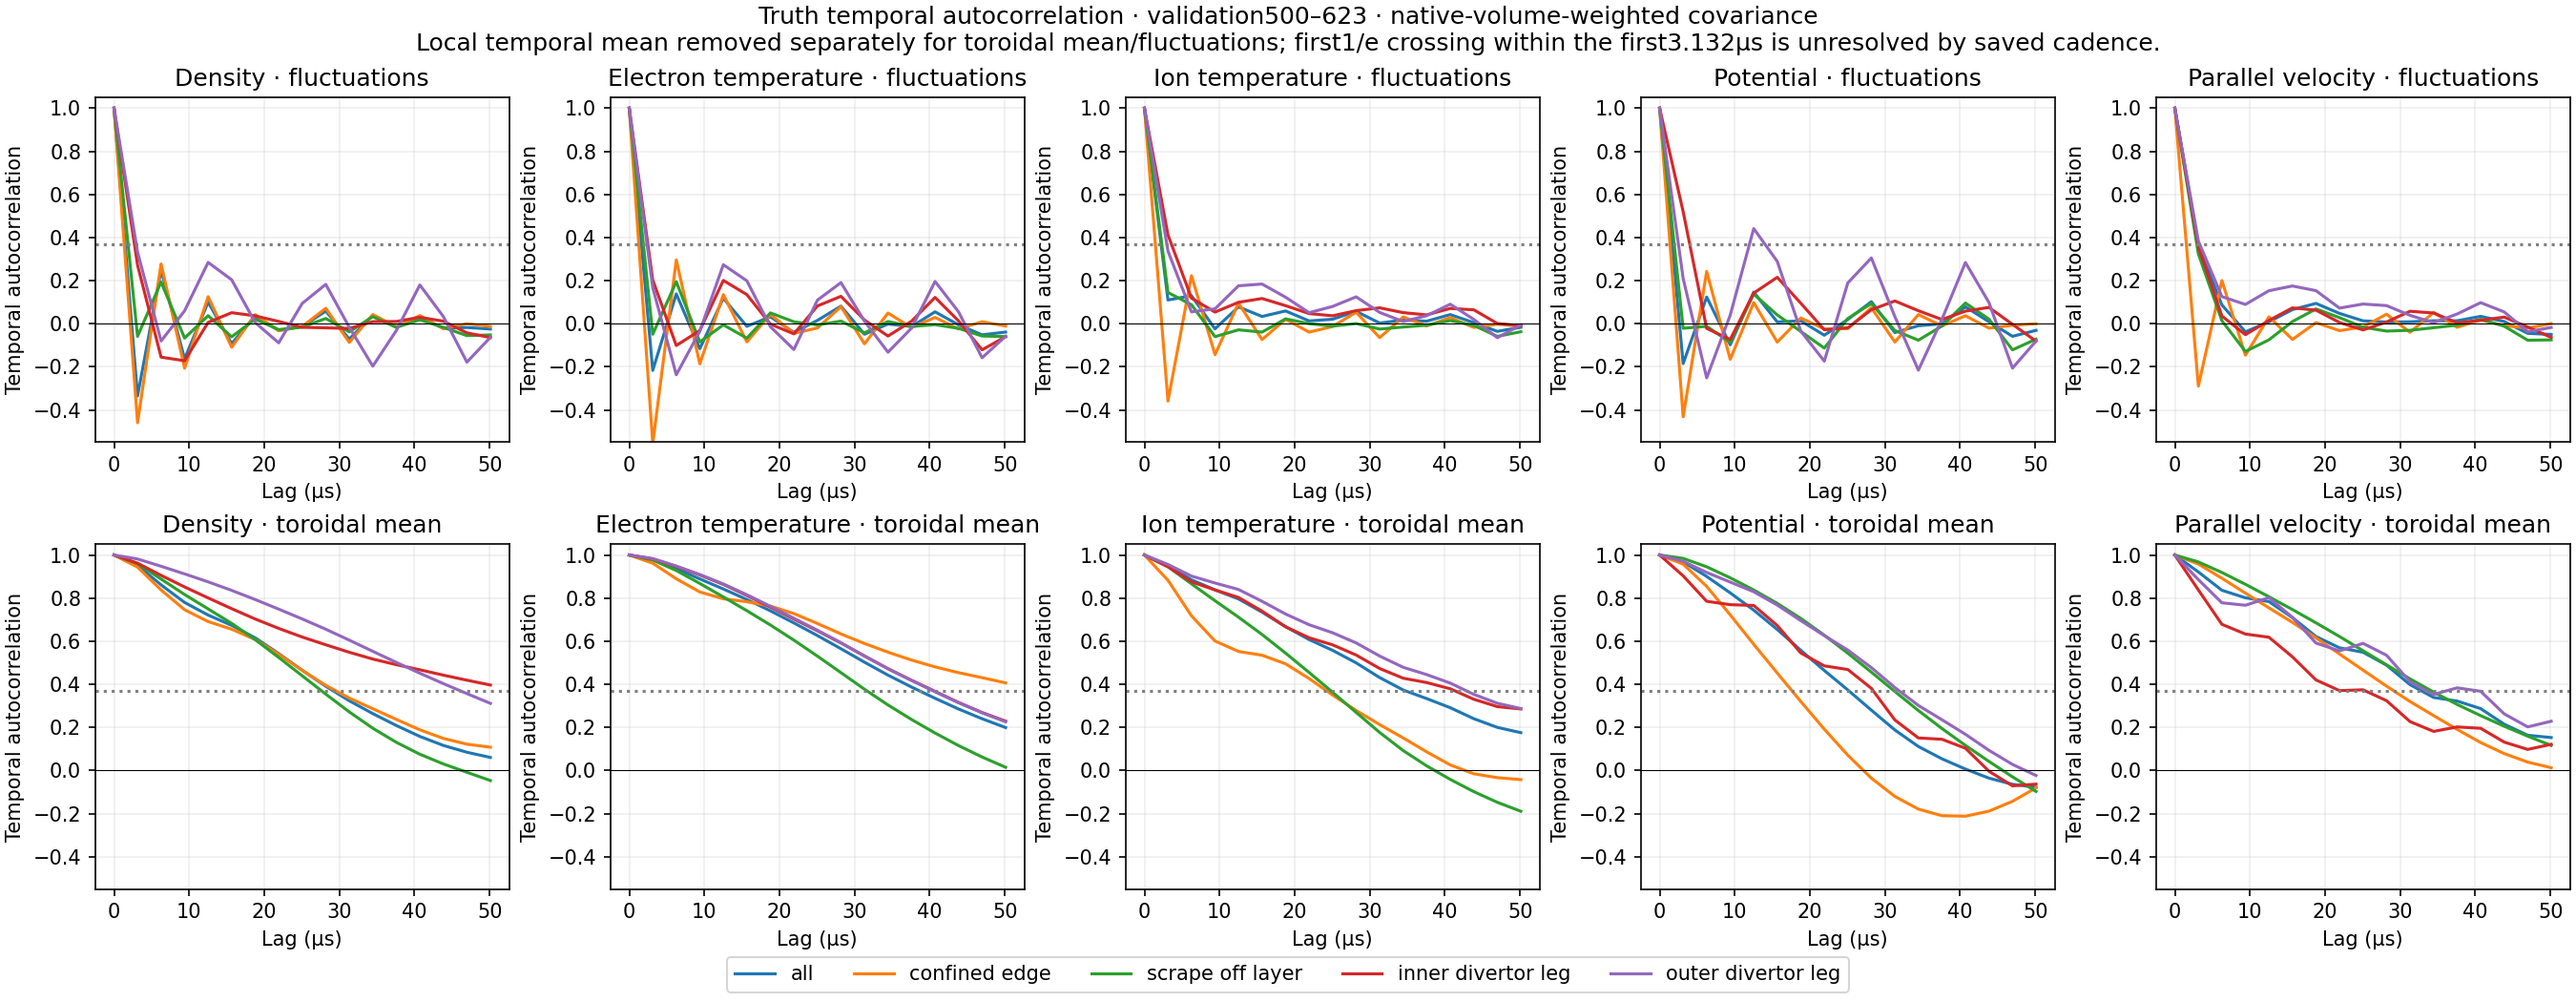
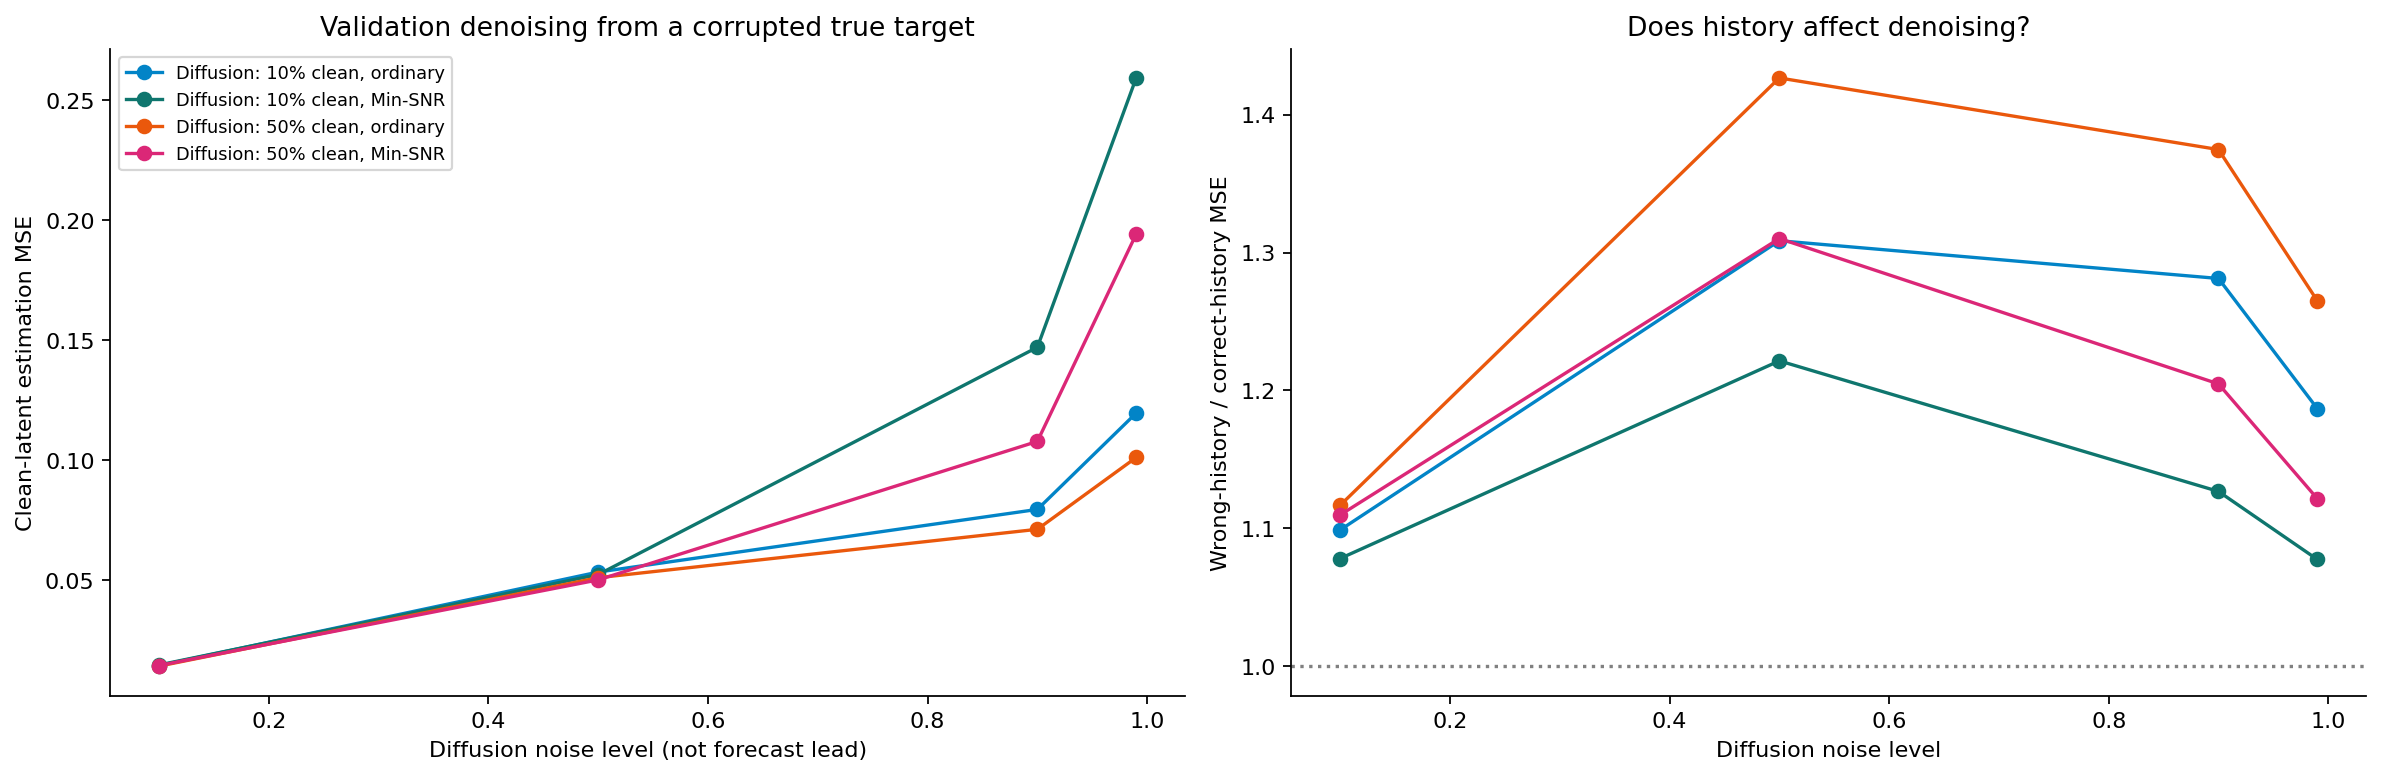
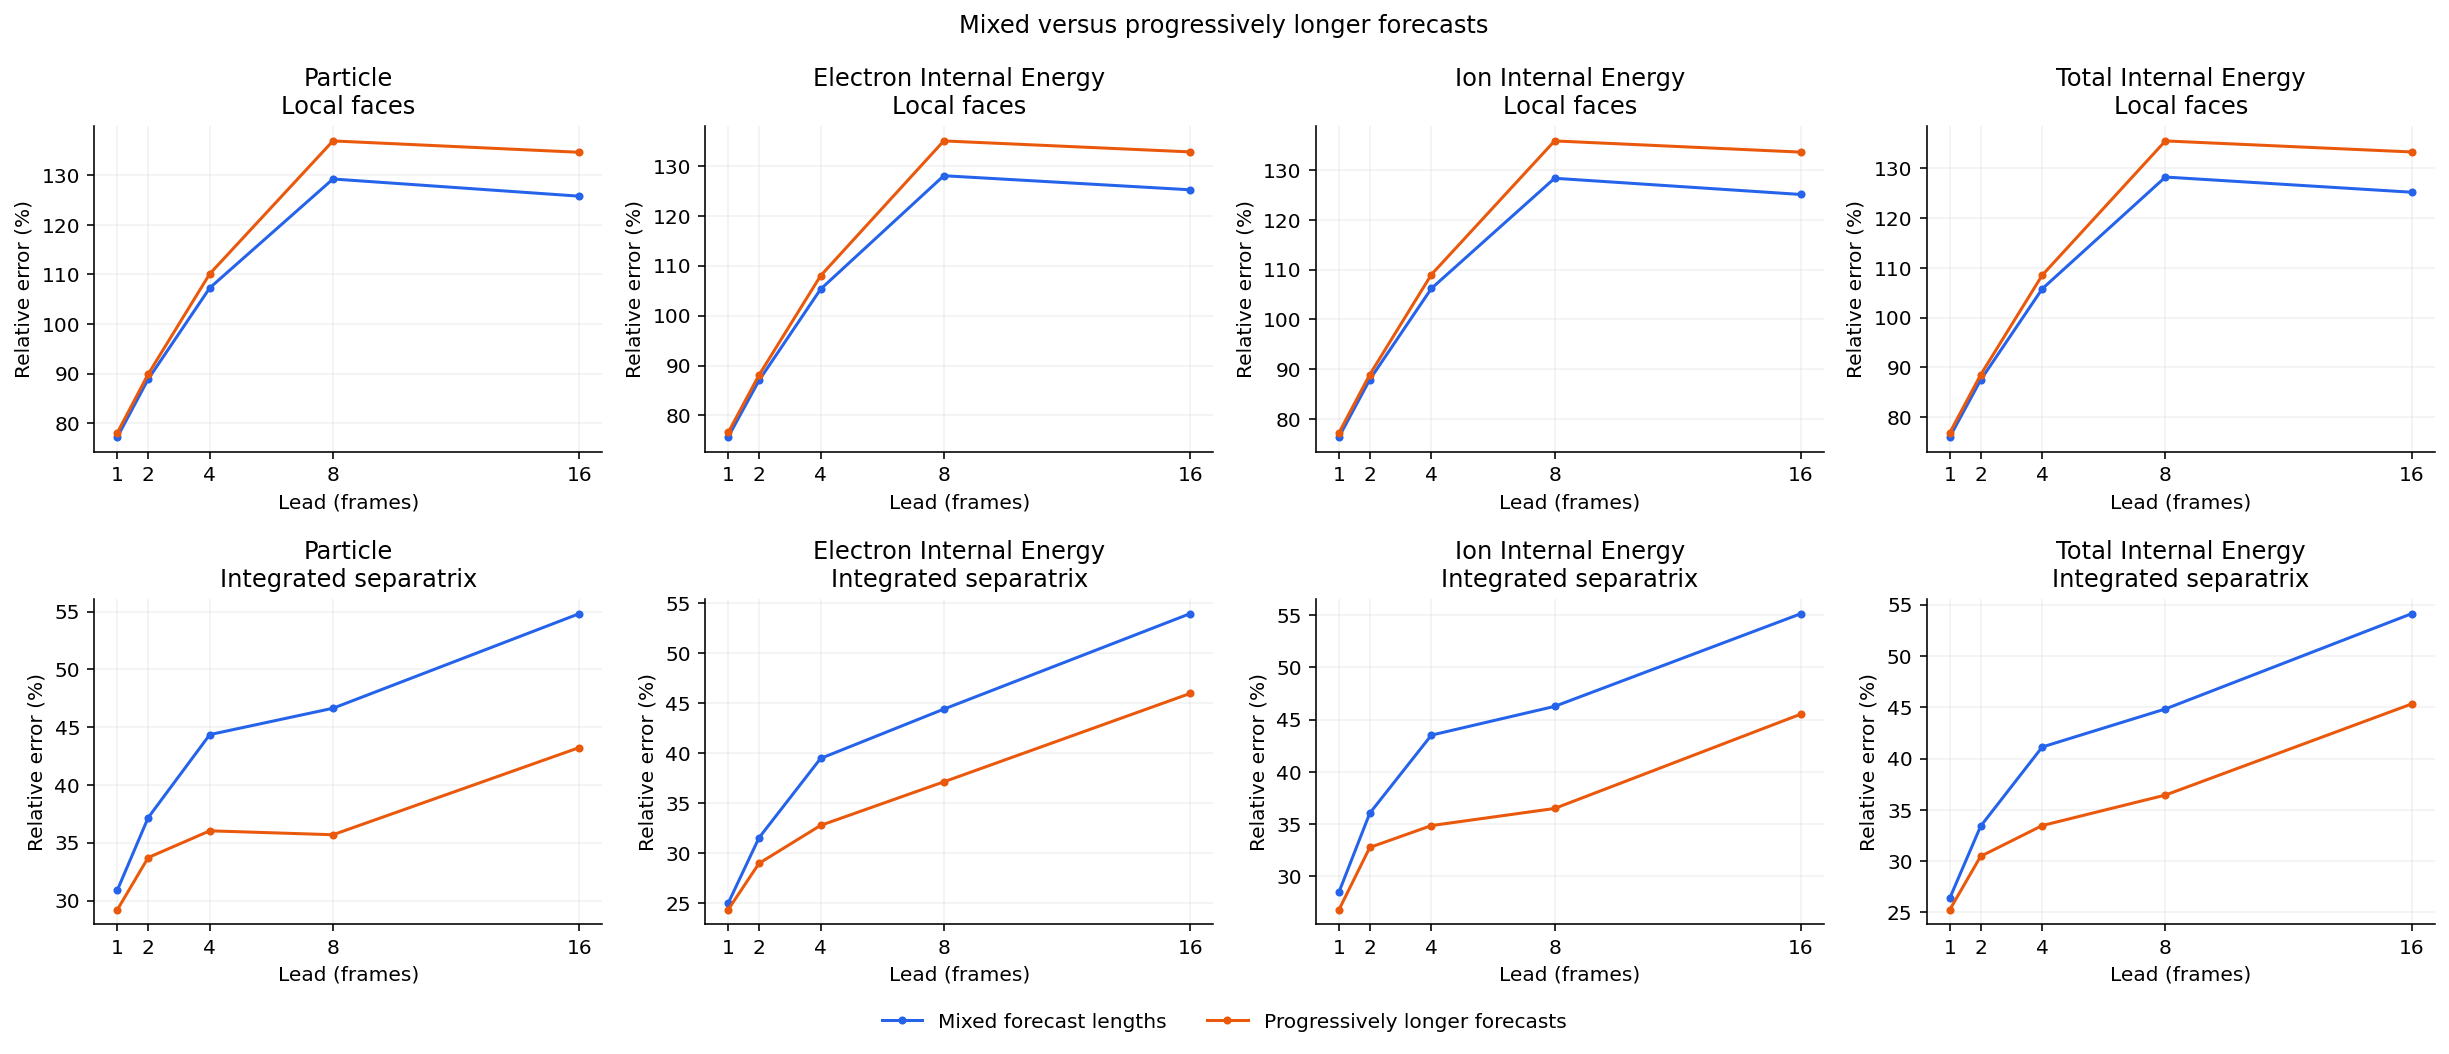
Early diffusion versus later full-target and residual diffusion. The early-to-later recipe changes are not a single-variable ablation. PNGFull-volume density spectrum across forecast leads. PNG · PDFFull-target versus residual diffusion: recovered target heat through time. PNGMore figures from the earlier reports (25)Truth autocorrelation by field and region PNGField errors: earlier deterministic and diffusion recipes PNGTarget heat: earlier recipes PNGEarlier diffusion: noise-level and conditioning probe PNGAll-field fluctuation errors PNGFluctuation power retained PNGElectron, ion and total target heat PNGParticle and energy transport PNGPhase and full complex cross-spectrum error PNGAll-field fluctuation errors PNGFluctuation power retained PNGElectron, ion and total target heat PNGParticle and energy transport PNGPhase and full complex cross-spectrum error PNGAll-field fluctuation errors PNGFluctuation power retained PNGParticle and energy transport PNGPhase and full complex cross-spectrum error PNGWhich intervention improves which error? PNGThe density power budget, mode by mode PNGWhere and when target-heat errors occur PNGDo gains persist through validation? PNGWhere field errors change PNGAll ten field pairs PNGSkill against the fitting-mean baseline PNG
All physical figures and movies
Earlier reports folded into one searchable collection. Historical model comparisons retain their original labels.
Simulation data: Ben Zhu and collaborators. Models and diagnostics: Stan DeLaurentiis. Results are development comparisons; adapted 85606 validation is not an untouched test. Current longer-data reconstruction and controlled diffusion experiments are still being evaluated.